位置与时间图
章节大纲
-
Drawing line graphs can help you understand motion. In this article, you’ll learn how to draw position-time graphs and how they show .
::绘图线图可以帮助您理解运动。 在文章中, 您将学习如何绘制位置- 时间图以及如何显示 。Q: What’s missing from the graph being drawn in the picture above?
::问题:在以上图中绘制的图表中缺少什么?A: The x- and y-axes are missing.
::A: X 和 Y 轴缺失。Graphing Position and Time
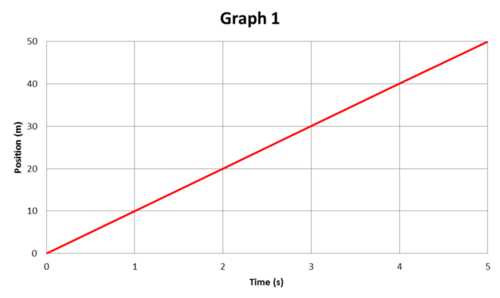
::图形位置和时间The motion of an object can be represented by a position-time graph like Graph 1 in the Figure . In this type of graph, the y-axis represents position relative to the starting point, and the x-axis represents time. A position-time graph shows how far an object has traveled from its starting position at any given time since it started moving.
::对象的动作可以用一个位置-时间图来表示,如图中的图1图1。在这种类型的图表中, Y 轴代表与起点相对的位置, x 轴代表时间。位置-时间图显示一个对象自开始移动以来在任何特定时间从其起始位置前进了多远。Q: In the Figure , what has the object traveled from the starting point by the time 5 seconds have elapsed?
::问题:在图中,在5秒过去之前,天体从起始点飞了多少?A: The object has traveled a distance of 50 meters.
::A:该物体已飞行50米远。Slope Equals Velocity
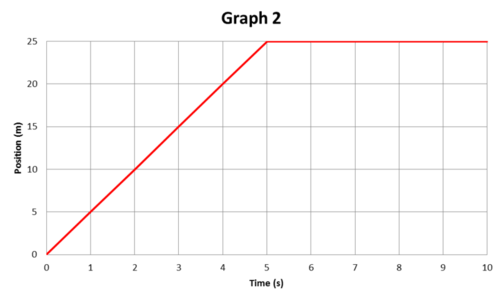
::斜坡等于速率In a position-time graph, the velocity of the moving object is represented by the slope, or steepness, of the graph line. If the graph line is horizontal, like the line after time = 5 seconds in Graph 2 in the Figure , then the slope is zero and so is the velocity. The position of the object is not changing. The steeper the line is, the greater the slope of the line is and the faster the object’s motion is changing.
::在位置-时间图中,移动对象的速度由图形线的斜度或陡度表示。如果图形线是水平的,如时后线=图图2图5秒,则斜度为零,速度也是零。对象的位置没有变化。越陡度,线的斜度越大,物体运动越快。Calculating Average Velocity from a Position-Time Graph
::从定位时间图中计算平均速率It’s easy to calculate the of a moving object from a position-time graph. Average velocity equals the change in position (represented by Δd) divided by the corresponding change in time (represented by Δt):
::很容易从位置- 时间图形中计算移动对象。 平均速度等于位置变化( 由 d 表示) 除以相应的时间变化( t 表示) :
::速度dtFor example, in Graph 2 in the Figure , the average velocity between 0 seconds and 5 seconds is:
::例如,在图图2图2中,0秒至5秒的平均速度是:
::速度 = 25 m-0 m5 s-0 s= 25 m5 s= 5 m/sWatch this two-part video series for more position vs. time graph examples.
::观看这个分为两部分的视频系列, 以了解更多位置与时间图示例 。Use the following PLIX Interactive to make a position-time graph for a runner who changes during their run:
::使用以下的 PLIX 互动来为运行期间变化的跑者绘制位置时间图 :Summary
::摘要-
Motion can be represented by a position-time graph, which plots position relative to the starting point on the y-axis and time on the x-axis.
::运动可以用位置-时间图表示,该图绘制相对于Y轴起点的位置和X轴起点的时间的位置。 -
The slope of a position-time graph represents velocity. The steeper the slope is, the faster the motion is changing.
::位置- 时间图的斜度代表速度。 斜度越高, 运动变化越快 。 -
Average velocity can be calculated from a position-time graph as the change in position divided by the corresponding change in time.
::平均速度可以从位置-时间图中计算,因为位置变化除以相应的时间变化。
Review
::回顾-
Describe how to make a position-time graph.
::描述如何绘制位置- 时间图 。 -
What is the slope of a line graph? What does the slope of a position-time graph represent?
::线形图的斜坡是什么? 位置- 时间图的斜坡代表什么 ? -
Can a line on a position-time graph have a negative slope, that is, can it slope downward from left to right? Why or why not?
::位置- 时间图上的线能否有一个负斜度, 也就是说, 它能从左向下向右倾斜吗? 为什么或为什么不能? -
In Graph 1 in the
Figure
, what is the object’s average velocity?
::图图1中,物体的平均速度是多少?
-
Motion can be represented by a position-time graph, which plots position relative to the starting point on the y-axis and time on the x-axis.