协调计划
章节大纲
-
In the last chapter, we had a way of showing the solution to our equation or inequality by graphing a point, a set of points, or an interval on one horizontal number line. For relationships of one variable , one number line suffices. However, in this chapter we now have two variables, so we need two number lines. How we arrange these two number lines is called the coordinate plane and we will discuss that in this section.

The Coordinate Plane
::协调计划The coordinate plane is a plane , or flat surface, where you can find points by specifying a pair of values or coordinates . It goes by many other names—the Cartesian coordinate system , named after René Descartes, the philosopher (famous for “I think, therefore I am”) and mathematician who initially proposed it, or the rectangular coordinate system .
::坐标平面是一个平面, 您可以通过指定一对数值或坐标找到点。 它使用许多其他名称—— 以雷内· 德卡托斯命名的笛卡尔坐标系统, 哲学家( 以“ 我认为, 因此我是 ” 著称 ) 和 最初推荐的数学家, 或者 矩形坐标系统 。The plane consists of two intersecting number lines that represent the values of each of the variables in algebraic statements. The two number lines intersect at 0 on each number line. We call this point the origin .
::平面由两个交叉编号行组成, 代表代数语句中每个变量的值。 两条数字线在每个数字线上以 0 相交。 我们称此点为起源 。
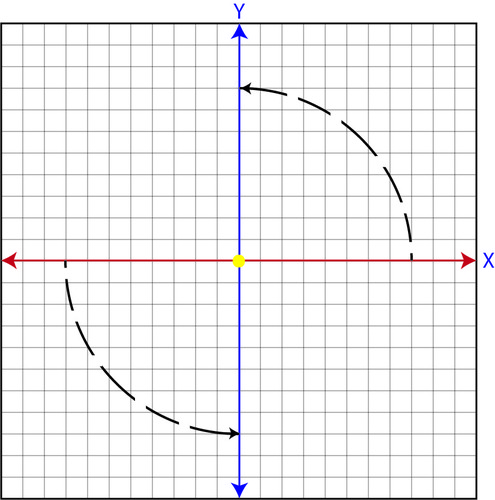
The horizontal number line, or x- axis , is exactly the same as the number lines we have drawn to represent our sets and/or solutions in previous chapters. The vertical number line, or y- axis , represents the values of the new variable we are adding, but it works the same way as the horizontal number line. The positive numbers are above the negative numbers. Another way to think about the y -axis is as a horizontal number line, or x -axis, turned 90 degrees counterclockwise. The graph below visually shows this rotation. The dotted line represents the rotation.
::水平数字线, 或 X 轴, 与我们在前几章中绘制的代表我们的组和/ 或解决方案的数字线完全相同。 垂直数字线, 或 Y 轴, 代表我们所添加的新变量的值, 但与水平数字线的值相同。 正数高于负数。 另一种思考 y 轴的方法是水平数字线, 或 x 轴, 逆时针旋转 90 度。 下图显示此旋转。 点线代表旋转 。The names of the axes vary based on your application. The horizontal number line represents your independent variable and the vertical number line represents your dependent variable . The independent variable is the variable that causes a result, that is measured by the dependent variable.
::轴的名称根据您的应用程序而不同。水平数字线代表您独立的变量,垂直数字线代表您依赖的变量。独立变量是导致结果的变量,由依赖变量测量。Example 1
::例1Identify the in the situations below.
::在下列情况中查明。a. The revenue , or amount of money a business earns from selling a product, versus the number of products sold
::a. 企业销售产品所得的收入或金钱数额与销售产品数量之比b. The number of hours versus the number of bacteria in a petri dish
::b. 花生盘中的细菌数与小时数之比Solution:
::解决方案 :a. It is usually easier to identify the dependent variable. First, ask whether the number of products sold depends on the revenue OR whether the revenue depends on the number of products sold. Since the revenue depends on the number of products sold, the revenue is the dependent variable and the number of products sold is the independent variable.
::a. 通常比较容易确定依赖变量。第一,问售出的产品数量是否取决于收入或收入是否取决于售出的产品数量,由于收入取决于售出的产品数量,收入是依赖变量,售出的产品数量是独立的变量。b. Does the number of hours depend on the number of bacteria or does the number of bacteria depend on the number of hours? Since the number of bacteria depends on the elapsed time, the number of bacteria is the dependent variable and the number of hours is the independent variable.
::b. 小时数取决于细菌数还是细菌数取决于小时数?由于细菌数取决于时间长短,细菌数取决于时间长短,因此,细菌数取决于变量,小时数取决于独立变量。In our coordinate plane, the number lines divide the plane into four quadrants that we label with roman numerals. The upper right quadrant is considered the first quadrant. The quadrants increase in a counterclockwise direction.
::在我们的坐标平面中,数字线将平面分为四个四位数,我们用罗马数字贴上标签。右上方的象限被认为是第一个象限。四位数反时向上升。
Solutions to a statement with two variables involve an x- value and a y- value. These pairs we call points or coordinate pairs or ordered pairs . We write them inside " data-term="Parentheses" role="term" tabindex="0"> parentheses and specify the value on the x -axis first, the x- coordinate or abscissa then the value on the y- axis, the y- coordinate or ordinate , so . (To remember this, they are ordered pairs as comes before in the alphabet). The graph below shows the signs (positive, or greater than zero and negative, or less than zero) of x and y in quadrants I, II, III, and IV.
::含有两个变量的语句的解决方案涉及 x 值和 Y 值。 我们调用点或坐标对对或定购对对, 我们在括号内写, 并指定 x 轴的值, x 坐标或 abscissa 然后指定 Y 轴的值, Y 坐标或 坐标, so (x,y) (记住, 它们是按字母表 y 之前的 x 顺序排列的对。 下图显示 x 和 y 的符号( 正数或大于 0 和 负数, 或小于 零) 。
Plotting Points
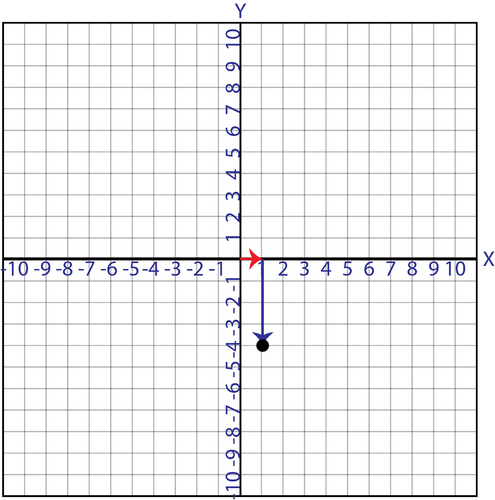
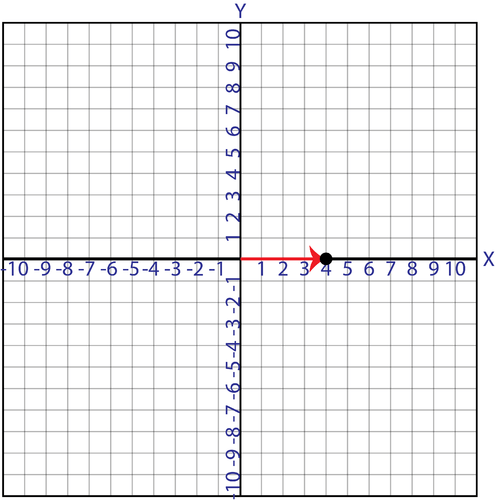
::绘图点To graph or plot a point, we start at the origin and then use the x- coordinate to determine how many spaces to move either to the left (negative) or right (positive). Then from that point on the x -axis, we use the y- coordinate to determine how many spaces to move either up (positive) or down (negative). For example, for (5,3), we would move five spaces to the right of the origin and then three spaces up.
::要绘制或绘制一个点, 我们从起始点开始, 然后使用 X 坐标来确定向左( 负) 或向右( 正) 移动的空格数 。 然后从 X 轴的该点开始, 我们使用 Y 坐标来确定向上( 正) 或向下( 负) 移动的空格数 。 例如, ( 5 3 ) , 我们将将五个空格移到起始点右边, 然后向上移动三个空格 。by CK-12 demonstrates how to label points given coordinates in the coordinate plane.
::CK-12表明如何在坐标平面上标出给定坐标点。Example 2
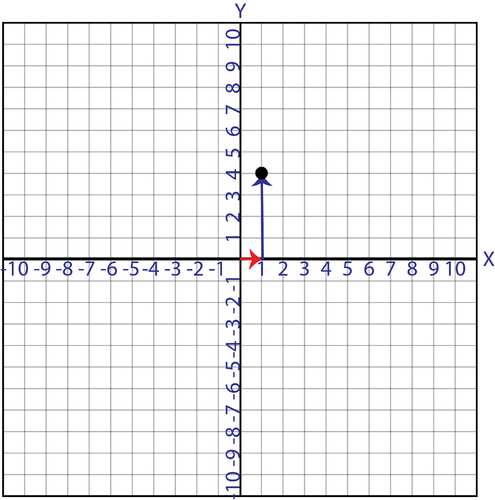
::例2Plot (1,4).
::绘图(1, 4) 。Solution: Start at the origin. First, find 1 on the x- axis and then go up 4 units to be in line with 4 on the y- axis.
::解答: 从源头开始。 首先, 在 x 轴上找到 1, 然后在 Y 轴上加四个单位, 与 y 轴上加四个单位 。Example 3
::例3Plot (-1,4).
::绘图(-1, 4) 。Solution: Again, start at the origin. Go to the left 1 unit and then, as in the previous example, go up 4 units.
::解答: 再次, 从源头开始。 转到左1个单元, 然后, 如上一个例子一样, 向上增加 4 个单元 。Example 4
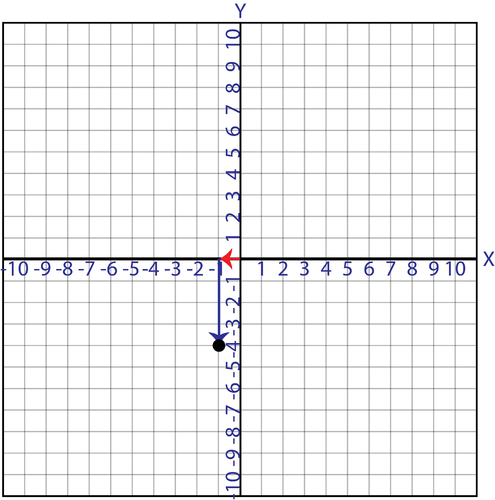
::例4Plot (-1,-4).
::绘图(1-4)至4。Solution: From the origin, go to the left 1 unit to line up with -1 on the x- axis. Then, go down 4 units.
::解答: 从源头, 到左1个单元, 在 X 轴上排到 - 1 。 然后, 下到 4 个单元 。Example 5
::例5Plot (1,-4).
::绘图(1,4)。Solution: Go to the right 1 unit and then go down 4 units.
::解答:到右边1个单元,然后往下4个单元。by CK-12 demonstrates how to locate points in the coordinate plane.
::由CK-12演示如何在坐标飞机上定位点。
Example 6
::例6Plot (0,4).
::绘制( 0, 4) 。Solution: Since the origin is at 0 on each axis, you do not have to move right or left for the x- coordinate. Go up 4 units for the y- coordinate.
::解决方案 : 由于每个轴的源值为 0, 您不必向右移动或向左移动 x 坐标。 为 y 坐标向上移动 4 个单位 。Example 7
::例7Plot (4,0).
::计价(4 0)Solution: Starting at the origin, go to the right 4 units. You do not have to go up or down since the y- coordinate is 0.
::解决方案: 从源头开始, 转到正确的 4 个单位。 您不必上下, 因为 Y 坐标是 0 。WARNING
::警告Do not switch the coordinates. They always go in alphabetical order , the first coordinate is the x- coordinate and the second coordinate is the y- coordinate.
::不切换坐标。 它们总是按字母顺序排列, 第一个坐标是 x 坐标, 第二个坐标是 Y 坐标 。For example, (4,0) is a point on the x- axis and not a point on the y- axis.
::例如, (4,0) 是 X 轴上的一个点, 而不是 Y 轴上的一个点 。Example 8
::例8Triangle is shown in the diagram below. Find the coordinates of the vertices , and C .
::三角 ABC 显示在下图中。请查找 A、B 和 C 顶点的坐标 。
Solution:
::解决方案 :A: This point is 2 units to the left and 5 units up, that is, (-2,5).
::A:这个点是左边2个单元,向上5个单元,即(2个,5个)。B: This point is 3 units to the right and 3 units down, or (3, -3).
::B点:向右3个单位,向下3个单位,或3个单位,-3个单位。C: This point is 4 units to the left and 1 unit down, or (-4, -1).
::C:这个点向左4个单位,向下1个单位,或(4 - 1),或(4 - 1)。by CK-12 shows a similar problem .
::CK-12 显示类似的问题。Feature: Locations on Earth
::地物:地球上的位置by Jen Kershaw, Pamela Watts, and Liz Krams
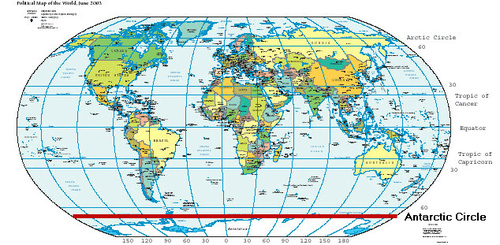
::Jen Kershaw, Pamela Watts, 和Liz Krams合编,Maps also use coordinates . Most maps use degrees. These define the location of cities, states, and other physical entities and landmarks. The y are measured by latitude , like -values, and longitude , like -values.
::地图还使用坐标。 多数地图使用度。 这些地图定义了城市、 州和其他物理实体和地标的位置。 它们用纬度测量, 如 x 值, 和经度测量, 如 Y 值 。Latitude is the measure, in degrees, of lines horizontally on a map. Longitude is the measure, in degrees, of lines vertically on a map. Depending on how the map is made, these lines are sometimes curved. These degrees are written as ordered pairs with the latitude listed first and the longitude listed second. Here is an example of a world map with the latitude and longitude lines overlaid on it. For lines to the left of 0° or below the equator, there is in implied negative sign. Sometimes coordinates are also written with directions. 30°S is the latitude line beneath the Tropic of Cancer on the map below.
::纬度是地图上水平线的度量。 经度是地图上垂直线的度量。根据绘制地图的方式,这些线有时会被弯曲。这些度是按顺序排列的,上面列出纬度,后面则列出纬度。这里是一张世界地图的示例,上面有纬度和经度线。对于赤道左面或下方的线,则有暗含的负号。有时,坐标也会用方向书写。下面的地图上,30°S是癌症热带下的纬线。You can identify different locations on a map if you have the coordinates of the location. For example, we can determine which country is located at 30°S, 140°E by f irst identifying the latitude line. In this case, it is below the Tropic of Capricorn line and it goes through Australia and South America.
::如果您有地图上的位置坐标, 您可以在地图上找到不同的位置。 例如, 我们可以确定哪个国家位于30°S, 140°E, 首先是确定纬度线。 在这种情况下, 它位于摩托热带线之下, 穿过澳大利亚和南美洲 。Next, identify the longitude line. In this case, it is off to the right and it seems to go mainly through eastern Europe and Australia. Then, decide where they converge. In this example, they both pass through Australia, so that is the country that exists at those coordinates.
::下一步, 确定经度线。 在此情况下, 它向右转, 似乎主要通过东欧和澳大利亚。 然后, 决定它们汇合到哪里 。 在此示例中, 它们都经过澳大利亚, 因此就是这些坐标处的国家 。Meteorologists use maps to track storms and other weather events. The map below is from the National Hurricane Center and was used to track the path of Hurricane Sandy in 2012.
::气象学家利用地图跟踪风暴和其他天气事件,下图来自国家飓风中心,2012年用于跟踪桑迪飓风的路径。
At what locations did the hurricane make landfall? Identify the locations by approximating the location's latitude and longitude.
::飓风在哪些地点造成登陆?通过接近该地点的纬度和经度来确定这些地点。by NASA shows an animation of satellite imagery of the life of Hurricane Sandy from its development in the Caribbean Sea through its track up the US East coast and landfall. The animation continues through Sandy's weakening to a remnant low pressure area.
::美国航天局(NASA)展示了“桑迪”飓风从加勒比海发展到美国东海岸和登陆的卫星图像动画。 该动画继续通过桑迪的衰弱持续到残余的低压力区。Summary
::摘要-
The coordinate plane is formed by two intersecting number lines, called the
x-
and
y-
axes. These number lines divide the plane into four quadrants.
::坐标平面由两个交叉数字线组成,称为 X 和 Y 轴。这些数字线将平面分为四个四方位。 -
To plot a point, first find the
x-
coordinate on the
x-
axis, then find out where that meets the
y-
coordinate on the
y-
axis.
::要绘制一个点, 首先在 X 轴上找到 x 坐标, 然后找出在 y 轴上与 Y 坐标相匹配的坐标 。
Review
::回顾Plot the following points in the coordinate plane.
::在坐标平面上标出以下各点。1. (4,-1)
2. (-5,3)
3. (0,-3)
4.
5.
Identify the plotted points.
::标明绘图点 。
6. A
::6. A 级7. B
::7. B. 7 B8. C
::8. C. C.Determine which quadrant the following points are in.
::确定以下各点在哪个象限内。9. (-3,5)
10. (2,-2)
11. (-1,-3)
12. (4,1)
by CK-12 may be helpful to answer the problems above.
::CK-12也许有助于回答上述问题。Explore More
::探索更多1. Name two other points on the line that contains (-2,-5) and (3,-5).
::1. 列出一行内另两点(第2、第5和第3、第5段)。2. Describe the shape created by plotting the following points.
::2. 描述通过绘制下列要点而形成的形状。a. (0,-4), (0,3), (3,-4), (3, 3)
::a. (0,4),(0,3),(3,4),(3,3),(3,3)b. (-2,0), (-4,2), (-4,5), (-1,5), (-1,2)
::b. (-2,0, (4, 2), (4, 5), (1, 5), (1, 2)by CK-12 may be helpful to answer the problem above.
::CK-12 可能有助于回答上述问题。3. Two points that are reflections of each other are the same distance from a central line or point. (You can think of this like seeing yourself in a mirror. Your image appears to be the same distance from the mirror as you are). Find the reflections of the following points across the x- and y- axes and the origin.
::3. 相互反射的两点与中线或中点的距离相同。 (你可以想象在镜子中看到自己,你的图像似乎与镜子的距离相同)。在 X 和 Y 轴以及源头查找以下点的反射。)a. (3,2)
::a. (3,2)b. (-4,-3)
::b. (4-4-3)c. (-2,0)
::c. (-2,0)by Mathispower4u may be helpful to answer the problem above.
::Mathispower4u或许有助于解答上述问题。4. What country is at the following locations?
::4. 下列地点是哪个国家?a. 60 º N, 120 º E
::a. 60°N, 120°Eb. 30 º S, 60ºW
::b. 30°S, 60°W5. Before archaeologists start to dig at a site, they establish a grid to systematically record where they find artifacts. If an archaeologist places the origin of the grid in the center of the site, what coordinates could they use to record the following artifacts?
::5. 在考古学家开始在一个地点挖掘之前,他们先建立一个网格,系统记录他们在哪里发现文物,如果考古学家将网格的起源置于地点中心,他们用什么坐标来记录下列文物?a. 3 units north and 2 units west
::a. 北3个单位和西2个单位b. 4 units south and 5 units west
::b. 南面4个单位和西面5个单位c. 1 unit south and 4 units east
::c. 南1个单位和东4个单位Answers for Review and Explore More Questions
::回顾和探讨更多问题的答复Please see the Appendix.
::请参看附录。PLIX
::PLIXTry this interactive that reinforces the concepts explored in this section:
::尝试这一互动,强化本节所探讨的概念: -
The coordinate plane is formed by two intersecting number lines, called the
x-
and
y-
axes. These number lines divide the plane into four quadrants.