图形平方根函数
章节大纲
-
How far away you can see to the horizon is a function of your eye height, , where v is the visible distance , and h is your eye height above the ground 1 .
::你能看到地平线的距离有多远 取决于你的眼睛高度, v=1.225h, 其中V是可见距离, h是你在地上的眼睛高度1。We can compare how far one can see at different heights by graphing this function. We discuss how to graph square root functions like this one in this section.
::我们可以通过图形化这个函数来比较人们在不同高度所能看到的距离。 我们讨论如何在本节中用图形化平方根函数。
Graphing Square Root Functions
::图形平方根函数The standard form of a square root function is the square root with all the transformations shown.
::平方根函数的标准形式是显示所有变换的平方根。Standard Form of a Square Root Function
::平根函数的标准格式where are all real numbers.
::y=ax -h+k, 其中a,h,k都是真实的数字。When we multiply the function by a positive constant , like a, we change the size of the function, i.e., a dilation . If a is negative, we also reflect the function across the x -axis. h indicates a shift to the left or the right; k indicates a shift up or down.
::当我们将函数乘以正常数时,像一个常数,我们改变函数的大小,即放大。如果一个函数为负值,我们也反映 X 轴的函数。h 表示向左或向右的转换;k 表示向上或向下移动。Recall that the square root function has a domain problem. We cannot take the square roots of negative numbers. We constantly need to keep this in mind when choosing values for our graph.
::回顾平方根函数存在域的问题。 我们不能选择负数的平方根。 在为图形选择值时, 我们总是需要记住这一点 。Steps for Graphing a Square Root Function
::平根函数绘图步骤1. Determine the domain of the function.
::1. 确定职能领域。2. Pick x -values in the domain of the function, and find the y -values that correspond with them. (An endpoint of the domain is a helpful value to pick.)
::2. 在函数域中选择 x 值,并找到与其相对应的 Y 值。 (域的终点是用于选择的有用值。 )3. Plot the points and draw the graph.
::3. 绘制点和图。It is also helpful to keep the perfect squares in mind when choosing x -values.
::在选择 x 值时要记住完美的方形也是有益的。Example 1
::例1Graph , the parent graph .
::图y=x, 父图。Solution: First we need to determine the domain by setting the radicand greater than or equal to 0: . We should use zero and values greater than zero.
::解决方案 : 首先我们需要确定域 , 设定的弧度大于或等于 0 : x0 。 我们应该使用零, 值大于 0 。Next we create a table of values, including the endpoint of the domain, 0.
::接下来我们创建一个数值表, 包括域的终点, 0。x y 9 3 4 2 1 1 0 0 Lastly, we plot the points and draw the graph.
::最后,我们绘制要点,绘制图表。Example 2
::例2Graph .
::图y=x-2+5。Solution: First we need to determine the domain. . We should not choose a value less than 2.
::解决方案: 首先我们需要确定域名 。 x-202。 我们不应该选择少于2的值。To get other x -values, keep the perfect squares in mind. Since underneath the radical you are going to subtract 2, add 2 to the perfect squares.
::为了获得其他的 x 值, 请记住完美的方形 。 由于在基底下您要减去 2 , 并且将 2 添加到 完美的方形 。x y 2 5 1+2=3 6 4+2=6 7 9+2=11 8 Next, plot your points and draw your graph.
::下一位,绘制你的点数,绘制你的图表。After plotting the points, we see that the shape is exactly the same as the parent graph. It is just shifted up 5 and to the right 2.
::在绘制了点后,我们看到形状与母图完全相同。 它只是向上移了 5 和向右移到了右移 2 。Example 3
::例3Graph . Find the domain and range .
::图y=3x+1. 查找域和范围。Solution: The domain is . Let's make a table by subtracting 1 from the perfect square values.
::解析度 : 域名是 x+1+0\\\\\\\\\\\\\\\\\\\\\\\\\\\\\\\\\\\\\\\\\\\\\\\\\\\ x\\\\\\\\\\\\\\\\\\\\\\\\\\\\\\\\\\\\\\\\\\\\\\\\\\\\\\\\\\\\\\\\\\\\\\\\\\\\\\\\\\\\\\\\\\\\\\ x\\\\\\\ x\\\\\\\\\\ x\\\\在表格中,让我们做一个表格 从一个表格 从完全平方值中减去 1。 从平方值中减去 1。x y -1 0 1–1=0
3 4 – 1=3 6 9 – 1=8 9 16 – 1=15 12 Next we plot these points and draw the graph.
::接下来我们绘制这些点,绘制图表。Notice that this graph grows much faster than the parent graph due to the factor of 3.
::请注意,由于3的系数,这个图的生长速度比母图快得多。Example 4
::例4Graph .
::图f(x)=-x-2+3。Solution: The domain is .
::解答: 域是 x% 2 。Let's make a table and draw the graph.
::让我们做一张桌子,绘制图表。x y 2 3 1+2=3 2 4+2=6 1 9+2=11 0 16+2=18 -1 The factor of -1 in front of the radical, we now see, results in a reflection over x -axis.
::现在我们看到,在激进分子面前的 -1系数 导致X轴反射。Example 5
::例5Graph .
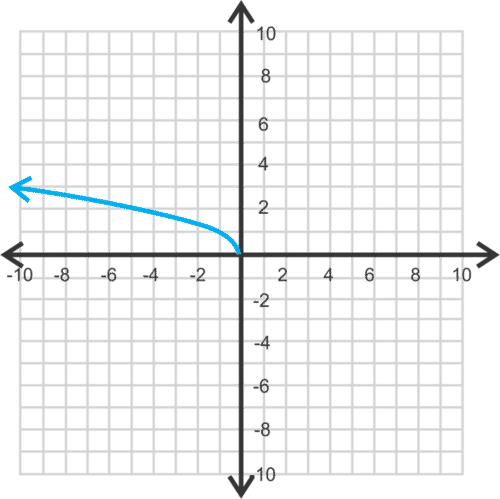
::图 y x。Solution: The domain of the function is .
::解析度: 该函数的域为 -x0x0。This graph is a reflection of the parent graph over the -axis. To get the x- values, multiply the x- values from the parent graph by -1.
::此图是 Y 轴上方的父形图的反射。 要获取 x 值, 请将父形图中的 x 值乘以 - 1 。Example 6
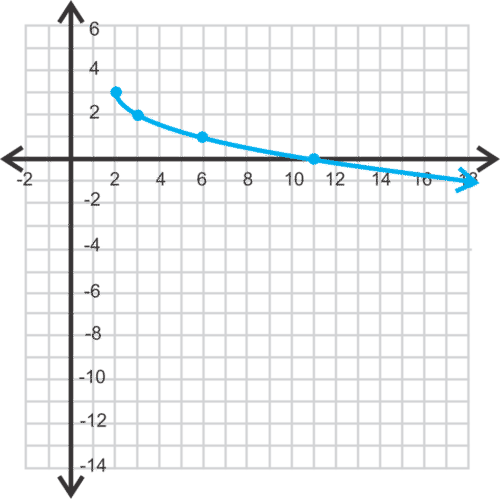
::例6How far away you can see is a function of your height, , where v is the visible distance and h is your eye height above the ground. Graph the function.
::您可以看到的距离有多远是您身高的函数, v=1.225h, 其中 v 是可见距离, h 是您在地面上的眼睛高度。 绘制函数 。Solution: We can essentially take the outputs from the parent graph and multiply them by 1.225.
::解决方案:我们基本上可以从母图中取出输出,然后乘以1.225。
by Mathispower4u demonstrates how to perform transformations to the graph of the square root function.
::由 Mathispower4u 演示如何对平方根函数的图形进行转换。Feature: When Objects Collide in Video Games
::特写: 当对象在视频游戏中相撞时by Meredith Beaton
::梅雷迪思·贝顿(签名)Almost every video game involves objects touching each other, whether it is birds smashing into pigs, blocks fitting together, or characters bouncing off one another. This type of interaction within the game is known as "collision detection." When developers create games, one of the most important decisions they need to make is how realistic or accurate they want the collision detection to be.
::几乎每一场电子游戏都涉及物体相互触碰,不管是鸟儿撞入猪圈、相互搭配的区块,还是人物相互跳动。 游戏中这种互动被称为“银河探测 ” 。 当开发商创造游戏时,他们需要做出的最重要决定之一是他们希望碰撞探测有多现实或准确。Why It Matters
::为何重要Video game collision detection relies on basic laws of physics and a little bit of math to give players a realistic experience. By thinking of the objects colliding as points in space, we can calculate the distance between the two points as a vector. This distance vector can be calculated by taking the square root of the sum of the squares of each component of the vector (this is essentially the Pythagorean Theorem).
::视频游戏碰撞探测依靠物理基本定律和一些数学来给玩家提供现实的经验。通过将碰撞对象视为空间点,我们可以计算两个点之间的距离作为矢量。此距离矢量可以通过矢量每个组成部分的平方和的平方根来计算(这基本上是Pythagoren神话 ) 。The distance between two points in space is , which we derive from the Pythagorean Theorem . We will be considering this formula in the chapter on Conic Sections.
::空间中两个点之间的距离是(x2-x1)2+(y2-y1)2,这是我们从毕达哥伦定理理论中得出的。我们将在关于二次曲线的章节中考虑这一公式。
By using these basic geometric principles and a little algebra, programmers can make the playing experience more or less realistic. For instance, in one game, objects may be highly sensitive to distance and a player may lose a life just by getting near an object. In another game, developers may combine the force of impact and the distance between two colliding objects to determine what happens to the objects after collision, thereby making the game more realistic.
::通过使用这些基本的几何原理和略微代数,程序员可以使游戏体验或多或少地现实化。例如,在一个游戏中,对象对距离可能非常敏感,玩家可能仅仅靠接近一个对象而失去生命。在另一个游戏中,开发者可以将撞击力和两个碰撞对象之间的距离结合起来,以确定碰撞后物体发生的情况,从而使游戏更加现实。by ThinMatrix demonstrates how 3D game developers detect collisions .
::3D游戏开发者如何探测碰撞。Summary
::摘要-
To graph a square root function, determine the domain, choose 3 to 5 values in the domain for a table of values, plot them, and draw the graph originating from (h,k).
::要绘制平方根函数图,确定域,在域中为数值表格选择 3 至 5 个值,绘制它们,并绘制源自 (h,k) 的图表。
Review
::回顾Graph the following square root functions and find the domain and range:
::绘制以下平方根函数图并查找域和范围:1.
::1. f(x)=x+22.
::2. y=x-5-23.
::3.y=-2x+14.
::4. f(x)=1+x-35.
::5. f(x)=12x+86.
::6. f(x)=3x+67.
::7.y=21-x8.
::8. y=x+3-59.
::9. f(x)=4x+9-810.
::y=-32x-3+6 y=- 32x-3+611.
::11.y=-35-x+712.
::12. f(x)=23-x-9Explore More
::探索更多1. Write the equation for each function graphed below.
::1. 写下下列各函数的方程。a.
::a 。b.
::b. b. 数据2. Write the equation of a square root function with starting point passing through .
::2. 写入平方根函数的方程式,起点(6,3)通过(10,15)。Answers for Review and Explore More Problems
::回顾和探讨更多问题的答复Please see the Appendix.
::请参看附录。PLIX
::PLIXTry these interactives that reinforce the concepts explored in this section:
::尝试这些强化本节所探讨概念的交互作用 :References
::参考参考资料1. "Horizon," last edited May 23, 2017,
::1. 2017年5月23日最后一次编辑的《霍里松》, -
To graph a square root function, determine the domain, choose 3 to 5 values in the domain for a table of values, plot them, and draw the graph originating from (h,k).