对对数函数
章节大纲
-
Economists often use to estimate small changes in a rate or index in an easier manner. For example, if we wanted to find the percent change of the consumer price index (CPI) between two years, we could estimate it by using logarithms. A graph is helpful if we want to find many values at one time.
::经济学家经常用比较容易的方式估算一个汇率或指数的微小变化。 比如,如果我们想在两年之间找到消费物价指数(CPI)的百分比变化,我们可以使用对数来估算。 如果我们想同时找到许多数值,图表是有用的。We cover graphing logarithmic functions in this section.
::我们在本节中覆盖对数函数的图形化。
Domain of Logarithmic Functions
::对数函数域域域Recall the definition of the logarithmic function from the previous section.
::回顾上一节对数函数的定义。Logarithmic Functions
::对对数函数The logarithmic function is the function and is equivalent to where and .The logarithmic function is the inverse of the exponential function and vice versa. As we discussed when we looked at , this means the intervals for the domain and the range of the exponential function are going to switch for the logarithmic function. This creates a domain problem.
::对数函数是指数函数的反向函数,反之亦然。正如我们在查看时讨论过的,这意味着域的间隔和指数函数的范围将转换为对数函数。这造成了域的问题。Domain and Range of Logarithmic Functions
::对数函数的域域和范围For and :
::f( x) = logbx 和 f-1( x) = bx :
::多姆(bx) = (- , ) 多姆(logbx) = (0, ) , ran(bx) = (0, ) , ran(logbx) = (- , )As we noted in the previous section, you can only take the logarithm of positive numbers. Let's see how we can approach this domain problem with an example.
::正如我们在前一节中指出的,你只能使用正数的对数。让我们看看我们如何用一个例子来处理这个域的问题。Example 1
::例1Find the domain of .
::查找 y=log3}(x- 4) 的域 。Solution: We want to be greater than 0. We set it greater than 0 and solve.
::解析度: 我们希望 x-4 大于 0。 我们设定它大于 0 并解析 。Inputs that are greater than 4 will work with this function.
::x-4>0x>4dom( log3( x-4)) =( 4, ) = (4, ) 大于 4 的输入将使用此函数 。Example 2
::例2Find the domain of .
::查找 f( x) =ln ( x+3) 的域 。Solution: To evaluate this logarithm, must be greater than 0.
::解决方案: 要评估此对数, x+3 必须大于 0 。
::x+3>0x>-3dom( ln( x+3)) = (-3, )Notice there are negative numbers included in this domain. This is acceptable as long as
::请注意此域中包含负数。 只要我们使用x+3的对数是正数, 这是可以接受的 。by Anil Kumar demonstrates how to find the domain of logarithmic functions.
::Anil Kumar展示了如何找到对数函数的域 。Graphs of Logarithmic Functions
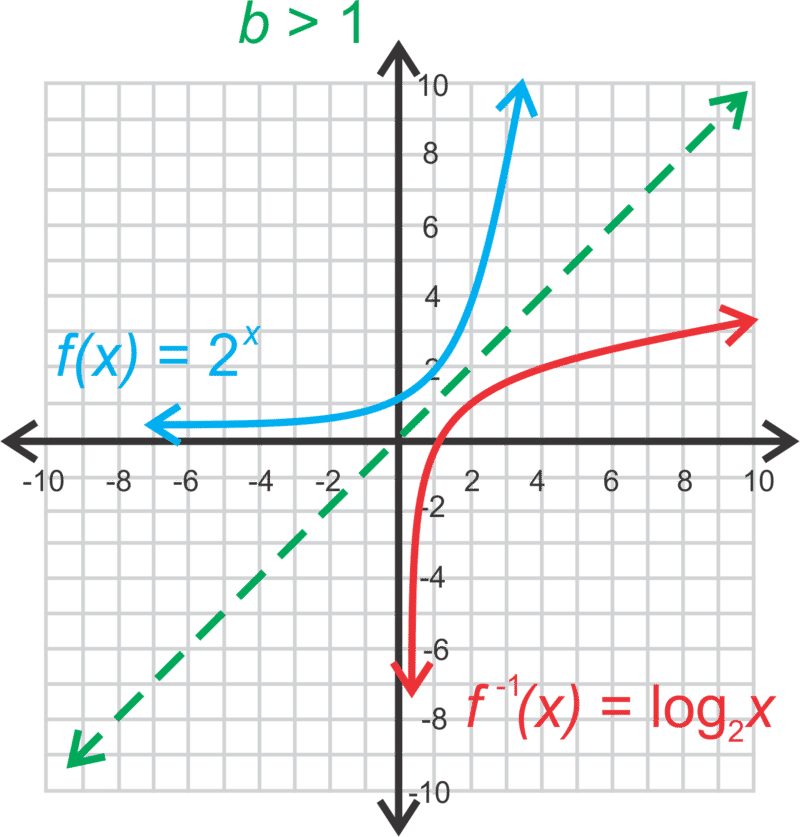
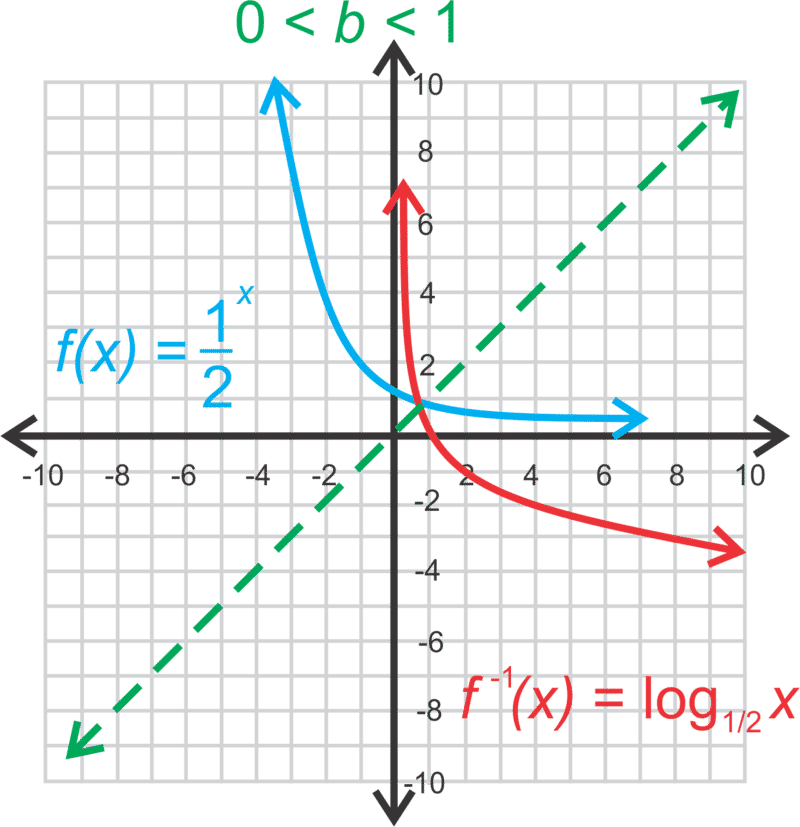
::对数函数图形图Recall that functions are inverses of each other when they are symmetric across the line . Therefore, if we reflect over , then we will get the graph of . For example, if or the graphs would appear as below.
::当函数在 y=x 线上对称时, 函数是反对的。 因此, 如果我们在 y=bx 上反射 y=x, 那么我们就会得到 y=logbx 的图形。 例如, 如果 b=2 或 b=12, 图形会显示在下面 。Recall that an exponential function has a horizontal asymptote. Because the logarithm is its inverse, it will have a vertical asymptote.
::提醒注意指数函数具有水平等同值。由于对数是它的反向,它将有一个垂直等同度。Properties of the Graph of
::y=logbx 的图形属性-
The domain is
or
.
::域是 x>0 或 (0,\\\\\) 。 -
The range is all real numbers.
::范围都是真实的数字。 -
There is a vertical asymptote of
.
::有 x=0 的垂直空点 。 -
The
-intercept is (1,0). There is no
-intercept.
::X 界面是 1,0 。 没有 Y 界面 。 -
If
, the function is increasing like in the graph above.
::如果 b>1, 该函数正像上图所示一样增长 。 -
If
, the function is decreasing like in the graph above.
::如果 0<b<1, 函数会像上图一样下降 。
Example 3
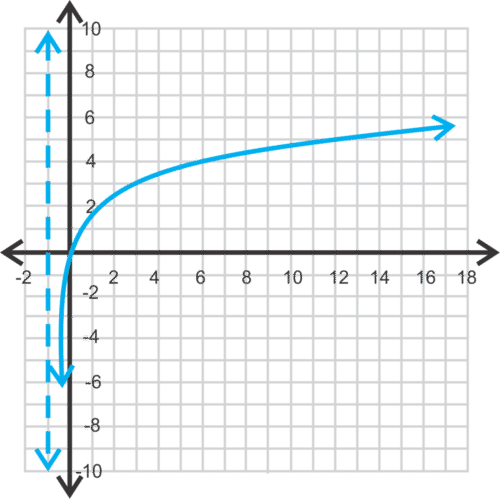
::例3Graph
::图y=logx。Solution: Make a table of values.
::解决方案: 绘制一个数值表。-1 1 0 10 1 Plot these points and draw the graph. The graph below also shows for comparison.
::绘制这些点并绘制图表。下图还显示y=10x以比较。
How to Graph Logarithmic Functions
::如何图形对数函数1. Identify the domain of the function so you know which values you can choose for your table.
::1. 标明函数的域,以便知道您可以为表格选择哪些值。2. Create a table of three values.
::2. 创建三个数值的表格。- When choosing values, it is helpful to choose powers of the base.
::- 在选择数值时,选择基数的力量是有帮助的。- If there is a horizontal shift, add the value of to powers of the base.
::- 如果存在横向变化,则将h的值加到基数的功率上。3. Draw the vertical asymptote if it is not one of the axes.
::3. 如果不是轴之一,则绘制垂直零点。4. Graph the logarithmic curve.
::4. 绘制对数曲线图。by CK-12 discusses how to graph logarithmic functions.
::在 CK-12 中讨论如何图形化对数函数。Standard Form of a Logarithmic Function
::对数函数的标准格式The standard form of a logarithmic function is where and are real numbers and .
Example 4
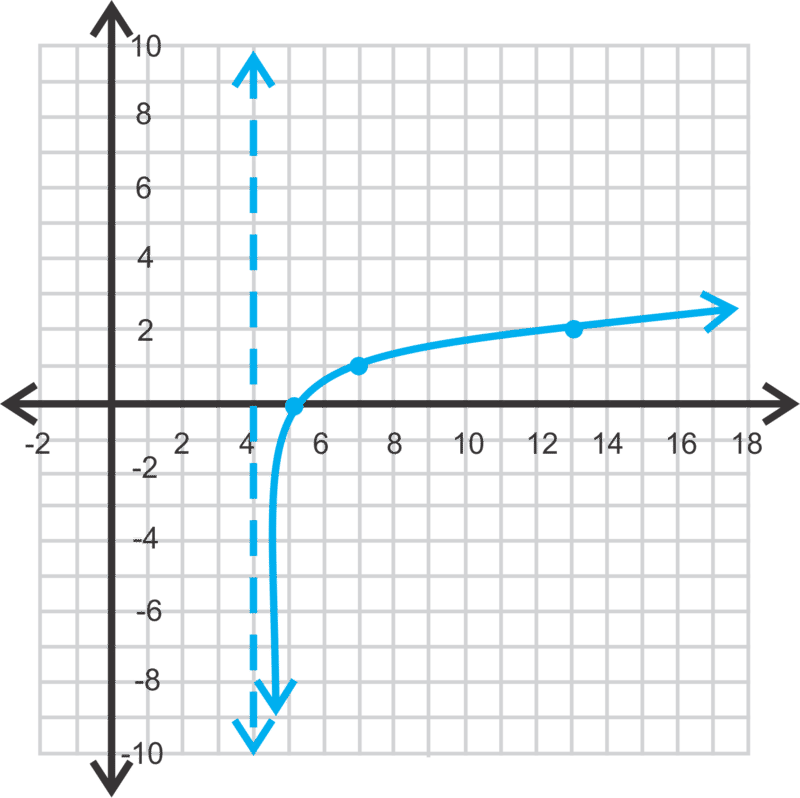
::例4Graph . State the domain and range.
::图 y= log3 (x- 4) 说明域和范围 。Solution: We have a horizontal shift of 4 units to the right. This affects which -values we choose for our table. We choose values of the form to an integer power plus .
::溶液:我们向右水平移动了4个单位。这影响到我们为表格选择的 x 值。我们选择了表b 的值为整数功率加 h。The asymptote at is going to move to the right 4 units as well, and become . Now that we have points, we can plot them and draw the graph.
::x=0 时的星点将移到右边的 4 个单位, 并变成 x= 4 。 现在我们有了点, 我们可以绘制它们并绘制图表 。The domain is and the range is all real numbers.
::域为 x> 4, 范围为所有实际数字 。Example 5
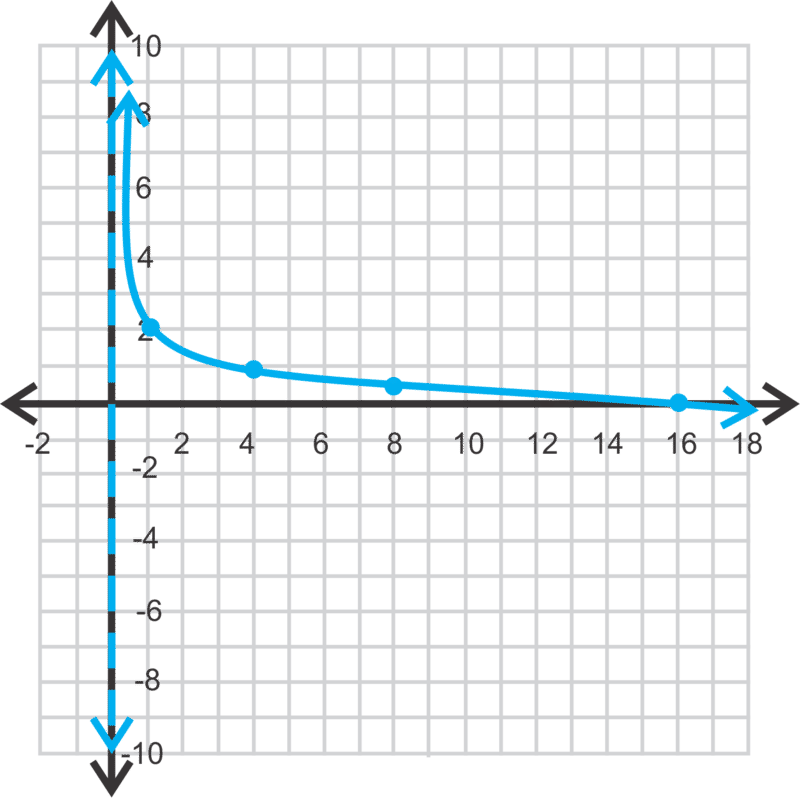
::例5Graph . State the domain and range.
::y=log14x+2. 说明域和范围。Solution: Since there is no horizontal shift, we can choose values for that are "easier" powers of 4. The vertical asymptote remains at as well.
::解答:由于没有水平变化, 我们可以选择 x 的“ 容易” 功率为 4 的值 。 垂直无效状态也位于 x=0 。1 2 4 1 8 0.5 16 0 With our points, we can draw the following graph:
::以我们的观点,我们可以绘制下图:The domain is and the range is all real numbers.
::域为 x>0, 范围为所有实际数字 。by Sandra Ofili shows how to graph transformations of logarithmic functions.
::桑德拉·奥菲利教授如何图形化对数函数的转换。WARNING
::警告Note that we tend not to write the argument of a logarithm surrounded by parentheses if it is only one term—for example, However, if the argument has more than one term we use parentheses—for example, This becomes important when differentiating between, for example
::x+2log(x+2) ================================================================================================================================= ============================================================================================Example 6
::例6Graph . Find the domain and range.
::图形 y=-logx. 查找域和范围。Solution: This graph should be a reflection of the graph from Example 3 across the -axis. Our table of values is
::解析度: 此图应该反映 X 轴横跨 X 轴从 例 3 的图解。 我们的数值表是1 1 0 10 -1 Next we plot the points and draw the graph.
::接下来我们绘制点和图。The domain is and the range is all real numbers.
::域为 x>0, 范围为所有实际数字 。How to Graph Logarithmic Functions With Desmos
::如何用 Desmos 绘制对数函数To graph logarithmic functions in Desmos, use the underscore, _ (Shift Hyphen), to input the base.

How to Graph Logarithmic Functions With TI-83/84
::如何用 TI-83/84 绘制对数函数To graph a logarithmic function using a TI-83/84, enter the function into Y= and use the formula. For Example 5, the keystrokes would be: , GRAPH
::要用 TI-83/84 绘制对数函数,请将函数输入到 Y= 中,并使用公式。对于例5, 键对数为: Y=log(x)log(14)+2, GRAPHTo see a table of values, press 2 nd and then GRAPH .
::要查看数值表,请按2,然后按GRAPH。
Example 7
::例7The consumer price index (CPI) for urban consumers was 242.839 in January 2017. It was 236.916 in January 2016 1 . Find the percent change and use the function to show that it is approximately the same. Graph and find the point that corresponds to this situation.
::城市消费者消费物价指数(CPI)在2017年1月为242.839,2016年1月为236.916,2016年1月为236.916,找出百分比变化,并使用该函数y=ln(CPI2017CPI2016)来显示其大致相同。图y=lnx,并找到与这种情况相应的点。Solution: Percent change can be calculated using the formula
::解决方案:可以通过公式计算百分比变化
::百分比变化=新值 - 原值 - 原值 x100 。Using this formula, we have
::使用这个公式,我们有
::百分比变化=CPI2017-CPI2016CPI2016x100=242.839-236.91623696.916x100=2.5%If we calculate the natural log of the ratio of the two CPIs, we should get a percent change that is close to this result.
::如果我们计算两个消费物价指数之比的自然日志, 我们应该有一个接近这个结果的百分率变化。
::y=(CPI2017CPI2016)=ln (242.839236.36.916)=0.02468=2.468%
::在图表中,如果我们输入比例为1.025, 对应的输出略高于x轴, 大约为0.02468。 下面是 y=ex 和 y= lnx 的图形 。
Example 8
::例8Sketch a graph of .
::绘制 f( x) =2ln ( x+1) 的图形 。Solution: To sketch a graph of a natural log function, we can estimate it with . Here, the outputs are doubled and the graph has shifted to the left 1 unit, including the vertical asymptote, which is now .
::解答: 要绘制自然日志函数的图表, 我们可以使用 y=log3 {%x 来估计它。 在这里, 输出加倍, 图形已移到左1个单位, 包括垂直的单数, 现在为 x= 1 。Summary
::摘要-
To find the domain of a logarithmic function, set the argument greater than 0 and solve. The values that are part of the solution are the domain of the function.
::要找到对数函数的域, 请设置大于 0 的参数并解析。 作为解决方案一部分的值是函数的域 。 -
To graph a logarithmic function, find the domain, make a table of values with three values determined by the powers of the base, draw the vertical asymptote if it is not one of the axes, and graph the curve.
::要绘制对数函数,请查找域,绘制由基点功率决定的三种数值的数值表,如果不是轴之一,则绘制垂直零点,并绘制曲线图。
Review
::回顾Graph the logarithmic functions below. State the equation of the asymptote, the domain, and the range of each function.
::绘制下面的对数函数。请说明无时点的方程、域和每个函数的范围。1.
::1. y=log5x2.
::2. y=log2x+13.
::3. y=log2(x+1)4.
::4.y=logx-45.
::5. y=log13(x-1)+36.
::6. ylog12(x+3) - 57.
::7.y=log4(2-x)+2Determine if the following are solutions to the equations:
::确定以下是否是方程的解决方案:8. Is (3, 8) on the graph of ?
::8. (3,8)是否在y=log3+7的图中(2x-3)+7?9. Is (9, -2) on the graph of ?
::9. y=log14(x)-5的图表上是否(9,-2)?10. Is (4, 5) on the graph of ?
::10. y=5log2(8-x)是否在图中(4,5)?Explore More
::探索更多1. The amplitude, or loudness, of certain sound waves in a recording studio can be measured by the equation is measured in decibels and is the intensity of a barely audible sound (about watts per square meter), and I is the actual intensity 2 . If a sound's intensity is half the original value, by how many decibels does the loudness decrease? Round your answer to the nearest hundredth.
::1. 录音室中某些声波的振幅或响度可以用方程式L(I)=10log(II0)L(I)测量,L(I)是用分贝测量的,是微小声音的强度(大约每平方米瓦特),而我是实际强度。如果声音的强度是原值的一半,则以声波减少多少分贝来测量?你的回答是大约100倍。2. The speed of certain light waves in the outer space can be measured by the equation where , measured in km/s, is the intensity of a barely detectable light radiation, and I is the actual radiation we get from the light waves 3 . If the light's radiation is doubled, by how many kilometers per second does the speed increase? Round your answer to the nearest hundredth.
::2. 可以用公式L(I)=1,000log(II0)来衡量外层空间某些光波的速度。L(I)以公里/秒计量,L(I)是几乎无法探测的光辐射的强度,而我是我们从光波3 获得的实际辐射。如果光线的辐射加倍,速度增加多少公里?将答案转至最近的100倍。3. T he Richter scale measures the magnitude of an earthquake. The magnitude is actually the logarithm base 10 of the amplitude of the quake. That is 4 , . Based on this formula, how many times stronger is an earthquake with magnitude 4 than a earthquake with magnitude 3?
::3. 里氏级测量地震的大小,其大小实际上是地震振幅的对数基10,即4,m=logA。根据这个公式,4级地震比3级地震强多少倍?4. How would the graph of , for compare to the graph of ?
::4. g(x) = log2 (x-a) 的图形如何与 f(x) = log2 x 的图形相比较, 表示 > 0 的 g(x) = log2 (x-a) 的图形如何比较?5. How would the graph of for compare to the graph of ?
::5. g(x) =-alog2x 的图形如何与 f(x) =log2x 的图形相比较?Answers for Review and Explore More Problems
::回顾和探讨更多问题的答复Please see the Appendix.
::请参看附录。References
::参考参考资料1. "CPI Detailed Report: Data for January 2017,"
::1. “CPI详细报告:2017年1月的数据”,2. "Decibel," last edited May 16, 2017,
::2. “Decibel”, 2017年5月16日最后一次编辑,3. "Observatories Across the Electromagnetic Spectrum," last updated February 2013,
::3. “跨电磁频谱的观测台”,2013年2月最新更新。4. "Richter Magnitude Scale," last updated June 4, 2017,
::2017年6月4日更新 -
The domain is
or
.