参数和参数去除
章节大纲
-
Introduction
::导言In a parametric equation , the variables and are not dependent on one another. Instead, both variables are dependent on a 3rd variable, . Usually will stand for time. A real-world example of the relationship between , and is the height, weight, and age of a baby.
::在参数方程中,变量 x 和 y 并不互相依赖。 相反,这两个变量都取决于第三个变量, t。 t 通常代表时间。 x,y 和 t 之间的关系的真实世界示例是婴儿的身高、体重和年龄。Both the height and weight of a baby depend on time, but there is also clearly a positive relationship between just the height and weight. By focusing on the relationship between the height and weight and letting time hide in the background, you create a parametric relationship between the three variables.
::婴儿的身高和体重都取决于时间,但仅仅身高和体重之间显然也存在正关系。通过关注身高和体重之间的关系,并让时间隐藏在背景中,就可以在三个变量之间建立参数关系。What other types of real-world situations are modeled with parametric equations?
::以参数方程为模型的另一种真实世界情况是什么?Parametric Equations
::参数等量Note for Using TI Calculators
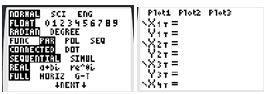
::使用 TI 计算器注释In your graphing calculator there is a parametric mode. Once you put your calculator into parametric mode, on the graphing screen you will no longer see Instead, you will see:
::在您的图形计算计算器中有一个参数模式。 一旦您将计算器放入参数模式, 在图形屏幕上您将不再看到 y 。 相反, 您将会看到 :Notice how, for plot one, the calculator is asking for two equations based on variable :
::注意,对于图1,计算器要求两个方程式 以变量T为基础:
::x1T=f( t)y1T=g( t)To transform a parametric equation into a rectangular equation , you need to do a process called "eliminating the parameter ." To do this, you must solve the equation and substitute this value of into the equation or vice versa. This will produce a rectangular equation of based on .
::要将参数方程式转换成矩形方程式, 您需要做一个名为“ 消除参数” 的过程。 要做到这一点, 您必须解析 x=f( t) 方程式, 并将这个 t 的值替换为 y 方程式, 反之亦然。 这将产生一个基于 x 的 y 矩形方程式 。There are two major benefits of graphing in parametric form . First, it is straightforward to graph a portion of the parametric equations using the and in the window setting. Second, parametric form enables you to graph projectiles in motion and see the effects of time.
::以参数形式绘制图形有两大好处。 首先,使用 Tmin、Tmax 和 Tstep 来绘制部分参数方程的图解是直截了当的。 其次, 参数形式可以使您在运动中绘制射弹图, 并看到时间的影响 。The following video defines parametric equations and shows how to graph a parametric equation by hand:
::以下视频界定了参数方程,并展示了如何用手绘制参数方程图:The following video explains how to write a parametric equation in rectangular form:
::以下视频解释如何以矩形形式写出参数方程式:The following video explains how to write the given in Cartesian form as parametric equations:
::以下影片解释如何以笛卡尔形式写成参数方程式:Examples
::实例Example 1
::例1Eliminate the parameter in the following equations:
::消除下列方程式中的参数:
::x=6t--2y=5t2-6tSolution:
::解决方案 :Solve for t in the 1st equation.
::在第一方程式中解决 t。Substitute this value for into the 2nd equation.
::x=6t- 2x+26 = 将 t 的这个值作为第 2 方程式的替代值 。
::y=5(x+262)-6(x+26)Example 2
::例2For the given parametric equation, graph over each interval of .
::对于给定的参数方程,用图显示 t 之间的每一间距。
::x=t2 - 4y=2t1)
::1)-202)
::2) 053)
::3)-32Solutions:
::解决办法:Start by finding the coordinates where indicates the graph will start and end. You can then use any other points to fill in the graph.
::从找到坐标开始, t 表示图的开始和结束。 然后您可以使用任何其他点来填充图中 。1) For and indicate that the points (0, -4) and (-4, 0) are the endpoints of the graph.
::1) 至-20, t2, 和 t=0, 表示点(0, 4)和(4, 0)是图的终点。
2)
::2) 05
3)
::3)-32
Example 3
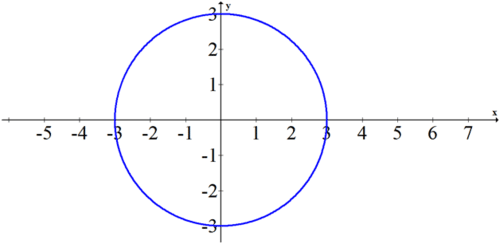
::例3Eliminate the parameter and graph the following parametric curve with the domain
::将参数删除,用域 t[0,2] 绘制以下参数曲线图:
::x=3sinty=3costSolution:
::解决方案 :When parametric equations involve trigonometric functions, you can use the Pythagorean Identity .
::当参数方程式包含三角函数时,您可以使用 Pythagorean 身份 sin2\\\ t+cos2\ t=1 。In this problem, (from the 1st equation) and (from the 2nd equation).
::在此问题上,sin@t=x3(来自第1个方程式)和cost=y3(来自第2个方程式)。Substitute these values into the Pythagorean Identity, and you have
::将这些价值 替换为毕达哥里人的身份
:x3)2+(y3)2=1x2+y2=9。
This is a circle centered at the origin with radius 3.
::这是一个圆, 以原点为中心, 半径为 3 。Example 4
::例4Recall the question from the Introduction: What other types of real-world situations are modeled with parametric equations?
::回顾导言中的问题:用参数等式模拟了哪些其他类型的现实世界情况?Solution:
::解决方案 :Parametric equations are often used when only a portion of a graph is useful. By limiting the domain of , you can graph the precise interval of the function you want. Parametric equations are also useful when two different variables jointly depend on a 3rd variable, and you wish to look at the relationship between the two dependent variables. This is very common in statistics where an underlying variable may actually be the cause of a problem, and the observer can only examine the relationship between the outcomes they see. In the physical world, parametric equations are exceptional at graphing position over time, because the horizontal and vertical vectors of objects in free motion are each dependent on time, yet independent of one another.
::参数方程式通常在只有图表的一部分才有用时使用。 通过限制 t 的域, 您可以绘制您想要的函数的精确间隔。 当两个不同的变量共同依赖第三个变量时, 参数方程式也是有用的, 您想要查看两个依赖变量之间的关系。 这在统计中非常常见, 其中潜在的变量实际上可能是问题的原因, 观察者只能检查它们所看到的结果之间的关系 。 在物理世界中, 参数方程式在时间的图形位置上是例外的, 因为自由运动对象的横向和垂直矢量都取决于时间, 而彼此独立 。Example 5
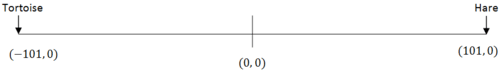
::例5A tortoise and a hare start 202 feet apart and race to a flag halfway between them. The hare decides to take a nap and give the tortoise a 21-second head start. The hare runs at 9.8 feet per second, and the tortoise hustles along at 3.2 feet per second. Who wins this epic race and by how much? Use your calculator to model the race.
::一只乌龟和一只野兔相距202英尺,在它们中间的半个地方奔向国旗。 野兔决定午睡,给乌龟起首21秒。 野兔以每秒9.8英尺的速度奔跑, 乌龟以每秒3.2英尺的速度奔跑。 谁赢得了这场史诗比赛? 用你的计算器来模拟这场比赛。Solution:
::解决方案 :First, draw a picture and then represent each character with a set of parametric equations.
::首先,绘制一张图片,然后用一套参数方程代表每个字符。The tortoise's position is (-101, 0) at and (-97.8, 0) at . You can deduce that the equation modeling the tortoise's position is:
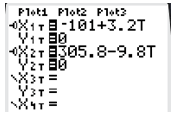
::乌龟的位置是 (- 101, 0) t=0 和 (- 97.8, 0) t=1。 您可以推断, 乌龟位置的公式是 :
::x1101+3.21=0The hare's position is (101, 0) at and (91.2, 0) at . Note it does not make sense to make equations modeling the hare's position before 21 seconds have elapsed because the hare is napping and not moving. You can set up an equation to solve for the hare's theoretical starting position had he been running the whole time.
::兔子的位置是 (101, 0) t=21 和 (91.2, 0) t=22 。 注意, 在 21 秒之前对兔子的位置进行方程式模拟是没有道理的, 因为兔子正在午睡, 没有移动。 您可以设置一个方程式来解决兔子的理论起始位置, 如果他一直运行着的话 。
::x2=b-9.8t101=b-9.821306.8=bThe hare's position equation after can be modeled by:
::T=21之后的兔子位置方程式可模拟如下:
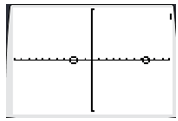
::x2=306.8-9.82=0The tortoise crosses when . The hare crosses when . The hare wins by about a foot.
::乌龟十字x=0时为31.6。 兔子十字x0时为31.3时为31.0。 兔子以一英尺左右赢得胜利 。There are many settings you should know for parametric equations that bring questions like this to life. The TI-84 has features that allow you to see the race happen.
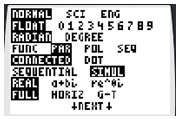
::您应该知道许多参数方程的设置, 给这样的问题带来生命。 TI- 84 具有能让您看到比赛发生的特性 。First, set the mode to simultaneous graphing. This will show both the tortoise's and hare's positions at the same time.
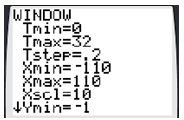
::首先, 设置同步图形绘制模式。 这将同时显示龟和兔子的位置 。Next, change the graphing window so that varies between 0 and 32 seconds. The determines how often the calculator will calculate points. The larger the , the faster and less accurately the graph will plot. Also, change the to vary between -110 and 110 so you can see the positions of both characters.
::接下来,修改图形窗口,使 t 在 0 至 32 秒之间变化。 Tstep 将决定计算点的频率。 图的绘制速度越大, 速度越快, 精确度越小。 另外, 将 x 更改为 - 110 和 110 秒, 这样您就可以看到两个字符的位置 。Input the parametric equations. Toggle to the left of the and change the cursor from a line to a line with a bubble at the end. This shows their positions more clearly.
::输入参数方程式。 切换到 x 的左侧, 并将光标从一行修改为一行, 在结尾处插入一个气泡的直线。 这样可以更清楚地显示它们的方位 。Now when you graph, you can watch the race unfold as the two position graphs race towards each other.
::现在,当你的图表,你可以看 比赛的展开 当两个位置的图表 冲向对方。Summary
::摘要-
Eliminating the parameter
is a phrase that means to turn a parametric equation that has
and
into just a relationship between
and
.
::去除参数是一个短语,意指将具有 x=f(t) 和 y=g(t) 的参数方程转换为y和 x之间的关系。 -
Parametric form
refers to a relationship that includes
and
.
::参数形式是指包含 x=f(t) 和 y=g(t) 的关系。 -
Parameterization
means to write or describe in parametric form.
::参数化是指以参数形式写作或描述。
Review
::回顾Eliminate the parameter in the following sets of parametric equations:
::消除下列几组参数方程中的参数:1.
::1. x=3t- 1;y=4t2-2t2.
::2. x=3t2+6t;y=2t- 13.
::3. x=t+2;y=t2+4+44.
::4. x=t-5;y=t3+15.
::5. x=t+4;y=t2-5For the parametric equation , graph over each interval of .
::参数方程式 x=t,y=t2+1, t之间每一间隔的图形。6.
::6-217.
::7.--108.
::8.--119.
::9.-2210.
::10. - 5511. Eliminate the parameter and graph the following parametric curve: .
::11. 删去参数并用下列参数曲线图解:x=sint,y4+3cost。12. Eliminate the parameter and graph the following parametric curve: .
::12. 删去参数和图解如下参数曲线:x=1+2cost,y=1+2sint。13. Using the previous problem as a model, find a parameterization for the circle with center (2, 4) and radius 3.
::13. 以前一个问题为模型,为圆圆找到一个参数化,以中间(2、4)和半径3为中心。14. Find a parameterization for the ellipse . Use the fact that . Check your answer with your calculator.
::14. 为椭圆 x24+y225=1. 寻找参数。 请使用 cos2\\\ t+sin2\\\ t=1. 使用计算器检查您的回答 。15. Find a parameterization for the ellipse . Check your answer with your calculator.
::15. 查找椭圆(x-4)29+(y+1)236=1的参数化。 使用计算器检查您的回答。Review ( Answers )
::回顾(答复)Please see the Appendix.
::请参看附录。 -
Eliminating the parameter
is a phrase that means to turn a parametric equation that has
and
into just a relationship between
and
.