数据图形显示
章节大纲
-
Introduction
::导言Data related to sports events, health crises, political campaigns, and many other situations can be collected and analyzed in a number of different ways. While two common types of graphic displays are bar charts and histograms, several other options may be useful, depending on one's goal in analyzing and presenting data. These different types of displays can help us summarize data and tell a story, but choosing among them is key. For example, both bar charts and histograms use vertical or horizontal bars to represent the number of data points in each category or interval .
::与体育赛事、健康危机、政治运动和许多其他情况相关的数据可以多种不同方式收集和分析。虽然两种常见的图形显示类型是条形图和直方图,但其他几种选择可能有用,这取决于一个人在分析和提交数据方面的目标。这些不同类型的显示可以帮助我们总结数据并讲述一个故事,但选择其中的关键是。例如,条形图和直方图都使用垂直或水平条条来代表每个类别或间隔的数据点数。Suppose Dr. Alameda has given all her computer science classes an exam. She has created a frequency table for the scores, but needs a better way to display the data. How can she do this?
::假设阿拉梅达博士给她所有的计算机科学班都做了考试。她为得分创建了一个频率表,但需要更好的方法来显示数据。她怎么能这样做呢?
Graphic Displays of Data
::数据图形显示There are a few common ways of displaying data graphically that you should be familiar with:
::以图形方式显示数据有几种常见方式, 您应该熟悉这些方式 :1) A pie chart shows the relative proportions of data in different categories. are excellent ways of displaying categorical data with easily separable groups. The pie chart below shows six categories labeled . The size of each pie slice is determined by the central angle.
:1) 派图显示不同类别数据的相对比例。 派图是用容易分解的组别显示绝对数据的极好方法。 下面的派图显示标签为A-F的六个类别。 每个派片的大小由中心角度决定。
Determining the Central Angle for a Pie Chart
::确定饼饼图的中心角Since there in a circle, the size of the central angle
::由于在圆圈内有o360o,A类的中央角°A的大小可见于
::A360 数据点类别中的数据点数。The following video discusses a specific example of a pie chart related to voters in a particular district:
::以下影片讨论与特定地区选民有关的饼饼图的一个具体例子:Play, Learn, and Explore with Pie Charts:
::播放、学习和探索《派奇图表》:2) A bar chart displays frequencies of categories of data. The bar chart below has 5 categories, and shows the TV channel preferences for 53 adults. The horizontal axis could also have been labeled News, Sports, Local News, Comedy, Action Movies. The bars in a bar graph do not touch, because the bars represent categories and not continuous numbers. For example, just because you split your time between channel 8 and channel 44 does not mean on average you watch channel 26. Categories can be numbers, so you need to be very careful.
::2) 条形图显示数据类别的频率。下面的条形图有5个类别,显示53个成年人的电视频道偏好。水平轴也可能被贴上“新闻”、“体育”、“当地新闻”、“喜剧”、“动作电影”标签。条形图中的条形不触动,因为条形图代表的是类别,而不是连续数字。例如,仅仅因为您在8频道和44频道之间的时间分隔,并不表示您平均看26频道,类别可以是数字,所以您需要非常小心。The following video gives other examples of graphical displays, including pie charts and bar graphs:
::以下视频提供了图形显示的其他示例,包括饼图和条形图:3) A histogram displays frequencies of quantitative data that have been sorted into intervals. Unlike the bar graph, the bars in a histogram do touch, because the bars represent categories of continuous numbers. Below is a histogram that shows the heights of the 53 students in a class. Notice that in this histogram, an interval ends at the same number that the next interval begins. For instance, 52 is the end of the 1st interval and the beginning of the 2nd interval. This overlapping number does not mean that the data point is counted in each interval. Instead, the 1st interval would include data points between and the 2nd interval would include data points between . In other words, 52 is the upper limit of the 1st interval, but the data point itself is included in the interval in which it is the lower limit. Also, note that in this histogram, t he largest category is 56-60 inches, with 18 people.
::3) 直方图显示按间隔排序的定量数据的频率。 与条形图不同的是, 直方图中的条形线会触动, 因为直方图代表连续数字的类别。 下面是直方图, 显示一个班级53名学生的高度。 注意在这个直方图中, 一个间隔以下一个间隔开始的相同数字结束。 例如, 52 是第一个间隔的结束, 以及第二个间隔的开始。 这个重叠数字并不意味着数据点在每个间隔中计算。 相反, 第一个间隔包括48°x < 52, 第二个间隔包括52°x < 56之间的数据点。 换句话说, 52 是第一个间隔的上限, 但数据点本身包含在下限的间隔中。 另外, 注意在这个直方图中, 最大的类别是56- 60英寸, 18人。If you wanted to create a frequency table from this histogram, you would need to tally the number of people whose height falls into each interval. For the example above, you would get the following frequency table:
::如果您想要用此直方图创建一个频率表, 您需要计算每个间距内身高的频率表。 例如, 您将得到以下的频率表 :Interval Frequency 48-52 1 52-56 2 56-60 18 60-64 15 64-70 16 70-74 1 The following video goes into more depth on defining, interpreting, and creating a histogram from data:
::以下视频更深入地描述、解释和根据数据制作直方图:Play, Learn, and Explore with Histograms:
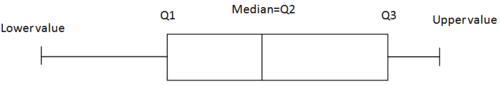
::使用直方图播放、学习和探索:4) A boxplot (also known as a box-and-whiskers plot ) is another way to display quantitative data. It displays the five-number summary (data minimum , , of the data, , and data maximum). The box can either be vertically or horizontally displayed, depending on the labeling of the axis. The box does not need to be perfectly symmetrical because it represents data that might not be perfectly symmetrical.
::4) 框块(也称为盒式和耳机图)是显示量化数据的另一种方式。它显示五号摘要(数据的最低数据、Q1、Q3和数据的最大值)。该框可以垂直显示,也可以水平显示,取决于轴的标签。该框不需要完全对称,因为它代表的数据可能不是完全对称的。Play, Learn, and Explore with Boxplot:
::用 Boxplot 玩、学习和探索游戏:Examples
::实例Example 1
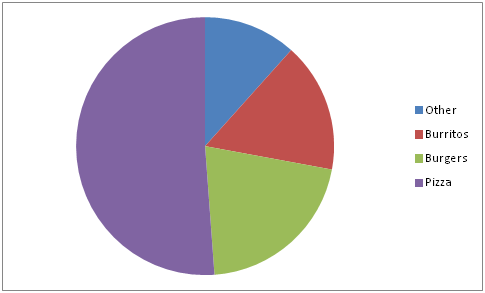
::例1Create a pie chart to represent the preferences of 43 hungry students.
::制作一个派图, 代表43名饥饿学生的偏好。-
Other – 5
::其他 - 5个 -
Burritos – 7
::倾角 - 7 -
Burgers – 9
::汉堡汉堡 - 9 -
Pizza – 22
::披萨 - 22
Solution:
::解决方案 :Since there are a total of 43 students, each category is going to be based out of 43. Divide the amount by 43 to find the percent of the circle that each segment represents, or multiply the fraction by 360 to get the central angle.
::由于学生总数为43人,每个类别将以43人为基础,将数额除以43,以找到每个部分所代表圆圈的百分率,或将分数乘以360,以获得中心角。For Other:
::其他:543=0.116279...11.6%或543×36041.86For Burritos:
::Burritos: 743=0.16279. 16.3%或743x360=58.60For Burgers:
::汉堡:943=0.2093... 20.9%或943×360=75.35For Pizza:
::披萨:2243=0.5116279 51.2% 或 2243×360 184.19
Example 2
::例2
Create a bar chart representing the preference for sports of a group of 33 people.
::创建一张代表33人组偏好运动的条形图。-
Football – 12
::足球 - 12 -
Baseball – 10
::棒球 - 10 -
Basketball – 8
::篮球 - 8 -
Hockey – 3
::曲曲琴 - 3
Solution:
::解决方案 :Create a bar for each sport. The height should match the value for that category.
::为每次运动创建一个栏。 高度应该与该类的值相符 。
Example 3
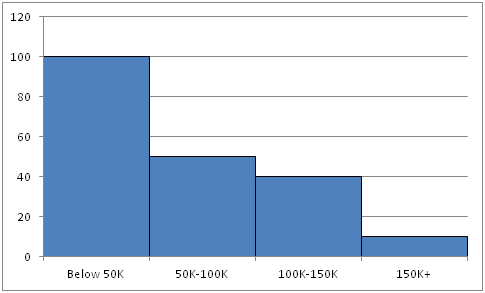
::例3Create a histogram for the income distribution of 200 million people.
::建立2亿人收入分配的直方图。-
Below $50,000 is 100 million people
::低于50 000美元的人口为1亿,低于50 000美元 -
Between $50,000 and $100,000 is 50 million people
::50 000至10 000 000美元之间是5 000万人 -
Between $100,000 and $150,000 is 40 million people
::100 000 000至150 000美元之间的人口为4 000万人 -
Above $150,000 is 10 million people
::超过150 000美元的人口为1 000万人
Solution:
::解决方案 :Create a bar for each interval. The height should match the number of people (in millions) for that interval.
::为每个间隔创建一栏。 高度应该与该间隔的人数( 以百万计) 相符 。Example 4
::例4Recall the problem from the Introduction: Dr. Alameda created a frequency table for the exam scores for her computer science class, but needs a better way to display the data. How can she do this?
::回顾导言中的问题:阿拉梅达博士为她的计算机科学课的考试分数创建了一个频率表,但需要更好的方法来显示数据。她怎么能这样做呢?Solution:
::解决方案 :Dr. Alameda has created a frequency table representing the scores on the computer science exam for all her classes. The frequency table is difficult to read and interpret, so Dr. Alameda wants to create a graphical display.
::阿拉梅达博士创建了一个显示她所有班级的计算机科学考试分数的频率表。 频率表很难读和解释, 所以阿拉梅达博士想要创建一个图形显示。Computer Science Test Scores Bins : Test Scores Frequency 0-50 17 51-60 9 61-70 35 71-80 81 81-90 123 91-100 81 Dr. Alameda can make a histogram to represent the data. This is the best method for graphically illustrating frequency data.
::阿拉梅达博士可以制作直方图来代表数据。 这是用图形显示频率数据的最佳方法 。To make a histogram, first draw the horizontal and vertical axes.
::要绘制直方图,请先绘制水平(x)轴和垂直轴。
Next, label the horizontal axis. The horizontal axis lists the different categories of data. In this case, the category will be "Scores."
::下一步,标签水平轴。水平轴列出数据的不同类别。在此情况下,该类别将是“共号 ” 。Next, label the vertical axis. The vertical axis lists the quantity or amount of the data. In this case, the category will be "Frequency."
::下一步,标签垂直轴。垂直轴列出数据的数量或数量。在此情况下,类别为“数量”。Next, title the graph. The title of the graph should be short and clear. It should explain what data are presented in the graph. In this case, the title will be "Computer Science Exam Scores."
::接下来是图表的标题。 图表的标题应该简短清晰。 它应该解释图表中显示的数据。 在这种情况下, 标题将是“ 计算机科学考试分数 ” 。Then, determine the units on the vertical axis. To do this, start by reviewing the smallest and largest frequencies in the table. The smallest value is 9, and the largest is 123. Based on these values, label the vertical axis from 0 to 140. Since the range of the frequency values is large, the units should also be large. The vertical axis should use a unit of 20.
::然后,确定垂直轴上的单位。要做到这一点,首先从审查表中最小和最大的频率开始。最小值为9,最大值为123。根据这些值,将垂直轴标为0至140。由于频率值的范围很大,这些单位也应该是大的。垂直轴应该使用20的单位。Next, draw the vertical columns. To do this, write each bin along the horizontal axis. Then draw each column vertically until it reaches the frequency for that score. For example, draw a vertical column to the number 17 for the bin 0-50. Do not leave spaces between the columns.
::下一步, 绘制垂直列。 要做到这一点, 请在水平轴上写下每个文件箱。 然后垂直绘制每个文件箱, 直至达到该分数的频率。 例如, 为 bin 0- 50 绘制一个垂直列到数字 17 。 不要在列间留下空格 。The answer is the graph should look like the one below.
::答案是图表应该看起来像下面的图。Example 5
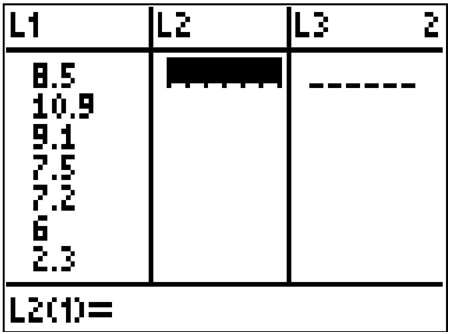
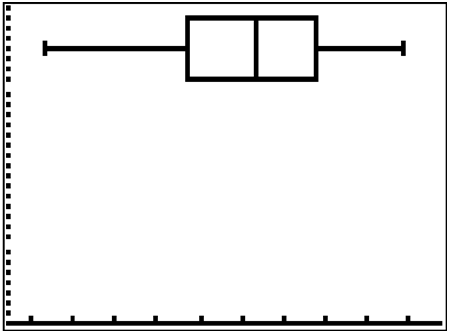
::例5Create a boxplot of the following numbers in your calculator:
::在计算器中创建以下数字的框图 :8.5, 10.9, 9.1, 7.5, 7.2, 6, 2.3, 5.5
Solution:
::解决方案 :Enter the data into by going into the Stat menu.
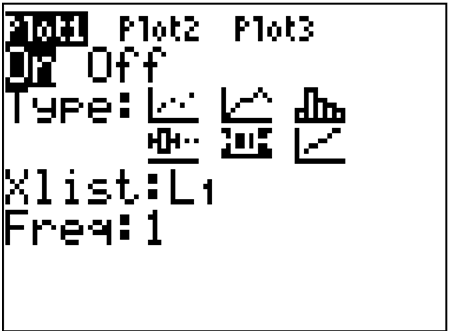
::通过输入 Stat 菜单将数据输入 L1 。Then, turn on the statplot and choose boxplot.
::然后打开标注键 然后选择框标Use Zoomstat to automatically center the window on the boxplot.
::使用 缩放 来自动将窗口居中于框块中 。Example 6
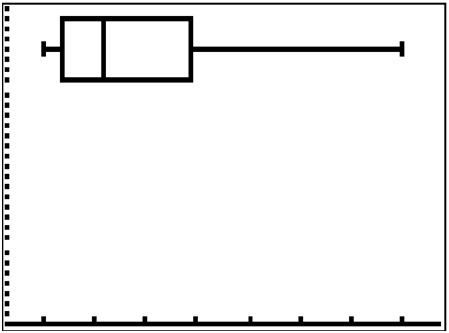
::例6Identify the interesting characteristics of the following boxplot:
::确定下列箱式图案的有趣特点:Solution :
::解决方案 :The lower bound, and all seem to be relatively close together. seems to be stretched a little to the right, and the upper bound is significantly stretched to the right.
::下限, Q1 和 Q2 似乎都相对接近。 问题3似乎向右伸展了一点,而上界则向右伸展很大。Summary
::摘要-
A
pie chart
is a graphic display of categorical data where the relative size of each pie slice corresponds to the frequency of each category.
::馅饼图表是绝对数据的图形显示,每个馅饼切片的相对大小与每一类别的频率相对应。 -
A
bar chart
is a graphic display of categorical variables that uses bars to represent the frequency of the count in each category.
::条形图是绝对变量的图形显示,用条表示每个类别的计数频率。 -
A
histogram
is a graphic display of quantitative variables that uses bars to represent the frequency of the count of the data in each interval.
::直方图是量化变量的图形显示,它使用条来表示每个间隔内数据计数的频率。 -
A
boxplot
is a graphic display of quantitative data that demonstrates the five-number summary.
::Aboxplot 是一个量化数据的图形显示,显示5个数字摘要。
Review
::回顾A math class of 30 students had the following grades:
::30名学生的数学班成绩如下:Grade Number of Students with Grade A 10 B 10 C 5 D 3 F 2 1. Create a bar chart for this data.
::1. 为此数据创建条形图。2. Create a pie chart for this data.
::2. 为这一数据创建一个饼形图表。3. Which graph do you think makes a better visual representation of the data?
::3. 你认为哪个图表更能直观地显示数据?4. A simulation of a large number of runs of rolling three dice and adding the numbers results in the following five-number summary: 3, 8, 10.5, 13, 18. Make a box-and-whisker plot for the data.
::4. 模拟大量三骰滚动运行并添加数字,得出以下五号摘要:3、8、10.5、13、18。A set of 20 exam scores is 67, 94, 88, 76, 85, 93, 55, 87, 80, 81, 80, 61, 90, 84, 75, 93, 75, 68, 100, 98
::一组20分考试分数是67、94、88、76、85、93、55、87、80、81、80、61、90、84、75、93、75、68、100、985. Create a histogram for this data. Use your best judgment to decide what the intervals should be.
::5. 为这一数据创建直方图:利用你的最佳判断来确定间隔时间。6. Find the five-number summary for this data.
::6. 找到这些数据的五号摘要。7. Use the five-number summary to create a boxplot for this data.
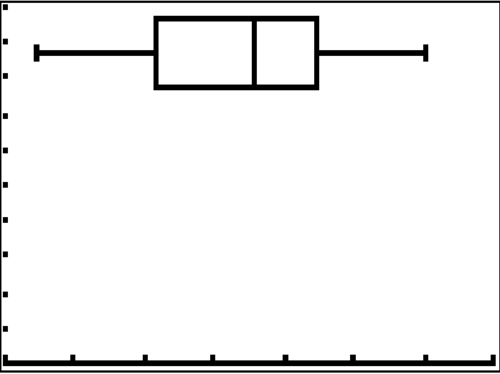
::7. 使用五个数字摘要为此数据创建框块 。8. Describe the data shown in the boxplot below.
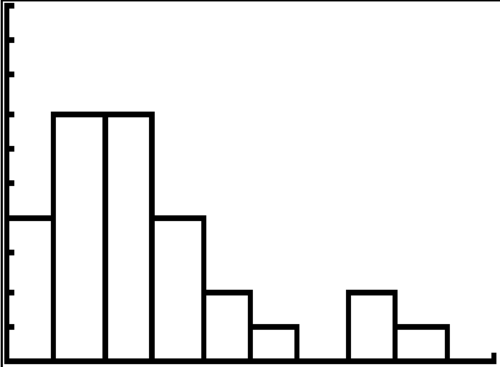
::8. 描述以下方框图中显示的数据。9. Describe the data shown in the histogram below.
::9. 描述下方直方图中显示的数据。A math class of 30 students has the following eye colors:
::30名学生的数学班有以下眼睛颜色:Eye Color Number of Students with Eye Color Brown 20 Blue 5 Green 3 Other 2 10. Create a bar chart for this data.
::10. 为此数据创建条形图。11. Create a pie chart for this data.
::11. 为这一数据创建一个饼形图表。12. Which graph do you think makes a better visual representation of the data?
::12. 你认为哪个图表更能直观地显示数据?13. Suppose you have data that show the breakdown of registered Republicans by state. What types of graphs could you use to display this data?
::13. 假设你掌握的数据显示按州分列的注册共和党的细分情况。你可以用哪些类型的图表来显示这些数据?14. From which types of graphs could you obtain information about the spread of the data? Note that spread is a measure of how spread out all of the data are.
::14. 您可从哪几类图表中获得关于数据传播的信息?请注意,数据传播是衡量所有数据如何分布的一个尺度。15. The data collected depict the number of hours 12 families traveled this summer to their vacation destination. Create a frequency table to display the data.
::15. 所收集的数据显示了今年夏天12个家庭前往度假目的地的时数,创建了一个显示数据的频率表。16. Create a histogram to display the data.
::16. 创建直方图以显示数据。17. Write a few sentences to explain any conclusions you can draw from the data.
::17. 写几句话解释你能从数据中得出的任何结论。18. Generate a question that you will use to survey 20 people. Which graphic display is the most appropriate for the data?
::18. 生成一个问题,用于调查20人,哪个图形显示最适合数据?Review (Answers )
::回顾(答复)Please see the Appendix.
::请参看附录。 -
Other – 5