域和范围
章节大纲
-
The Purpose of This Lesson
::本课程的目的In this lesson, you will explore the domain and range of various scenarios, functions, and non-functions. You'll explore different ways to represent the domain and range, as well as different kinds of restrictions on the domain.
::在此课程中, 您将探索各种情景、 函数和非功能的域和范围。 您将探索代表域和范围的不同方式, 以及不同种类的域限制 。Introduction : Practical Domain Restrictions
::导言:实际领域限制Work it Out
::工作出来Base-jumping is a sport which often involves jumping from cliffs with a wingsuit then gliding along at a shallow angle until finally pulling a parachute. Sloane jumps from 1000 meter cliff and drops 3 meters for every 8 meters of horizontal movement. When she pulls her chute, she continues to glide along this path until she lands in the flat valley at the bottom of the cliff. Sketch the scenario. Create a function for Sloane's path. Determine and interpret the - intercept for this function. What is the domain for this scenario? What is the range? Explain.
::跳伞是一项运动,通常涉及从悬崖上跳起,用一只翅膀,然后在浅角滑行,直到最后拉降落伞。斯隆从1000米悬崖上跳,每8米水平运动下降3米。当她拉起降落伞时,她继续沿着这条路滑行,直到她降落在悬崖底部的平原山谷。绘制假设情景。为斯隆的路径创建函数。确定和解释此函数的 X 接口。这个场景的域是什么?范围是什么?解释。
Activity 1: Representing Domain and Range
::活动1:代表领域和范围Example 1-1
::例1-1A large storm brings a great deal of rain to Miami, Florida. The rain is falling at a rate of 2 inches per hour. The storm stops after 6 and a half hours. Create the equation for the cumulative amount of rain that has fallen as a function of time. Graph the function. Determine the practical domain for this scenario. The practical domain is the set of -values which make sense in the given scenario.
::大风暴给佛罗里达州迈阿密带来大雨。 雨速每小时2英寸。 风暴在6个半小时后停止。 创建累积雨量的方程式, 积雨量是时间的函数。 绘制函数。 确定此情景的实用域。 实用域是特定情景中有道理的 x 值组 。Solution: The function is:
You are not measuring or including any rain before the storm started, and the amount of rain that has fallen at the instant the storm starts is 0 inches. The storm continues for 6.5 hours. At 6.5 hours, , so at 6.5 hours, 13 inches of rain has fallen. This means the domain and range, in words, are as follows:
::溶解度: 函数是: f( x) = 2x 您在风暴开始之前没有测量或包括任何降雨, 风暴开始时降雨量为0英寸。 风暴持续了6.5小时。 在6.5小时, f( 6.5)=2( 6.5)=13英寸, 所以在6.5小时, 降雨量下降了13英寸。 这意味着域域和范围, 换句话说, 如下:
::域名: 包括 0 和 6.5 小时之间的所有真实数字。 Range: 包括 0 和 13 英寸之间的所有真实数字 。There is some useful notation for domain and range that can be used to ease the expression of domain and range:
::域和范围有一些有用的符号,可用来方便域和范围的表达:
::设置标记间加注@ xR,0x6.5}[0,6.5]Range{y} yR,0y/13}[0,13]Does that look a bit like an alien language? Here is a translation:
::这看起来有点像外星语言吗?
::设置如何读取 It{x { { { { { { x, 0x6. 5} x 这样 x 是 0 和 6.5{y {y, yR, 0y13} 之间的真实数字, y是 0 和 13 之间的真实数字Here is the second column:
::这是第二列:
::读取它[0,6.5] x 的中间符号是 0 和 6.5 之间的真实数字。 [0,13] y 是 0 和 13 之间的真实数字,包括 0 和 13 。Set Notation and Interval Notation
::设置标记和间和标记The domain and range for a relation is commonly defined using set notation or interval notation. Here are some examples:
::关联的域和范围通常使用设定的符号或间距符号来定义。
::设置标记间点名称 它的意思 {x {x x xR, 3 <<x<7} (3, 7) x 是 3 - 7 和 7 y {y {y yR, 2 <y10} (2, 10) 之间的实际数字介于 0 到 10 之间, 包括 10 {x { x xR, x < 1 或 x>9} (, 1) {{{% 1,\\\\\ < {( 9, ) x 实际数字小于 1 或大于 9The ( symbol means "not including," while the [ symbol means "including."
:符号的意思是"不包括",而[符号的意思是"包括")
The symbol means "or."
::符号的意思是"或"Use ( with instances of infinity.
::使用(无穷无尽的例子)。PLIX Interactive
::PLIX 交互式互动Work it Out
::工作出来-
For each of the following scenarios, state the practical domain and range, using set or interval notation. Make a graph to support your statement.
-
A light bulb is turned on. It uses 360 kilojoules of
energy
per hour. The bulb is kept on for 3 hours.
::灯泡开着,每小时用360千焦耳,灯泡保持3小时。 -
A new family moves into a house and plants a tree. Over 5 years, the tree grows from a height of 7 feet to a height of 40 feet.
::5年来,树木从7英尺高到40英尺高长。 -
A colony of penguins declines from 100,000 to 20,000 over a 3 and a half year period.
::在3年半的时期内,企鹅群从10万减少到20,000。 -
A dragonfly flies from a height of 100 feet to a height of 5 feet. During its journey, it covers 300 feet
horizontally
.
::飞龙从100英尺的高度飞到5英尺的高度,在飞行过程中水平飞到300英尺。 -
The amount of sand forming a dune decreases from 100,000 kilograms. It decreases by half every year, forever, but it never decreases to 0 kilograms.
::形成沙丘的沙子数量从10万公斤减少,每年减少一半,永远减少,但从未减少到0公斤。
::对于以下每一种情况,请使用固定或间距标记来说明实际的域和范围。 绘制一个图表来支持您的语句。 灯泡被打开, 每小时使用360千焦耳的能量。 灯泡保持3小时。 新的家庭移动到一栋房子和一棵树上。 5年中, 树的高度从7英尺长到40英尺高。 企鹅群在3年半的时间里从10万到20,000不等。 龙蝇从100英尺高到5英尺高。 在飞行过程中, 它水平覆盖300英尺。 形成沙丘的沙子数量从10万公斤下降一半, 永远, 但它从未下降到0公斤。 -
A light bulb is turned on. It uses 360 kilojoules of
energy
per hour. The bulb is kept on for 3 hours.
-
Create a
linear function
with a
of 0, and give the domain and range.
::创建 0 的线性函数,并给出域和范围。
Interactive
::交互式互动For a linear function whose slope and -intercept is non-zero, what is the domain and range? Use the interactive below to help as needed.
::直线函数的斜度和 Y 界面为非零, 域和范围是什么? 使用下面的交互功能在需要时提供帮助。INTERACTIVEDomain and Range of Lines with Non-Zero y-interceptsIn the interactive below, move the red point along the slider to change the slope, @$m.@$ Move the blue point to change the @$y-@$ intercept, @$b.@$ Try zooming out horizontally by pressing the xZoom button. Try zooming out vertically by pressing the yZoom button. The domain of the function is all of the @$x@$ values along the line. The range of the function is all of the @$y@$ values along the line.
::在以下互动的按钮中,沿着滑块移动红色点以改变斜度, @ $. @ $. $ 移动蓝色点以改变@ $- @ $intercept, @ $b. @ $ try 尝试按 xZom 按钮水平缩放。 尝试按下 yZom 按钮垂直缩放。 函数的域是沿线所有@ $x@ $ 值。 函数的范围是沿线的所有@ $@ y@ $ 值 。+Do you want to reset the PLIX?Domain and Range for With a Non- zero Slope
::带有非零斜坡的域域和范围
Activity 2: Theoretical Domain Restrictions
::活动2:理论领域限制Previously , you explored linear functions that were not based on a scenario. This means there was no practical restriction on the domain. The domain and range described above are theoretical . This means the scenario doesn't impose any restrictions on the domain, and if any values are excluded from the domain or range, it's because of the nature of the relation itself. W hen you created a function whose range is limited to one value, this is the result of the function you created, not because of some limit imposed by a scenario being modeled.
::之前, 您探索的线性函数不是基于假设情景。 这意味着对域没有实际的限制。 上面描述的域和范围是理论性的。 这意味着假设情景不会对域施加任何限制, 如果任何数值被排除在域或范围之外, 则是由于关系本身的性质。 当您创建了一个函数时, 该函数的范围仅限于一个值, 这是您创建的函数的结果, 而不是由于模型化的设想设定了一定的限制 。Practical vs. Theoretical Domain Restrictions
::实际与理论领域限制A practical domain restriction is imposed by the scenario being modeled.
::正在模拟的假设情景规定了实际的域限。A theoretical domain restriction is inherent to the relation itself and is usually determined from the equation or graph of the relation.
::理论领域限制是关系本身所固有的,通常根据关系方程式或图表确定。Interactive
::交互式互动Use the interactive below to create the graph of a relation to the indicated specifications. Sketch the result on paper if desired. Determine if there are or are not multiple ways to create a relation with this interactive meeting the given domain and range constraints. State whether the relation is a function or not.
::使用下面的交互关系来创建与指定规格有关的图表。 如果需要, 将结果涂在纸面上。 确定是否有多种方法来建立与该互动关系, 以满足给定的域和范围限制。 请说明该关系是否是一个函数 。-
::域:[-3,4] 区域:[2,5] -
::域:[0,2]Range:[-2,0] -
::域:{1} 区域: [3,4] -
::域 : @% 2} 区域 :{6}
INTERACTIVERestricting Domain and Range of Relations-
Drag the red and blue points until the relation has the given domain and range.
::拖曳红色和蓝色点,直到关系有给定的域和范围。
+Do you want to reset the PLIX?
::工作出来-
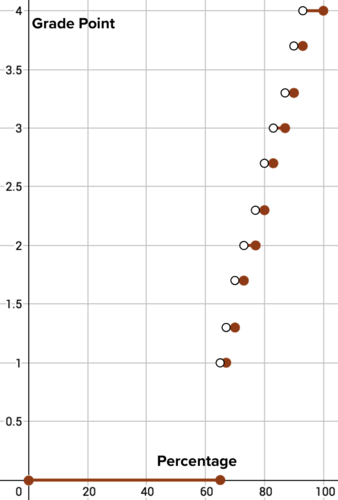
When calculating a grade point, the percentage earned in a class is converted to a value on a four-point scale. The graph shows the relationship between the percentage and the grade point. This function is called a
step function
. Why? What is the grade point for a grade of 85%? What is the domain and range for this graph?
::当计算一个职等点时,一个类中挣得的百分比被转换成四点比例的数值。图表显示了百分比和职等点之间的关系。这个函数被称为一个职级函数。为什么?85%等级的职等点是多少?这个图表的域和范围是什么?
A step function correlating GPA to percentage -
The top
speed
of a traditional sailboat is related to the length of the boat. As the boat pushes through the water, it makes
waves. As the boat goes faster, the waves get further apart, until there is one wave at the front, and one in the back, with the boat stuck in the trough in the middle. At that moment, the boat can't go faster. So one strategy for making a faster boat is to make a longer boat. The top speed
as a function of
boat length is given by the equation:
The length is in feet, and the velocity is in miles per hour. Make a table and complete a graph of this function. Give the theoretical domain and range. Explain.
::传统帆船的最高速度与船的长度有关。 当船穿过水面时, 它会使波浪。 当船走得更快时, 海浪会进一步分解, 直到前面有一个波, 后面有一个波, 船在中间的槽里。 此时, 船不能开得更快。 因此, 造船速度更快的策略就是造船更长的船。 乘船长度的顶速度是乘以方程的函数: v=1.54l 。 长度是脚的, 速度是每小时的英里。 绘制一张桌子, 完成此函数的图表。 给出理论领域和范围。 解释 。 -
(
e
xtension) A colony of cormorants lives on an island. They number 300 in year 0. Their numbers double every year. Write a function that models the number of cormorants after x years. Graph the function. Give the theoretical domain and range for this function. Discuss the differences between theoretical and practical domain in this scenario.
::一个聚居的焦温剂聚居地生活在一个岛上。它们的数量在0年中为300。它们的数量每年翻一番。写一个函数,在 x 年之后模拟焦温剂的数量。绘制函数图。给出该函数的理论领域和范围。讨论这个假设中理论领域和实际领域之间的差异。
Interactive
::交互式互动The density of an object is its mass divided by its volume . The density of air in Denver is about 1 kilogram per cubic meter. Remember that a kilogram is about 2.2 pounds, and a cubic meter is about the volume of washer and drier combined. Imagine holding the mass constant , and changing the volume of space containing the 1 kilogram of air. The density changes accordingly.
::对象的密度是其质量除以其体积。 丹佛的空气密度约为每立方米1公斤。 记住, 一公斤大约为2.2磅, 一立方米大约为洗衣机和干燥机的总量。 想象一下保持质量常数, 并改变含有1公斤空气的空间体积。 密度会相应变化 。-
Density as a function of volume in this case is given by the equation:
If the air is compressed into a space of 0.1 cubic meters, what is the density?
::D=mVIf 空气压缩成0.1立方米的空间,密度是多少? -
If the air expands to fill a
balloon whose volume is 1000 cubic meters, what is the density?
::如果空气膨胀以填充气球 气球的体积是1000立方米, 密度是多少? -
Use the interactive below to find
the
practical domain and the corresponding range. Explain.
::使用下面的交互效果查找实际域和相应的范围。请解释。 -
(extension) What would happen if the interactive could generate a negative value for m? On what part of the graph (currently not shown) would the output appear? Why does the interactive (designed to model density) not include that area? Explain.
::如果互动能为 m 生成负值, 将会发生什么情况? 图形的哪个部分( 目前没有显示) 产出会出现? 为什么互动( 设计用来模拟密度的) 不包括这个区域? 解释一下 。
INTERACTIVESimple Rational FunctionIn the interactive below, move the red point to change the value of the constant, The horizontal axis represents volume and the vertical axis represents density Observe how the graph changes as the value of varies.
::在下文互动部分中,移动红点以改变常值 m。水平轴代表体积(V),垂直轴代表密度(D)。观察图中值变化情况如何,以 m 值变化。+Do you want to reset the PLIX?
Activity 3: Domain and Range of Non-Functions
::活动3:非职能领域和范围Interactive
::交互式互动The following interactive provides a graph of a relation. Modify the graph of the given relation so it has the specified domain and range. Determine if the result is a function or not and explain your decision.
::以下交互性提供一个关系图。修改给定关系图,使其具有指定的域和范围。确定结果是否是一个函数,并解释您的决定。-
Domain: [-2, 5] and Range: [1, 4]
::域:[-2、5]和范围:[1、4] -
Domain: [0, 6] and Range: [-3, 2]
::域:[0,6]和范围:[3,2] -
Domain: 4 and Range:
::域 域: 4 和范围
INTERACTIVERestricting Domain and Range of Non-Functions-
Move the red and blue points to change the dimensions of the circle.
::移动红点和蓝色点以改变圆的尺寸。
+Do you want to reset the PLIX?In the lesson on Graphs of Functions and Non- F unctions , you saw that all points on the graph of a circle with radius satisfy the equation
::在关于函数和非函数的图形的课中,您看到圆形图中带有半径 r 圆形的所有点都符合公式 x2+y2=r2。Example 3-1
::例3-1Find four points that satisfy the equation Sketch the graph of the circle. Substitute 5 for x to determine 2 more points on the circle. Substitute −5 for x to determine 2 more points on the circle. Give your results for y in simplified form, as well as decimals rounded to the tenths place. Graph them.
::查找符合方程式 x2+y2=102. 的四点。 绘制圆形图。 替代 5 的 x 5 来确定圆上另外两个点。 替代 5 的 x 来确定圆上另外两个点。 以简化格式给出y 的结果, 以及四舍五入到十分位数的十进制小数。 绘制它们 。Solution: The equation is the Pythagorean Theorem applied to a triangle in the coordinate plane . The hypotenuse is 10, and the legs are given by and the coordinates of, for example, point as shown below. Because the hypotenuse is 10, you can recognize this as part of the Pythagorean Triple, This means the four points shown satisfy the equation, and they are on the graph of this equation. This is confirmed by substituting the values for and and determining if the equation holds true for those values. The point is also checked to show that there are many points that do not make the equation true. These points are not part of the graph of the relation.
::解析度 : x2+y2=102 方程式是适用于坐标平面三角形的 Pythagorean 理论。 下限为 10 , 双腿由 x 和 y 给出, 例如下面显示的点 A 的坐标为 X 和 Y 。 由于下限为 10 , 您可以将此识别为 Pytagoren Triple 的一部分, 6, 8, 10 。 这意味着所显示的四个点满足方程, 并且它们位于此方程的图中 。 这通过替换 x 和 y 的值来证实 , 并且确定 等式是否符合这些值 。 点 ( 3, 4) 也会被检查, 以显示有很多点不能使方程真实的点 。 这些点不在关系图中 。
::以等义或假( 6, 8) 62+82 = 102rue( 6, 8( 6) - 6) 2+82= 102True( 6, 8( 6) - 8) 2+( 6) 2= 102True( 6, 8) 2= 102True( 6, 8) 62+( 8) 2= 102True( 4) 32+42=102FalseTo determine more points that satisfy the equation, substitute a value for that you think has a chance of producing a corresponding -value in the equation. Based on the sketch of the graph, should produce 2 -values. Substitute and solve:
::要确定更多符合等式的点, 请用一个数值替换 x, 您认为 x 有可能在等式中产生相应的 Y 值。 根据图形的草图, x=5 应该产生 2 Y 值 。 替代和解析 :
::公式Explation 52+y2=102 x.y2=75隔离 y2.y=75Square根根基为x.y2=5的替代值。The points and are also on the graph. As approximations, these points are (5, 8.7) and (-5, 8.7). A similar process gives points for
::这些点(5,53点和5,-53点)也在图中,近似值为5,8.7点和5,8.7点,类似进程为x5点。The graph of a circle, with four points identified using the Pythagorean Theorem Work it Out
::工作出来Write the equation for a circle with radius 13. Use your knowledge of to determine 4 points on the circle. Sketch the graph.
::写出圆形半径13的方程。 使用您对圆形的认知来确定圆形上的 4 点。 绘制图形 。-
S
elect an
-value likely to return two
-values when substituted in the equation. Graph the resulting points. Based on these points, find two additional points that satisfy the equation.
::选择在公式中替换时可能返回两个 Y 值的 x 值。 绘制结果点。 基于这些点, 找到两个满足公式的附加点 。 -
Select a
-value likely to return exactly one
-value when substituted in the equation. Find and graph the resulting point. Use this point to determine another point that satisfies the equation. Explain your choices.
::选择一个 Y 值, 在公式中替换时, 可能返回精确的一 x 值。 查找并绘制结果点的图形。 使用此点来确定另一个满足公式的点。 解释您的选择 。 -
Select two points that show that this relation is not a function. Explain.
::选择两个点显示此关系不是一个函数。 解释 。
Summary
::摘要-
Set notation and interval notation are methods we can use to express domain and range.
::设置和间隔标记是我们用来表达域和范围的方法。 -
The domain of relations can be subject to practical restrictions based on the given scenario being modeled.
::关系领域可受到基于所模拟的特定假设情况的实际限制。 -
The domain and range of relations, regardless of the scenario being modeled, are subject to theoretical limits determined by the type of relation and the parameters of the relation.
::不论所模拟的设想情况如何,关系领域和范围都受由关系类型和关系参数确定的理论限制。
PLIX Interactive
::PLIX 交互式互动 -
For each of the following scenarios, state the practical domain and range, using set or interval notation. Make a graph to support your statement.