函数的水平伸缩
章节大纲
-
The Purpose of this Lesson
::本课程的目的In this lesson, you will explore horizontal stretches of functions. You'll apply all types of transformations to a variety of functions .
::在此课程中, 您将探索函数的横向范围 。 您将会对各种函数应用各种类型的转换 。
Activity 1 : Transformations
::活动1:转变Work it Out
::工作出来Each of the functions below is a transformation of a discernible parent function . For example, y = 5 ( x − 6 ) 2 − 12 is a transformation of the parent function y = x 2 . Identify the parent function in each of the following, and explain the impact of the transformation on the graph of the function. Give the domain and range . Use graphing technology or a sketch to support your conclusions if necessary.
::下面的每个函数都是一个可见父函数的转换。 例如, y=5( x-6)2- 12 是母函数 y=x2 的转换 y=x2 。 确定以下每个函数的父函数, 并解释该转换对函数图形的影响 。 给出域和范围 。 必要时, 使用图形技术或草图支持您的结论 。a. f ( x ) = | x − 4 | + 21 b. g ( x ) = 3 √ x + 3 − 15 c. h ( x ) = 1 x − 2 + 1 d. y = − 4 ( x + 5 ) 2 + 10 e. y = ( x − 1 ) 3 f. y = 3 ( 2 ) x − 4 + 100
:x)=1x-2+1d.y=4(x+5)2+10e.y=(x-1)3f.y=3(2)x-4+100
Progress0 / 31.Match each transformed function to their parent function.
@$\begin{align*}\frac{4}{x-2}+7\end{align*}@$
@$\begin{align*}4(2)^{x-2}+7\end{align*}@$
@$\begin{align*}4(x-2)^2+7\end{align*}@$
@$\begin{align*}4\sqrt{x-2}+7\end{align*}@$
::将每个已转换的函数匹配到父函数 。 @ $\ begin{ ligin}\ legni{ frac{ 4\\\\\\\\\\\\\\\\\\\\\\\\\\\\\\\\\\\\\\\\\\\\\\\\\\\\\\\\\\\\\\\\\\\\\\\\\\\\\\\\\\\\\\\\\\\\\\\\\\\\\\\\\\\\\\\\\\\\\\\\\\\\\\\\\\\\\\\\\\\\\\\\\\\\\\\\\\\\\\\\\\\\\\\\\\\\\\\\\\\\\\\\\\\\\\\\\\\\\\\\\\\\\\\\\\\\\\\\\\\\\\\\\\\\\\\\\\\\\\\\\\\\\\\\\\\\\\\\\\\\\\\\\\\\\\\\\\\\\\\\\\\\\\\\\\\\\\\\\\\\\\\\\\\\\\\\\\\\\\\\\\\\\\\\\\\\\\\\\\\\\\\\\\\\\\\\\\\\\\\\\\\\\\\\\\\\\\\\\\\\\\\\\\\\\\\\\\\\\\\\\\\\\\\\\\\\\\\\\\\\\\\\\\\\\\\\\\\\\\\\\\\\\\\\\\\\\\\\\\\\\\\\\\\\\\\\x-squared2 to the power of xsquare root of x1/xPLIX Interactive
::PLIX 交互式互动
Activity 2 : Horizontal Stretches
::活动2:横向拉伸Example 2-1
::例2-1Given f ( x ) = x 2 , consider the transformations g ( x ) = ( 3 x ) 2 and h ( x ) = ( 1 5 x ) 2 . Graph. What's the vertex for each? What x -values return a y -value of 16 for each function? How is the graph transformed horizontally ? Explain your conclusions. Generalize to y = ( a x ) 2 .
::给定 f( x) =x2 , 考虑变换 g( x) = (3x) 2 和 h( x) = (15x) 2. 图表。 每一函数的顶点是什么? 每个函数的Y值是多少? 每个函数的Y值是多少? 图表是如何水平转换的? 解释你的结论。 概括到 y= (ax) 2 。Solution:
::解决方案 :What x-values return a y-value of 16 for each function? How is the original graph in green transformed to be the blue and red curves? 16 = x 2 x = ± 4 16 = ( 3 x ) 2 3 x = ± 4 x = ± 4 3 16 = ( 1 5 x ) 2 1 5 x = ± 4 x = ± 20 The vertex for each is (0,0). The values that return a y -value of 16 change via these transformations.
::每种值的顶点是 0,0 。 通过这些转换返回 16 个变化的 Y 值的值 。4 returns 16 in y = x 2 .
::4 返回 y=x2 中的 16。4 3 returns 16 in y = ( 3 x ) 2 .
::43 返回 16 英寸 Y= (3x) 2。
::y=( 15x) 2 中 20 返回 16。If b returns c in y = x 2 , b a returns c in y = ( a x ) 2 .
::如果 b 返回 y=x2 中的 c, ba 返回 y= (ax) 2 中的 c。This is visible in the graph as a horizontal stretch by a factor of 1 a .
::这在图表中以水平伸展度显示为 1a 系数。Horizontal Stretches of Functions
::函数的水平伸缩Given y = f ( x ) , y = f ( a x ) represents a horizontal stretch by a factor of 1 a .
::give y=f( x), y=f( x) 表示水平伸展乘以 1a 。If the point ( b , c ) is on the graph of f ( x ) , the point ( b a , c ) is on the graph of f ( a x ) .
::如果(b,c)点位于 f(x) 的图形上,(ba,c)点位于 f(ax) 的图形上。Work it Out
::工作出来-
Given
f
(
x
)
=
x
2
, consider the transformations
g
(
x
)
=
(
2
x
)
2
and
h
(
x
)
=
(
1
4
x
)
2
. Graph. What's the vertex for each? What
x
−
values return a
y
−
value of 25 for each function? How is the graph transformed horizontally? Explain your conclusions.
::给定 f( x) =x2 , 考虑变换 g( x) = ( 2x) 2 和 h( x) = ( 14x) 2 。 图 。 每一个的顶点是什么? 什么 x - 值返回每个函数的 y - 值为 25 ? 图形如何水平转换? 请解释您的结论 。 -
Given the graph of
y
=
f
(
x
)
below, graph
y
=
f
(
3
x
)
and
y
=
f
(
1
3
x
)
.
Explain the method you used.
::根据下面的 y=f(x) 图形, 图 y=f(3x) 和 y=f(13x) 。 请解释您使用的方法 。
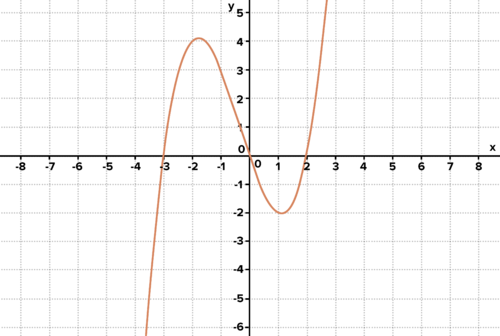
The graph of y = f(x) -
The graph of
f
(
x
)
is in blue below. Describe the transformations that lead to the other two graphs. Use
.
::f( x) 的图形在下面的蓝色。 描述导致其他两个图形的变换。 使用 。
The graph of y=f(x) is in blue. What transformations lead to the other two curves?
Activity 3: Use Transformations to Model Scenarios
::活动3:利用向模式假想的转变Interactive
::交互式互动Use the interactive below to experiment with different degrees of horizontal stretch for different functions. Identify each function type. How do horizontal stretches affect each function type? Discuss vertices , x - intercepts , y -intercepts, domain, range, shape, , and other features of the graph. Explain the impact of a negative value for a on each function type.
::使用下面的交互作用来实验不同函数的不同水平范围。 确定每个函数类型。 水平范围如何影响每个函数类型? 讨论图形的顶点、 x 截面、 y 截面、 域、 范围、 形状、 和其他特征。 解释一个函数类型负值对每个函数类型的影响 。Work it Out
::工作出来-
A rock is dropped from a cliff at a height of 1.2 kilometers. Neglecting air resistance, it accelerates towards the ground at 10 meters per second. A second rock is dropped from lower on the cliff, at 0.8 kilometers, 4 seconds after the first is dropped. Create models for the height of each as a function of time. Graph. Determine when they
each
reach the half-kilometer mark. From the graph, is there a time when they have the same height? Write, but do not solve, an
equation
to determine this time. Use graphing or solving technology to determine this time, then find the height of each rock at this time. From the graph, use nearby points on each graph to create slope triangles and approximate the
speed
of each object when one passes the other.
::岩石从悬崖上坠落, 高度为1.2公里。 忽略空气阻力, 加速到地面, 以每秒10米的速度。 第二块岩石从悬崖下方, 跌倒时间为0. 8公里, 跌倒时间为4秒。 创建每个高度的模型作为时间函数 。 图形 。 确定每个高度达到半公里标记的时间。 从图形中, 是否有一个时间它们有相同的高度 。 写一个公式, 但没有解析, 来决定这个时间 。 使用图形化或解析技术来决定这个时间, 然后找到每个岩石的高度 。 从图表中, 使用每个图形的附近点来创建斜度三角形, 并在每个对象经过另一个时接近每个对象的速度 。 -
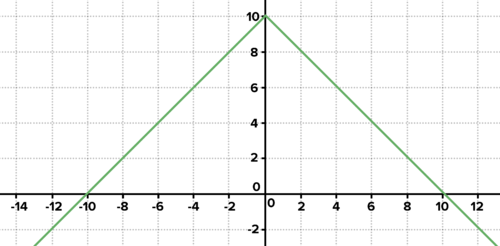
The roof of a tornado shelter is modeled with the function shown. Find the equation for the function. Engineers have determined that the shelter would be more resilient if each point on the roof was twice as far from the line of
. Find the equation for the new function. Graph.
::龙卷风掩蔽的屋顶以所显示的函数为模型。 查找函数的方程式。 工程师们已经确定, 如果顶部的每个点距离龙卷风掩蔽线的两倍, 掩蔽掩蔽将更具复原力。 查找新函数的方程式。 图形 。
The roof of a tornado shelter. -
Two scientists, Robbie and Jasmine, are intent upon counting the number of
butterflies that have migrated into
in a grove of trees, but they are unable to begin their study until day 3.
On day 3, they observe
56
butterflies
. Their numbers double every day thereafter. Robbie creates a model for the scenario, featuring the expression
x
−
3.
Jasmine also creates a model, featuring just
x
.
Their models are equivalent! Find their models.
::两位科学家Robbie和Jasmine打算计算在树林中迁徙的蝴蝶数量,但他们直到第3天才能开始研究,但到第3天,他们无法开始研究。在第3天,他们观察了56只蝴蝶。此后,他们每天的计数翻一番。Robbie为这个假想创造了一个模型,以X-3的表达方式为主。茉莉还创造了一个模型,仅以xx为主。他们的模型是等效的!找到他们的模型。 -
(extension) Two scientists are modeling the
continuous
growth of
two
algal blooms in the Gulf of Mexico. Recall that the
formula
for continuous growth is
A
=
P
e
r
t
.
Each bloom has an initial area of 10 square kilometers. One grows at a
rate
of 15% per year for 3 years, then stops. The other grows at a rate of 7.5%. How many years must the second bloom grow to achieve the same area as the first? Explain. Graph the size of each as a function of time. Explain how the graph of the second represents a horizontal stretch of the first.
::两位科学家正在模拟墨西哥湾两颗藻华的持续增长。 回顾持续增长的公式是 A = Pert。 每颗藻华的最初面积为 10 平方公里。 一个以每年15%的速度增长, 3 年, 然后停止。 另一个以7.5%的速度增长。 第二颗藻的生长需要多少年才能达到与第一个相同的面积? 解释 。 按时间函数来绘制每个藻华的大小 。 解释第二个图如何代表第一个图的横向宽度 。 -
$1,100 is invested at 4% interest, compounded monthly. How much has accumulated in the account after 10 years? Use graphing technology to determine when the principal is doubled. Modify the function so that this doubling takes half as long. Confirm that the amount accumulated in the first account at 10 years is accumulated in 5 years in the second account. Sketch the graphs showing this.
::1 100美元投资为4%的利息, 每月复数。 10年后账户中累积了多少? 使用图形化技术来确定本金何时翻一番。 修改此函数, 使翻一番的时间延长一半 。 确认第一个账户中10年的累计金额在5年内累积到第二个账户中。 涂抹显示这一点的图表 。 -
Graph a polygon in the
coordinate plane
. Double the
x
-values and graph the image. Start with the original polygon again. Subtract 5 from each
x
-value and graph the image. Explain the results. Graph
f
(
x
)
=
x
2
,
g
(
x
)
=
(
2
x
)
2
,
and
h
(
x
)
=
(
x
−
5
)
2
.
Explain the transformations you graphed. How are these transformations different from those you performed with the polygon? Explain the differences. If
(
p
,
q
)
is on the graph of
f
(
x
)
,
is
(
p
−
5
,
q
)
on the graph of
f
(
x
−
5
)
?
Why or why not? If
(
p
,
q
)
is on the graph of
f
(
x
)
,
what point is on the graph of
f
(
x
−
5
)
?
Explain.
::坐标平面中的图形。 加倍 x 值和图解图像。 以原始多边形开始 。 从每个 x 值开始, 从每个 x 值中减号 5 并图形图像 。 解释结果 。 图f (x) =x2, g (x) = (2x) 2, 和 h (x) = (x- 5) 2 。 解释您绘制的图形变形。 这些变形与您使用多边形变形的变形有何不同? 解释差异。 如果 f (x) 的图形是 f (p) , f (p) 5, f (x) 5 的图形是 (p) , 为何不是? 如果 f (x) 的图形是 f (x) , f (x) 5 的图形是哪个点? 解释 。
Summary
::摘要-
Given
y
=
f
(
x
)
,
y
=
f
(
a
x
)
represents a horizontal stretch by a factor of
1
a
.
::give y=f( x), y=f( x) 表示水平伸展乘以 1a 。
-
Given
f
(
x
)
=
x
2
, consider the transformations
g
(
x
)
=
(
2
x
)
2
and
h
(
x
)
=
(
1
4
x
)
2
. Graph. What's the vertex for each? What
x
−
values return a
y
−
value of 25 for each function? How is the graph transformed horizontally? Explain your conclusions.