线线性规划
章节大纲
-
::本课程的目的
::在此教训中,您将用线性不平等体系来模拟情景,并在解决方案中找到价值,以解决最大化或最小化问题。
::活动1:线性不平等绘图系统Diana runs a pizza and calzone stand -
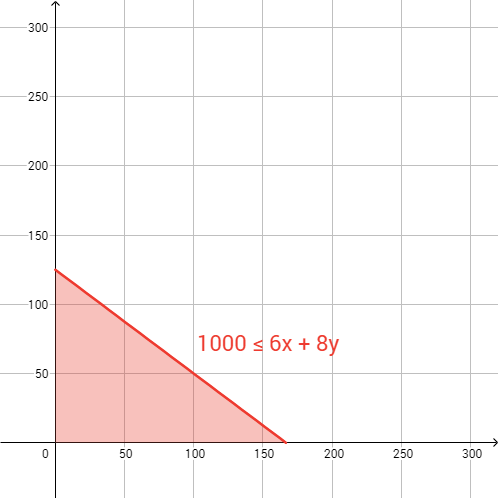
Diana runs a pizza and calzone stand. Her food is famous for its Italian mozzarella cheese. Each pizza needs 6 ounces of
mozzarella
, and each calzone needs 8 ounces, and Diana gets 1000 ounces of
mozzarella
per week. Create a graph that shows the relationship between the number of pizzas and calzones she can possibly make. Extend your
-axis to 300, and your
-axis to 300. Restrict your graph to
and
::戴安娜经营一个比萨饼摊。 她的食品以意大利奶油奶酪闻名。 每个比萨饼需要6盎司的马扎拉, 每个卡罗拉需要8盎司, 戴安娜每周得到1000盎司的马扎拉。 创建一张图表, 显示比萨饼数量和她可能做的卡通。 将您的x轴向300, Y轴向300。 将您的图表限制在 x+0 和 y+0 之间 。
-
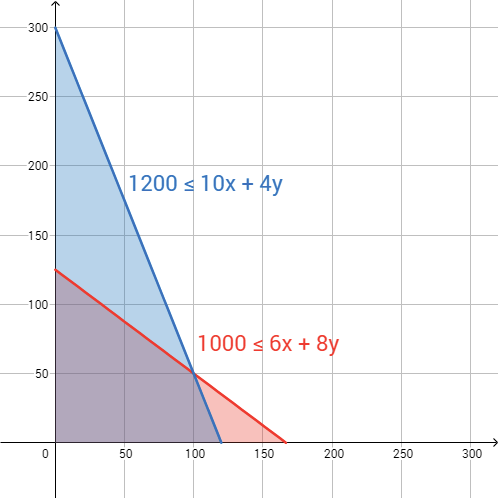
Diana's pizzas also have a tomato sauce made from ripe tomatoes and spiced with California oregano. Each pizza needs 10 ounces of tomato sauce, and each calzone 4 ounces, and
Diana
gets 1200 ounces of sauce per week. Create and graph this
inequality
on the axes you made previously. Find the
intersection
point of linear component of this and the previous inequality. Is this intersection point part of the solution set for this system of inequalities? Why or why not? In this scenario, although
the
model allows for fractional pizzas and calzones, the actual number of pizzas and calzones are restricted to
integers
.
::戴安娜的比萨饼还有一种番茄酱,由成熟的西红柿制成,与加州的牛油瓜混合。每份披萨需要10盎司的番茄酱,每份4盎司,戴安娜每周得到1200盎司的酱汁。在您以前做的斧头上创建和图解这种不平等。找出这一不平等和先前不平等的线性成分的交叉点。找到这个不平等体系所设定的解决方案的交叉点吗?为什么或为什么没有?在这种情况下,尽管模型允许批量的披萨和圆区,但实际的披萨和圆区数量仅限于整数。
-
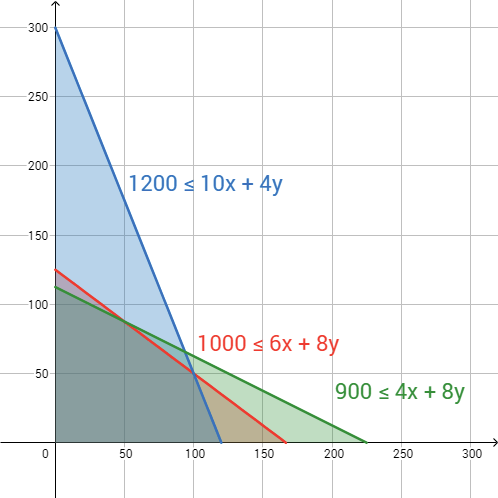
Diana's pizzas are made from dough infused with Spanish olive oil and rosemary grown in Mexico. Each pizza needs 4 ounces of dough and each calzone 8 ounces, and
Diana
gets 900 ounces per week. Create and graph the resulting inequality on the axes you made previously. Find the intersection point of the linear component of this
inequality
with the linear component of the first
inequality
you graphed. Is the intersection point part of the solution set for this system of inequalities? Why or why not? Are there intersection points between lines on the graph that are not part of the solution set for this system of inequalities? Explain.
::戴安娜的披萨是用在墨西哥产的西班牙橄榄油和迷迭香加成的面粉做的。 每份披萨需要4盎司的橄榄油和墨西哥产的迷迭香。 每份披萨需要4盎司的果和8盎司的每圆8盎司, 戴安娜每星期得到900盎司的披萨。 创建和绘制您先前制造的轴上由此产生的不平等。 找出这一不平等线性部分与您绘制的第一个不平等线性部分的交叉点。 解决方案的交叉点是否为这种不平等体系设定了? 为什么或为什么没有? 图表上的线条之间是否有交叉点, 而不是为这种不平等体系设定的解决方案的一部分? 解释 。
-
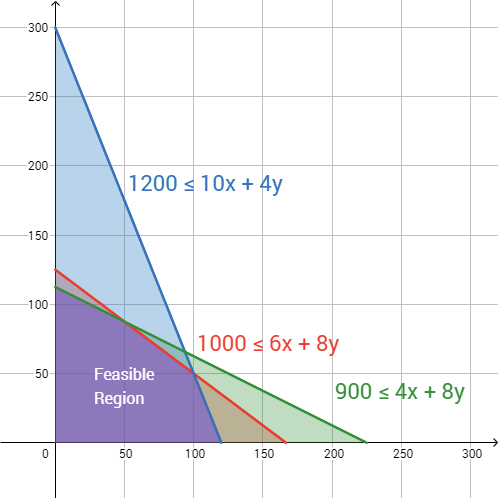
The system you created in the past 3 problems involves 5 inequalities. List them. Carefully shade the region that includes all the points that are part of the solution set of this system. Describe the shape of the shaded region. Find the
vertices
of the shaded region. The shaded region is called the
feasible region
for our scenario. Feasible means possible. The feasible region represents all the possible combinations of pizzas and calzones that Diana can make in a week, given the constraints on cheese, sauce, and dough. Give the
coordinates
of 3 additional points in the shaded region.
::您在过去三个问题中创建的系统涉及 5 个不平等 。 请列出它们 。 仔细遮盖包含这个系统解决方案集中所有要点的区域 。 描述阴影区域的形状 。 查找阴影区域的顶端 。 阴影区域被称为我们设想的可行区域 。 可行的手段是可能的。 可行的区域代表戴安娜一周内可以做的所有比萨饼和圆点的组合, 由于对奶酪、 酱汁和甜甜甜圈的限制 。 给阴影区域的另外三个点提供坐标 。
Graphing Systems of Linear Inequalities
::线性不平等绘图系统The feasible region of a graph of a system of linear equalities is the solution set.
Activity 2: Linear Programming
::活动2:线性方案拟订Diana can only make combinations of pizzas and calzones that are drawn from the feasible region. But she needs to earn revenue , so not every point in the feasible region is equally viable from her perspective. The point (1,2) is in the feasible region, but she's not going to have a successful business if she just makes 1 pizza and 2 calzones. How can Diana find the combination of points that maximizes her profit ? First, she needs to know how much profit she makes for a pizza and for a calzone. She makes $10 per pizza, and $6 per calzone. The equation for her profit is:
::Diana只能从可行的地区获取比萨和内核。 但她需要赚取收入, 因此从她的观点看, 并非可行地区的每个点都同样可行。 点(1, 2)是在可行的地区, 但是如果她只做一个比萨和两个内核, 她就不会有成功的生意。 Diana如何找到能使利润最大化的点数组合? 首先, 她需要知道她为披萨和内核赚了多少利润。 她为每个比萨和每个内核赚了10美元, 每个内核赚了6美元。 她利润的方程式是:
::p=10x+6yThis is different from the equations you've encountered so far . There is a third variable , for profit, that is a function of two other variables, and , the number of pizzas and calzones sold. You can use this equation to find the profit for different combinations of pizza and calzones drawn from the feasible region.
::这与您目前遇到的方程式不同。 第三个变量, p 用于盈利, 由另外两个变量, x 和 y, 即出售的比萨和内核数量组成。 您可以使用这个方程式来寻找从可行地区提取的 不同组合的比萨和内核的利润 。Example 2-1
::例2-1The equation for profit above is called an optimization equation , because you seek to find the optimum, that is, the maximum, value that this equation returns. Select 3 different points with integer values from the feasible region that you think might maximize the profit. Substitute them for and in the optimization equation, and compute the resulting profit for each. Which returns the greatest profit? Do you think you can find a combination of pizzas and calzones in the feasible region that returns an even higher profit? Why or why not? Does the optimization equation mean that Diana will earn the amount of money returned by the equation? Why or why not?
::上面的利润方程式叫做优化方程式, 因为您想要找到最佳的, 也就是最大, 也就是这个方程式返回的值。 从您认为可能最大限度地获得利润的可行区域选择三个点, 并选择三个点, 加上整数值。 在优化方程式中将其替换为 x 和 y , 并计算每个方程式的利润。 哪种是最大的利润? 您是否认为您可以在可行的区域中找到一个比萨和圆点的组合, 其回报的利润更高? 为什么或不? 优化方程式是否意味着Diana会从公式中获取回报的金额? 为什么或为什么没有?Solution:
::解决方案 :
::304054404070708208080980千兆赫The maximum can be found not only by guessing and checking (consider what locations in the shaded area are most likely to be significant: intersections, vertices, etc.), but also by the method described in the subsequent examples. This doesn't mean that Diana will actually make that much, since sales depend on customers buying. It just means that this is the best she can do.
::最高值不仅可以通过猜测和检查(考虑到暗色区域中哪些地点最有可能是显著的:交叉点、顶点等 ) , 还可以通过随后的例子中描述的方法找到。 这并不意味着Diana实际上能赚到这么多,因为销售取决于客户购买。 这只是说这是她所能做的最好的事情。Linear Programming
::线线性规划Linear programming is the process of graphing a feasible region and finding the maximum or minimum value returned by an optimization equation.Example 2-2
::例2-2You already have a graphical representation for the feasible region. It's also possible to represent the optimization equation graphically. Here is the equation for profit again:
::您已经拥有了可行区域的图形化表达式。 也可以用图形化的方式代表优化方程式。 下面是利润方程式 :
::p=10x+6yInstead of selecting points from the feasible region, you can select a plausible profit. Let Then the equation becomes:
::而不是从可行的区域选择点数, 您可以选择一种合理的利润 。 p= 500 。 然后方程变成 :
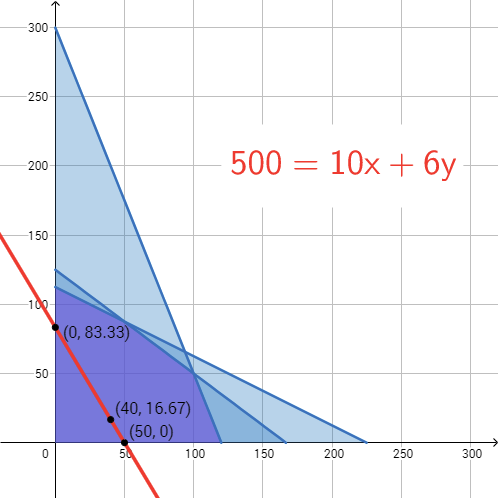
::500=10x+6yGraph this line, interpret it in the context of the scenario, and find some combinations of pizzas and calzones that return a profit of $500.
::绘制这条直线,根据情景来解释, 并找到一些比萨和内核的组合, 利润为500美元。Solution: This line expresses all the possible combinations of pizzas and calzones that return a profit of $500. Of course, not all those combinations, in particular those with negative values, are in the feasible region. You are only interested in its intersection with the feasible region. So, graph it on the same axes as the feasible region. That way, you can see which combinations return a profit of $500 and are feasible. One option for graphing the profit line is to find or to determine additional points on the line:
::解决方案 : 此直线表示所有可能的比萨饼和内核组合, 其利润为500美元。 当然, 并非所有这些组合, 特别是负值的组合, 都在可行区域。 您只对它与可行区域的交叉点感兴趣 。 因此, 请用与可行区域相同的轴图显示它。 这样, 您可以看到哪一种组合的利润为500美元, 并且是可行的。 绘制利润线图的一个选项是找到x或y, 以确定线上的其他点 :
::xy08313500401623Any point on the profit line below and in the feasible region earns Diana $500.
::利润线下的任何点数,在可行地区,都可赚取Diana 500美元。Any point on the profit line that is in the feasible region will earn Diana $500 Example 2-3
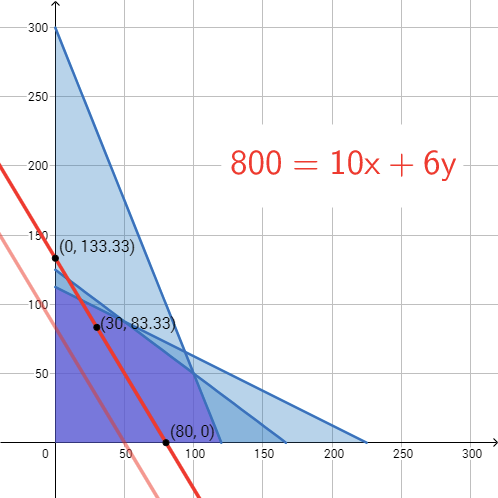
::例2-3Diana can aspire to a higher profit, say $800. She can create and graph the resulting line to observe its intersection with the feasible region. Do so on the same axis as above, interpret this line in the context of the scenario, and find some values from the feasible region that return a profit of $800. Compare this profit line to the previous one. What similarities do you observe? If the value for profit is increased, how does the line change? How does the line stay the same? Explain.
::戴安娜可以追求更高的利润, 比如 800 美元。 她可以创建和绘制由此得出的线以观察其与可行区域的交叉点 。 在与上面相同的轴线上这样做, 在情景中解释这条线, 从可行的区域找到一些回报800美元利润的数值 。 将这条利润线与上一条利润线相比。 您观察到什么相似之处 ? 如果利润值增加, 该线如何改变? 该线如何维持不变 ? 解释 。Solution: The profit equation is now You can use intercepts to graph, but one of them is not in the feasible region. All the combinations of pizzas and calzones on the line and in the feasible region return a profit of $800.
::解决方案 : 利润方程式为 800= 10x+6y。 您可以使用拦截来绘制图表, 但其中之一不在可行区域 。 线上和可行区域所有的比萨饼和内核组合都回报了800美元的利润 。
::xy8000313308313All combinations of pizzas and calzones on the line and in the feasible region earn a profit of $800
::线上和可行地区所有比萨饼和卡片的组合都赚取了800美元利润。The line has the same as the previous profit line. (This can be confirmed by calculating the slope or converting each to slope-intercept form .) In fact, all the profit lines will have the same slope. As the value for profit in the equation is increased, the line moves further from the origin. Eventually, there will be a largest value for profit that moves the line too far from the origin and out of the feasible region.
::线条与先前的利润线相同 。 (这可以通过计算斜坡或将每条利润线转换为斜坡拦截形式来证实 。 ) 事实上, 所有利润线都将具有相同的斜坡 。 随着方程中利润值的增加, 线条会从原线上走得更远。 最终, 利润的最大价值会将线线线从起点移得过远, 并且偏离可行的区域 。Interactive
::交互式互动Use the interactive below to experiment with different values for profit. Observe how the line for profit changes as the value for profit is changed. Predict the greatest profit and the values that return it. Generalize your observations to any feasible region and any optimization equation.
::使用下面的互动来实验不同的利润值。 观察利润线作为利润值的变化如何。 预测最大利润和回报利润的值。 将您的观察结果概括到任何可行的区域和任何优化方程式 。INTERACTIVEProfit EquationMove the red point to change the value of the profit equation.
::移动红点以改变利润方程式的值 。+Do you want to reset the PLIX?The interactive shows that as profit increases, the line moves further from the origin and eventually passes outside the feasible region. The greatest profit is achieved when the line is as far from the origin as possible, yet still intersecting at least 1 point in the feasible region. This appears to be the point (100,50), a vertex of the polygon surrounding the feasible region. In general, the maximum of an optimization equation can be determined by substituting the values for the vertices of the feasible region into the equation, and selecting the one that returns the greatest value. In this case, profit is maximized at (100,50):
::互动显示,随着利润的增加,线线会从原点进一步移动,并最终越过可行区域。当线离原点尽可能远,但在可行区域中至少交叉1点时,利润最大。这似乎是可行区域周围多边形的顶点(100,50)。一般而言,优化方程的最大值可以通过将可行区域顶点的值替换成等式来确定,并选择返回最大值的值。在这种情况下,利润最大化在(100,50):
::p=10(100)+6(50)p=1300美元Given the constraints on cheese, sauce, and dough, Diana will maximize her profit at 100 pizzas and 50 calzones.
::鉴于对奶酪、酱汁和面团的限制 戴安娜会以100个披萨和50个卡通 来最大限度地获得利润Linear Programming
::线线性规划To optimize an equation over a feasible region described by a polygon:
::在多边形描述的可行区域优化等式:-
Find the vertices of the polygon.
::找到多边形的顶点。 -
Substitute those
points
into the optimization equation to determine which optimizes the equation.
::将这些点替换到优化方程中,以确定哪个方程优化。
Interactive
::交互式互动Use the interactive below to explore how changing the parameters of an optimization equation changes the resulting minimum and max. Move the red sliders to find optimization equations that make every point on a complete side of the feasible region sufficient to maximize the optimization equation.
::使用下面的互动来探索如何改变优化方程式的参数来改变生成的最小值和最大值。 移动红色滑动符以找到优化方程式, 使可行区域的完整一面的每个点都足以使优化方程式最大化 。INTERACTIVEMaximize the Optimization EquationMove the red sliders to find optimization equations that make every point on a complete side of the feasible region sufficient to maximize the optimization equation.
::将红色滑动符移动到找到优化方程式,使可行区域的完整一侧的每个点都足以使优化方程式最大化。+Do you want to reset the PLIX?Work it Out
::工作出来-
The following system of linear inequalities represents a set of constraints for a model. Below that is an optimization equation that you want to maximize. Graph the system and find the maximum profit (p).
::以下线性不平等体系代表了模型的一套制约。 下面是您想要最大化的优化方程式。 绘制系统图并找到最大利润 (p) 。
::5x+4y=5003x+7y=8004x+2y=300x0y=0p=40x+50y-
G
loria has many projects, one of which is making furniture. She
works 5 hours to make each table and 2 hours
to make each
chair, and only works 100 hours per month on the project.
Her
secret ingredient to making beautiful furniture is a rare varnish imported from Costa Rica. Each table requires 6 ounces of varnish, and each chair 4 ounces, and she is only able to acquire 150 ounces per month. She sells each table for $100 and each chair for $50. Create inequalities which model the scenario, and graph the polygon representing the feasible region. Find the vertices of the polygon. Test these points in the equation for profit to determine which combination of tables and chairs maximizes Gloria's profit. Can Gloria make and sell fractions of furniture? Does your solution feature integer values? If not, find integer values nearby that maximize profit but are still in the feasible region.
::Gloria有许多项目,其中之一是家具制作。她工作5小时,每个桌子制作,2小时,每个椅子制作,每个项目每月只有100小时。她制造漂亮家具的秘密成分是哥斯达黎加进口的稀有清漆。每个表格需要6盎司的清漆,每张4盎司,她只能每月获得150盎司。她每张桌子销售100美元,每张椅子50美元。她创建了模拟情景的不平等,并绘制了代表可行区域的多边形图。找到多边形的顶端。测试公式中的这些点以营利为目的,以确定表格和椅子的哪些组合能使Gloria的利润最大化。Gloria能够制造和销售家具的一小部分吗?你的解决方案是否以整数值为特点?如果不是的话,在附近找到整数值,可以实现最大利润,但仍在可行区域。
Interactive
::交互式互动Click the button in the interactive below to visualize your efforts to maximize profit in the last problem. Interpret your solution in the context of this interactive.
::单击下方互动的按钮,可以直观地显示您为在最后一个问题中获取最大利润所做的努力。在此互动的背景下解释您的解决方案 。INTERACTIVEVisualize Linear ProgrammingClick the "Graph Inequality" button to visualize your efforts to maximize profit in the last question.
::单击“ Grapph 不平等” 按钮可以想象您在最后一个问题中为获取最大利润所做的努力 。+Do you want to reset the PLIX?Interactive
::交互式互动So far you have only maximized an optimization equation. It's also possible to minimize an optimization equation. It's also possible to have a feasible region that is unbounded, that is, it is not described by a polygon. Explore the following interactive. Find the intersection points between the lines that describe the boundaries of the region. Use these to minimize the optimization equation
::到目前为止,您只实现了最大优化方程式。 也有可能将优化方程式最小化。 也有可能有一个可行的区域不受约束, 即多边形没有描述。 探索以下互动点。 查找描述区域边界的线条之间的交叉点。 使用这些点来最小化优化方程式 p=x+y 。INTERACTIVEMinimize the Optimization EquationClick each of the points where the two functions intersect each other or an axis.
::单击两个函数相互交叉或轴相交的每个点。+Do you want to reset the PLIX?Summary
::摘要-
Linear programming is optimizing an equation over a feasible region.
::线性方案规划正在一个可行的区域优化一个等式。 -
Graph the system of linear equalities to represent the feasible region.
::直线等同系统图解代表可行的区域。 -
Find the vertices of the the feasible region.
::寻找可行区域的顶点。 -
Substitute these values into the optimization equation to determine the minimum or maximum.
::将这些值替换为优化方程,以确定最低或最高值。
-
Diana runs a pizza and calzone stand. Her food is famous for its Italian mozzarella cheese. Each pizza needs 6 ounces of
mozzarella
, and each calzone needs 8 ounces, and Diana gets 1000 ounces of
mozzarella
per week. Create a graph that shows the relationship between the number of pizzas and calzones she can possibly make. Extend your
-axis to 300, and your
-axis to 300. Restrict your graph to
and