抽样和正常分发
Section outline
-
The Purpose of this Lesson
::本课程的目的In this lesson, you will explore taking samples and computing statistics . You'll investigate the distribution of statistics from multiple samples. You'll learn more about bell-shaped distributions, their relationship to samples and statistics, and their importance to the practice of statistics.
::在此教训中, 您将探索采集样本和计算统计数据。 您将调查多个样本中统计数据的分布。 您将了解更多关于钟形分布、 它们与样本和统计数据的关系, 以及它们对统计实践的重要性 。Introduction: Statistics for Decision Making
::导言:决策统计Statistics are often useful for helping people make decisions. A student deciding which college to attend might look at the average student debt or the income of graduates. What are some other statistics a student would consider when deciding which college to go to?
::统计往往有助于帮助人们做出决策。 决定哪个学院的学生可以研究学生平均债务或毕业生的收入。 学生在决定上哪个学院时会考虑哪些其他统计数据?
Activity 1 : Samples and Statistics, Populations and Parameters
::活动1:抽样和统计、人口和参数Statistics are numerical summaries of data . For example, the mean calories in cans of soda is a statistic . Where does data come from? Data is collected in samples . A sample is a subset of all the data available. If you want to calculate the mean calories in cans of soda, you can't measure the calories in all the cans of soda in the world. Instead, you can take a sample and calculate your statistic. Your statistic might be a pretty good estimate of the corresponding parameter for the overall population . A parameter is a numerical summary of all the data, that is, the population.
::统计是数据的数字摘要。例如,苏打水罐中的平均卡路里是一个统计。数据来自何处?数据来自何处?抽样中收集的数据。抽样是所有可用数据的一个子集。如果你想计算苏打水罐中的平均卡路里,那么无法测量世界上所有苏打水罐中的卡路里。相反,你可以取一个样本来计算你的统计。你的统计可能很好地估计了整个人口的相应参数。一个参数是所有数据的数字摘要,即人口。Work it Out
::工作出来-
Determine if each of the following represents a statistic of a sample or a parameter of a population. Explain your choices. If you choose statistic, explain what the sample is, and what the parameter and population would be. If you choose parameter, give an example of a sample and statistic that might give us a good estimate for that parameter.
-
The number of home runs a baseball team hits in a given month.
::每个月全垒打棒球队的全垒打数 -
The mean calories in 20 cans of soda.
::20罐苏打水的平均卡路里 -
The
maximum
volume of the Strategic Petroleum Reserve in the past year.
::战略石油储备在过去一年的最大数额。 -
The percentage of humans with blood type O.
::血型O的人的百分比 -
The parts per million of carbon dioxide in the atmosphere.
::大气中二氧化碳的百万分之一 -
The number of emperor penguins in the world.
::世界上皇帝企鹅的数量 -
The number of emperor penguins a scientist counts on a small island in the Ross Sea.
::一位科学家在罗斯海的一个小岛上 发现了一位科学家的皇帝企鹅数量 -
The parts per million of carbon dioxide as measured today at the monitoring station in Mauna Loa.
::今天在Mauna Loa监测站测量到的百万分之一二氧化碳含量。 -
The
standard deviation
for the distribution of the grades of 20 students on a national test.
::全国考试20年级学生的分布标准差。 -
The standard deviation for the masses of all the cars in the world.
::世界上所有汽车的 标准偏差 -
The standard deviation for the masses of 20 cars selected at
random
.
::随机选择的20辆汽车的质量标准偏差。 -
The
mean
number of green candies in 20 bags of candies.
::20袋糖果中的绿色糖果平均数量 -
The median number of games won by NBA teams last year.
::全国律师协会队去年赢得的比赛中位数。 -
The most frequently occurring number of televisions in 100
homes
.
::100个家庭中最经常发生的电视机数量。 -
The most frequently occurring number of televisions in all the homes in the world.
::全世界所有家庭最经常出现的电视数量。 -
The
proportion
of times heads comes up when you flip a coin 20 times.
::当你翻硬币20次时 头的出现比例 -
The proportion of marshmallows to cereal in a box of Yummy Fluffy breakfast cereal.
::棉花糖与麦片的比例, -
The proportion of marshmallows to cereal in all the boxes of Yummy Fluffy in all the world.
::棉花糖与麦片的比例 在世界上所有 Yummy Fluffy盒子中。
::确定以下每个样本或人口参数的统计。 解释您的选择。 如果您选择了统计, 请解释样本是什么, 以及参数和人口是什么。 如果您选择参数, 请举一个样本和统计的例子, 可能让我们对这一参数做出一个良好的估计。 家庭在某个月里会有一个棒球队。 20罐苏打中的平均卡路里数。 战略石油储备在去年的最大量 。 血型 O 的人比例 。 大气中的二氧化碳每百万分之一 。 世界上皇帝企鹅的数量 。 皇帝企鹅在罗斯海的一个小岛上数 。 今天在Mauna Loa的监测站测量的每百万二氧化碳部分。 20个学生在全国测试中分布的标准差 。 全世界所有汽车数量的标准差 随机选择的20辆汽车的标准差 。 所有20袋的绿色软糖平均数量 。 NBA 游戏中一位科学家在罗斯海岛的一个小岛上数 。 在去年电视机队中经常看到100个比例 。 在电视机队中经常出现100个比例 。 -
The number of home runs a baseball team hits in a given month.
Statistics and Samples, Parameters and Populations
::统计及抽样、参数和人口A statistic is a numerical summary of a sample.
::统计数字是抽样数字摘要。A sample is a subset of data from the population.
::抽样是人口数据的一个子集。A parameter is a numerical summary of a population.
::参数是一个人口的数字摘要。-
Janelle is a chemistry student. She wants to assess the distribution of calories in cans of Super Soda. The label indicates a single caloric content of
140
calories. She wonders, is this number roughly correct, and is there much variation around the mean? She takes a sample of 20 cans of
Super Soda
. Using her chemistry lab, she calculates the following caloric contents for each
Super Soda
. Find the mean and standard deviation. Create a
histogram
and represent the mean and the values that are one standard deviation from the mean as vertical lines. What percentage of values in the sample were within one standard deviation of the mean? Interpret the data in the context of the scenario.
::Janelle是化学系学生。 她想评估超级索达罐中热量的分布。 标签显示140卡路里的一个单一热量含量。 她好奇的是, 这个数字是否大致正确, 以及是否在平均值上存在很大差异? 她取了20个超级索达罐的样本。 她利用化学实验室计算了每个超级索达的以下热量含量。 查找平均值和标准偏差。 创建直方图, 并代表与平均垂直线相比的一个标准偏差的平均值和值。 样本中值的百分比在平均值的一个标准偏差之内吗 ? 在情景中解释数据 。
145, 156, 143, 151, 142, 137, 139, 141, 142, 157, 152, 152, 148, 146, 141, 137, 133, 139, 141, 145
PLIX Interactive
::PLIX 交互式互动
Activity 2: Dot Plots
::活动2:点绘图B ox plots and histograms aren't the only ways to represent the distribution of data. A dot plot is another way to represent a distribution, and it will be particularly useful for representing the distributions throughout the remainder of this lesson.
::框图和直方图并不是代表数据分布的唯一方法。点图是代表分布的另一种方法,对于代表本课剩余部分的分布将特别有用。Example 2-1
::例2-1Sakda enjoys bowling on weekends. He decides to track his performance over 20 games. His scores are shown below. Represent them with a dot plot. Find the mean and standard deviation, and indicate the mean and values that are one standard deviation from the mean on the plot. Discuss the characteristics of the distribution. Create your own distribution of bowling scores that features the same mean but a smaller standard deviation.
::Sakda在周末享受保龄球。他决定跟踪他20场比赛的成绩。他的分数显示在下面。用点图代表他们。找出中值和标准偏差,并指明中值和中值与图中平均值的一个标准偏差。讨论分布的特性。建立自己的保龄球分数分布,其平均值与标准偏差相同,但标准偏差较小。207, 251, 245, 236, 221, 228, 230, 257, 243, 237, 251, 230, 232, 246, 243, 259, 300, 210, 224, 211
Solution: A dot plot features points above the values in the data set . If a value is duplicated, dots are stacked. The mean and values one standard deviation from the mean are indicated with vertical lines below. of values are within one standard deviation of the mean. The distribution features a likely outlier , 300, a perfect game of bowling! If this score had been 240 (close to the mean), the distribution would look quite different, and feature a much smaller standard deviation. The first plot below is the plot of the given scores. The second plot replaces the score of 300 with a score of 240. The standard deviation of the second distribution is smaller. Also, in the second distribution, of values are within one standard deviation of the mean.
::解析 : 点绘图特征高于数据集中的值。 如果一个值重复, 则堆叠点。 平均值和值与平均值的一个标准偏差以1520=75%以下的垂直线表示, 值在平均值的一个标准偏差之内。 分布特征可能是一个外差, 300, 一个完美的保龄游戏! 如果这个分数是240( 接近平均值) , 分布将看起来大不相同, 并具有一个小得多的标准偏差。 下面的第一个图是给定分的图。 第二个图将300分换成240分。 第二个分布的标准偏差较小。 在第二个分布中, 1320=65%的值在平均值的一个标准偏差之内 。Mean, +1, and -1 standard deviation of 20 bowling scores Mean, +1, and -1 standard deviation of 20 bowling scores, with no outliers
Activity 3 : Plotting Statistics from Multiple Samples
::活动3:从多个抽样中绘制统计数据The practice of statistics involves gathering statistics from samples. One of the essential questions of statistics is this:
::统计实践涉及从抽样中收集统计数据。How well does a statistic from a sample reflect the corresponding parameter of the overall population?
::抽样的统计数字如何反映总人口的相应参数?If Janelle measures the calories in her sample of 20 Super Sodas and calculates the mean calories, it seems like this should tell us something about the mean calories of Super Sodas in the world at large. In fact, s tatistics from samples tend to cluster around the corresponding parameter for the population. The following example gives you a chance to explore this further. You'll collect multiple samples, plot the statistics from those samples, and visualize the corresponding parameter for the population.
::如果Janelle测量了20个超级苏打热量样本中的热量,并计算了平均热量,这似乎应该告诉我们全世界超级苏打热量的平均热量。事实上,来自抽样的统计数字往往围绕相应的人口参数。下面的例子可以给你一个进一步探讨的机会。你会收集多个样本,从这些样本中绘制统计数据,并对相应的人口参数进行可视化。Example 3-1
::例3-1Flip a coin ten times, and count the number of times heads appeared. This is an experiment . Your experiment consisted of 10 trials . Each trial was a flip of the coin, and there were two possible outcomes, heads or tails, determined by chance. Each flip was independent , that is, the results of one flip didn't influence the results of another. Plot the number of heads on a dot plot. Perform the experiment 4 more times, and plot the results.
::翻一个硬币十次, 并计出头出现的次数。 这是一个实验。 您的实验由十次试验组成。 每次试验都是一次硬币的翻转。 每次试验都是一次硬币的翻转, 可能有两个结果, 头或尾, 是由偶然决定的。 每个翻转都是独立的, 也就是说, 一个翻转的结果不会影响另一转的结果。 在点图上绘制头数 。 进行四次试验, 并绘制结果 。Solution: This distribution is different from the other distributions you've worked with so far. Previously, you plotted distributions of data from a single sample and visualized statistics like the mean or standard deviation. The previous plots on this page are all distributions of data from a single sample - 20 cans of Super Soda, or 20 games of bowling.
::解决方案 : 此分布与您迄今所合作过的其他分布方式不同 。 之前, 您绘制了一个样本和可视化统计数据的数据分布图, 如平均值或标准偏差 。 本页上之前的绘图图是所有来自单个样本的数据分布图 - 20罐超级索地, 或20次保龄球游戏 。The distribution of the number of heads below is a distribution of statistics from multiple samples. The statistic is the number of heads. You ran the experiment five times and got five values for the statistic. The plot below shows the distribution of that statistic over the five samples. It tells something about the mean of the actual population, that is, the parameter for how often you can expect heads to show up if you flip a 50-50 coin. Naturally, you already know the answer, but the point is to see how statistics from samples can predict it. In the real world, you don't always know the probability of the events you are trying to model.
::下面头数的分布是多个样本的统计分布。 统计数据是头数。 您进行了五次实验, 并得到了五个统计值。 下面的图示显示了五个样本的统计分布情况。 它描述了实际人群的平均值, 也就是说, 如果翻了一个50- 50硬币, 你多久可以预期头会出现的参数。 当然, 您已经知道答案, 但关键在于查看来自样本的统计数据如何预测。 在现实世界中, 您并不总能知道您试图模拟的事件的概率 。The mean below is the mean number of heads from the five samples. The corresponding standard deviation is also graphed.
::下面的平均值是五个样本头的平均值。相应的标准偏差也用图表标示。Mean, +1, and -1 standard deviation of the number of heads out of ten coin flips over 5 trials. Experiments
::实验实验A statistical experiment consists of trials.
::统计实验包括试验。Each trial has outcomes that are independent and determined by chance.
::每次审判的结果都是独立和由偶然决定的。Plotting Statistics from Multiple Samples
::从多个抽样中绘图统计-
Choose a
sample size
and a statistic.
::选择样本大小和统计。 -
Take as many samples as you like.
::随你取多少样本都行 -
For each sample, compute your statistic.
::每个样本,计算你的统计。 -
Plot the
distribution of your sample statistic
using a dot-plot, histogram, or other representation.
::使用点图、直方图或其他表示法绘制抽样统计数据的分布图 。 -
Compute the mean and standard deviation of your distribution.
::计算分布的平均值和标准差。 -
Interpret your
distribution
, and consider if the mean of your distribution of sample statistics is reflective of the corresponding parameter of the population.
::解释您的分布,并考虑您抽样统计数据分布的平均值是否反映了相应的人口参数。
Interactive
::交互式互动The interactive below allows you to complete coin tossing experiments as above, without a coin. There are two variables you can change:
::下面的互动允许您在没有硬币的情况下完成上述抛掷硬币的实验。 您可以更改两个变量 :-
You can change the number of experiments. That's changing the number of samples and the number of resulting sample statistics. That
variable
is
::您可以改变实验的数量。这正在改变样本的数量和结果的样本统计数量。这个变量是 r。 -
You can modify the coin so that it's not a 50-50 coin. That variable is
If
the coin is 50-50.
::您可以修改硬币, 使其不是50- 50硬币。 变量是 p。 如果 p=0. 5, 硬币是50- 50 。
Use the interactive to answer the questions that follow. Experiment with the interactive until you understand what each slider is changing. Then answer the questions that follow:
::使用互动来回答接下来的问题。 试验交互, 直到您了解每个滑动符都在改变什么。 然后回答下面的问题 :-
Keep the coin 50-50. Experiment with changing the number of experiments, that is, the number of samples. Look carefully at what happens to the shape of the distribution as the number of samples goes from 0 to 100. What do you observe? Look at the mean and standard deviation as the number of samples goes from 0 to 100. What do you observe?
::保留硬币 50 - 50 。 实验以改变实验数量, 即样本数量 。 仔细看, 当样本数量从 0 到 100 时, 分布的形状会发生什么 。 您观察什么 ? 看看样本数量从 0 到 100 时的平均值和标准偏差 。 您观察什么 ? -
Keep the number of samples at 100. Experiment with changing the coin from 50-50 to other probabilities. It is possible to create coins that return heads 100% of the time, or 0% of the time. What do you observe?
::将样本数量保持在100个。 实验将硬币从50- 50变换为其他概率。 有可能创建硬币, 100%的时间或0%的时间返回头部。 您观察了什么 ?
Activity 4: The Distribution of Sample Statistics
::活动4:抽样统计的分布情况Example 4-1
::例4-1Helena enjoys buying multi-colored candies called Tropicandies at the candy store. The green ones are pretty rare. Helena buys Tropicandies in bulk, meaning she can change her sample size whenever she likes. She buys 20 candies, and 6 of them are green. What proportion of her candies are green?
::Helena喜欢在糖果店买多色糖果,叫做Tropicandies。绿色糖果非常罕见。Helena大量购买Tropicandies。这意味着她可以随时随地改变样本大小。她购买20个糖果,其中6个是绿色。她的糖果中有多少比例是绿色?Helena decides to take 9 more samples of 20 candies over the week. Instead of plotting the number of green candies, she will plot the proportion of green candies. The -axis on her graph will be scaled from 0 to 1. Here are the proportions of candies she found in her 9 remaining samples:
::海伦娜决定在本周内再取9个20只糖果的样本。她将绘制绿色糖果的比例,而不是绘制绿色糖果的数量。她的图表上的x轴将从0缩到1。 这是她在剩下的9个样本中发现的糖果的比例 :0.25, 0.3, 0.35, 0.25, 0.4, 0.2, 0.35, 0.25, 0.3
Graph these as a dot plot. Find the mean and standard deviation. Represent the mean and values one standard deviation from the mean on the graph. What do you think the proportion of green candies is in the entire population? Why?
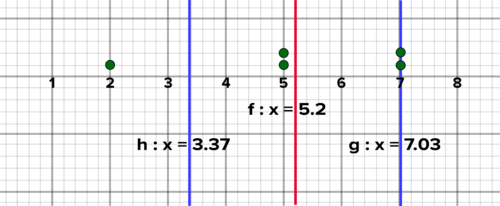
::以点图绘制这些图。 查找平均值和标准偏差。 表示平均值和值与图中平均值的一个标准偏差。 您认为绿色糖果在总人口中的比例是多少? 为什么?Solution: The plot below shows the distribution of the proportions of green candies in each sample. These have a mean of 0.3, or 30%. The proportion of green candies in the entire population is likely near 0.3. The distribution of the sample proportions is clustered around the proportion of green candies in the world at large.
::溶液:下面的地块显示了每个样本中绿色糖果比例的分布情况。 这些样本的平均值为0.3或30%。 整个人口中的绿色糖果比例可能接近0.3。 样本比例的分布情况围绕全世界绿色糖果的比例。Helena buys 20 candies and 6 of them are green. What proportion of the candies are green? Interactive
::交互式互动Use the interactive to experiment further with Helena's scenario. The interactive allows you to change each of the following:
::利用交互性来进一步试验海伦娜的假想。交互性使你能够改变下列每一种情况:-
You can change the sample size, that is, the number of candies. That variable is
::您可以更改样本大小,即糖果数量。变量为 n。 -
You can change the number of experiments. That's changing the number of samples and the number of resulting sample statistics. That variable is
::您可以改变实验的数量。这正在改变样本的数量和结果的样本统计数量。这个变量是 r。 -
You can modify the
proportion of candies in the population at large
so that it's not 30%
. That variable is
::您可以修改糖类在一般人口中的比例, 这样它就不会占30%。 这个变量是 p 。
Once you understand what the sliders do, answer the questions that follow:
::一旦你了解滑行器的动作 回答下面的问题-
Keep the sample size at 20, and the proportion in the population at 30%. Change the number of samples from 1 to 100. What do you observe? Look at the mean and standard deviation as the number of samples goes from 1 to 100. What do you observe?
::将样本大小保持在 20 个, 人口比例保持在 30 个。 将样本数量从 1 个 改为 100 个, 您观察到什么 ? 查看样本数量从 1 个 到 100 个的平均值和标准偏差 。 您观察到什么 ? -
Keep the number of samples at 100, and the proportion in the population at 30%. Change the sample size from 1 to 100. What do you observe? Look at the mean and standard deviation as the sample size goes from 1 to 100. What do you observe?
::将样本数量保持在100个, 人口比例保持在30% 。 将样本规模从 1 改变为 100 个, 您观察到什么 ? 查看样本规模从 1 个 到 100 个的平均值和标准偏差 。 您观察到什么 ? -
Experiment with changing the proportion in the population. What do you observe?
::改变人口比例的实验,你看到了什么?
The Distribution of Sample Statistics
::抽样统计数据的分布情况The distribution of sample statistics form a bell-shaped distribution. The mean of the sample statistics can serve to approximate the corresponding parameter for the population.
::抽样统计数据的分布形成钟形分布,抽样统计数据的平均值可以用来估计人口的相应参数。As the sample size increases, the sample statistics cluster more tightly around the mean. In other words, the standard deviation of the distribution of the sample statistics decreases. This can serve to increase the precision of our estimate of the corresponding parameter for the population at large.
::随着抽样规模的扩大,抽样统计围绕平均值聚集得更为紧凑,换句话说,抽样统计数据分布的标准偏差下降,这有助于提高我们对全体人口相应参数的估计的精确度。PLIX Interactive
::PLIX 交互式互动
Activity 5 : The Normal Distribution
::活动5:正常分配In the example above, as the number of samples increased, it became clear that the sample proportions clustered around the mean proportion in a roughly bell-shaped distribution. As the sample size increased, the distribution clustered more tightly around the mean proportion in a roughly bell-shaped distribution. As sample size increases , that mean proportion gets closer to the corresponding parameter for the population.
::在上文的例子中,随着样品数量的增加,可以明显看出,抽样比例集中在大约钟形分布中的平均比例上,随着抽样规模的增加,分布更加紧紧地围绕着大约钟形分布中的平均比例,随着抽样规模的增加,平均比例接近人口的相应参数。Crucially, any statistics from samples will cluster around the corresponding parameter in the real world. This gives significant purpose and power to the practice of statistics. It means that statistics from samples can tell us something about the larger world.
::至关重要的是,来自样本的任何统计数据都将围绕真实世界的相应参数进行分组。 这使得统计实践具有重要的目的和力量。 这意味着来自样本的统计数据可以告诉我们关于大世界的一些信息。In general, as the number of samples and the sample sizes increase, the bell-shaped distribution of sample statistics gets closer to what is called a normal distribution , a perfect bell shape that can be modeled with an equation.
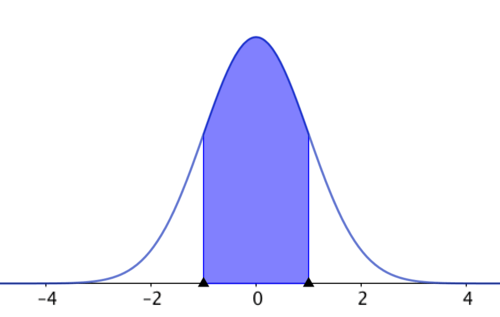
::一般而言,随着样本数量和样本大小的增加,样本统计数据的钟形分布更加接近所谓的正常分布,即一种完美的钟形形状,可以用方程建模。Below is a graph of the standard normal distribution. The mean is 0 and the standard deviation is 1. Values within one standard deviation of the mean are shaded. Remember that the means that when a distribution is roughly normal, approximately 68% of values will fall within one standard deviation of the mean.
::下面是标准正态分布图。 平均值为 0 , 标准偏差为 1. 1 , 平均值一个标准偏差中的值被遮蔽。 记住这意味着当分布大致正常时, 约68%的值将低于平均值的一个标准偏差 。The Standard Normal Distribution Statistics from multiple samples aren't the only data sets that are roughly normally distributed. The reason statistics from multiple samples are roughly normally distributed is that they are based on a random sample of items, where each has a probability of being heads or tails, green or some other color, and so on. If you think about it, a lot of events in the world have enough randomness as part of their outcomes that they are like random experiments: whether or not a basketball player makes a free throw; the amount of rain in Antarctica over the years; the number of customers at a store on every Wednesday in a year, the price of espressos at the world's cafes. Data from real-world scenarios are often normally distributed too, because there is enough randomness involved in those scenarios to make them roughly fit the curve.
::来自多个样本的统计并非通常分布的唯一数据集。来自多个样本的统计通常都是基于随机的物品抽样,其中每个样本都有可能是头部或尾部,绿色或其他颜色,等等。如果你考虑一下,世界上的许多事件都有足够的随机性,作为其结果的一部分,它们就像随机实验:篮球运动员是否自由投球;多年来南极洲的降雨量;每年星期三每家商店的客户数量;世界咖啡馆的咖啡价格。现实世界情景中的数据通常也通常也分布,因为这些情景中涉及足够的随机性,使得它们大致符合曲线。The Normal Distribution
::正常分配As sample size increases, the distribution of sample statistics approaches a perfect bell-shaped curve called the normal distribution.
::随着抽样规模的增加,抽样统计数据的分布接近于一个称为正常分布的完美的钟形曲线。Distributions of sample statistics are not the only distributions that are roughly normal.
::抽样统计数据的分布并非唯一大致正常的分布。Many real-world data sets are roughly normal because they are subject to the random inputs that give rise to the normal distribution.
::许多真实世界数据集大致正常,因为它们受到随机输入的制约,导致正常分布。Work it Out
::工作出来Choose a food product that you purchase regularly, or another source for a sample that you can take easily. Determine a related statistic, and take as many samples as you like. Suggestions are given below. Plot the data on a dot plot. Determine the mean and standard deviation, and represent the mean and values one standard deviation from the mean on the graph. Predict the value of the corresponding parameter in the population at large.
::选择您定期购买的食物产品, 或选择您可以轻松获取的样本的其他来源。 确定相关的统计, 并取取您喜欢的样本。 下面给出建议。 绘制点图上的数据。 确定平均值和标准偏差, 并代表平均值和数值与图表中平均值的一个标准偏差。 预测整个人群中相应参数的值 。-
Bags of apples, and the number of apples per bag.
::一袋苹果,每袋苹果的数量。 -
The number of french fries, carrot sticks, or any other food item you eat regularly but do not choose the number of.
::薯条、胡萝卜棒或其他食物的份数, -
Small bags of candy eaten frequently and the proportion of candies of a selected color.
::小袋的糖果经常被吃,糖果的比例也由特定颜色决定。 -
The amount gas purchased on each fill-up of a vehicle.
::每填充一辆车所购买的气体数量。 -
Your grades on frequent quizzes.
::经常考考考的成绩 -
The number of words spoken by the cashier to the person in front of you in line.
::出纳员对排队的你前面的人说的字数。
Summary -
A
sample
is a subset of data from the population.
::抽样是人口数据的一个子集。 -
A
statistical experiment
consists of trials that have independent outcomes determined by chance.
::统计实验包括由偶然决定独立结果的试验。 -
As the sample size increases, the sample statistics cluster more tightly around the mean.
::随着抽样规模的扩大,抽样统计数据围绕平均值集中得更加紧密。 -
A
normal distribution
is a perfect bell shaped distribution that can be modeled with an equation.
::正常的分布是完美的钟形分布,可以用方程式模拟。
-
Determine if each of the following represents a statistic of a sample or a parameter of a population. Explain your choices. If you choose statistic, explain what the sample is, and what the parameter and population would be. If you choose parameter, give an example of a sample and statistic that might give us a good estimate for that parameter.