关联和原因
Section outline
-
The Purpose of this Lesson
::本课程的目的In this lesson you will interpret the statistical correlation between two variables. You will explore whether or not a statistical correlation implies a causal relationship between the variables.
::在此教训中, 您将解释两个变量之间的统计相关性。 您将探索统计相关性是否意味着变量之间的因果关系 。Introduction : Correlations Between Two Variables are Easy to Create
::导言:两个变量之间的关联易创建In the last lesson, you learned that the correlation coefficient is a measure of how well a line of best fit actually fits the data . It's easy to create a data set that features a strong positive or strong negative correlation .
::在最后的教训中,你了解到,相关系数是衡量一线最合适数据实际与数据是否相符的尺度。很容易创建一套具有强烈正反相关性的数据集。
Activity 1: Correlation Can Be Meaningless or Random
::活动1:关联可以是无意义或随机的Interactive
::交互式互动The interactive below allows you to move the given points to change the correlation , as measured by the correlation coefficient. Move the points to create a strong positive or strong negative correlation.
::下面的交互点允许您移动给定的点以改变关联性, 以相关系数衡量。 移动点以创建强烈正负相关关系 。INTERACTIVEStrong Correlation-
In the interactive below, the blue line graphs the line of best fit for the red data points.
::在下文互动中, " 蓝线 " 图示最适合红色数据点的线条。 -
Move the red points to change the data set and click on a point to see its coordinates.
::移动红点以更改数据集,单击一个点以查看其坐标。 -
The value
r
(the correlation coefficient) tells us how strong the correlation of the data set is.
::值 r (相关系数) 告诉我们数据集的关联性有多强。
+Do you want to reset the PLIX?Interactive
::交互式互动Use the interactive below to generate a random data set of points built from the integers from 0 to 15. For each random data set, the line of best fit is graphed and the correlation coefficient is shown. Continue to create random data sets until you encounter one with a strong positive or strong negative correlation. Keep rough track of how many random data sets it took for you to encounter one with a strong positive or strong negative correlation. If you select a fixed number of points at random for long enough, do you think that you'll always eventually stumble upon a strong positive or strong negative correlation? Why or why not? How many random data sets do you think would be required to generate a correlation coefficient above 0.95? Explain. Do you think it is possible that if you generated a million random data sets, you would stumble upon one with a correlation coefficient of 1? Explain.
::使用下面的互动来生成从 0 到 15 的整数中构建的随机数据集。 对于每个随机数据集, 都会绘制最匹配的线, 并显示相关系数 。 继续创建随机数据集, 直到您遇到一个具有强烈正或强烈负相关关系的数据组 。 保持一个非常正或强烈负相关关系的数据组的粗略跟踪 。 如果您随机选择一个固定的点数, 时间足够长, 您是否认为您最终会发现一个强大的正或强烈负相关点 ? 为什么或不是? 您认为需要多少个随机数据集来生成0. 95 以上的相关系数 ? 解释 。 您是否认为如果生成一个百万个随机数据集, 您可能会遇到一个带有 1 个相关系数的随机数据集? 解释 。INTERACTIVECorrelation and Causation-
In the interactive below, click the button to generate a new random data set.
::在下文互动中,单击按钮生成新的随机数据集。 -
The correlation coefficient
r
,
r
is also given.
::还给出了相关系数r,r。
+Do you want to reset the PLIX?The above experiments were meant to show you that it is possible to create a data set that has a strong positive or strong negative correlation, either by deliberately cherry picking point locations, or from random selection of points. It was easy to create a statistical correlation between two variables. There was no meaningful relationship between the two variables in the real-world, because the variables themselves had no meaning.
::上述实验旨在向大家表明,有可能通过有意挑选樱桃点位或随机选择点位来创建具有强烈正反相关性的数据集。 很容易在两个变量之间建立统计相关性。 在现实世界中,这两个变量之间没有有意义的关系,因为变量本身没有意义。You were able to create correlation two ways:
::你可以创造出两个互相关联的方式:-
Cherry picking data to create a
strong correlation
.
::樱桃采集数据来建立紧密的关联关系 -
Randomly selecting data until you stumbled across a strong correlation.
::随机选择数据,直到你偶然发现强烈的关联。
The real world is full of data. It's easy to cherry pick data sets for two variables that, when you put them together into ordered pairs, they are statistically correlated. Or, you can randomly select real-world data sets for two variables, and eventually you will stumble across data sets that are statistically correlated.
::真实世界充满了数据。 樱桃很容易为两个变量选择数据集, 当将它们组合成有顺序的对子时, 它们具有统计相关性。 或者, 你可以随机选择两个变量的真实世界数据集, 最终你会在统计上相互关联的数据集中偶然发现。Correlation Can Be Meaningless Or Random
::关联可以是无意义或随机的If you design data sets so that they are statistically correlated, the correlation is meaningless.
::如果您设计数据集,使其在统计上具有相关性,则其相关性毫无意义。If you cherry pick real-world data sets that are statistically correlated, it is possible that there is no actual real-world relationship between the variables. The correlation might be meaningless.
::如果樱桃选择与统计相关的真实世界数据集,则变量之间可能不存在真实世界关系。这种关联可能是毫无意义的。If you randomly select meaningless or real-world data sets, eventually you will stumble across data sets that are correlated. The correlation might be meaningless.
::如果您随机选择无意义的或真实世界的数据集, 最终您将偶然发现相关的数据集。 相关数据可能是毫无意义的 。PLIX Interactive
::PLIX 交互式互动
Activity 2: Meaningless Correlations Created By Cherry-Picking Data
::活动2:通过樱桃切除数据建立的无意义互换Example 2-1
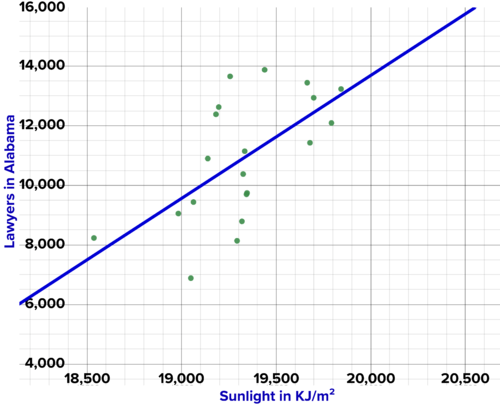
::例2-1Below is a graph of the number of lawyers in Alabama versus the amount of sun in California for 20 years. This data was cherry picked. The correlation coefficient is about 0.61. Do you think there is actually a real-world relationship between the number of lawyers in Alabama and the amount of sun in California? Why or why not?
::下面是阿拉巴马州律师人数与加利福尼亚州20年太阳量的图表。 这些数据是摘取的樱桃。 相关系数约为0. 61。 你认为阿拉巴马州律师人数与加利福尼亚州太阳量之间实际上存在现实世界关系吗? 为什么或为什么没有?Number of lawyers in Alabama vs amount of sun in California. Does it make sense that this is a causal relation? Solution: Humans are very good at finding patterns. And humans are very good at offering explanations for patterns. But many patterns, like the one in the above example, have no explanation. They are the consequence of cherry picking data or of randomness. The above data set exhibits statistical correlation without causation . Causation is a real-world explanation for why one variable is correlated with another. Causation means there is a physical or informational link between the two data sets. Humans always look for causation when they see correlation.
::解决方案: 人类非常擅长寻找模式。 而人类非常擅长解释模式。 但许多模式,如上例中的模式,都没有解释。 它们是樱桃采摘数据或随机的结果。 以上数据集显示了没有因果关系的统计相关性。 原因是一个真实世界的解释,说明了为什么一个变量与另一个变量相关。 原因意味着两个数据集之间有物理或信息联系。 当人类看到关联时,总是寻找因果关系。Finding correlations and establishing causation is an intellectual exercise you engage in every day. For example:
::寻找相关关系和确定因果关系是你们每天从事的智力活动。例如:-
On days when you don't eat lunch, you don't play basketball as well. There's a correlation. Maybe there's causation. Maybe changing your lunch habits actually causes changes in your basketball performance.
::当你不吃午餐的日子,你也不打篮球。这有关系。也许有因果关系。也许改变你的午餐习惯会改变你的篮球表演。 -
Students that eat more vegetables are less likely to have heart disease later in life. There is a correlation. Maybe there's causation. Maybe there's something special about vegetables that improves heart health.
::食用更多蔬菜的学生在晚年就不太可能患心脏病。有相关关系。也许有因果关系。也许蔬菜有特殊之处可以改善心脏健康。
If the above examples exhibit causation, there is a physical link between the calories in lunch and energy drawn on for basketball performance, and a physical link between the chemicals in vegetables and heart health. But until more research is done, the data could be cherry picked, or it could be random.
::如果上述例子显示出因果关系,那么午餐中的卡路里与篮球表演的能量之间就存在物理联系,而蔬菜中的化学物质与心脏健康之间也存在物理联系。 但是,在做更多的研究之前,数据可能是摘樱桃,也可能是随机的。Humans look for patterns, then try to explain them. But not every pattern has an explanation. Correlation doesn't imply causation .
::人类寻找模式,然后试图解释它们。但并不是每个模式都有解释。关联并不意味着因果关系。Correlation Doesn't Imply Causation
::关系并不充分的原因It's easy to find statistical correlation .
::很容易找到统计上的关联Not every correlation has an explanation.
::并非所有相关关系都有解释。The pattern might be cherry picked, or it might be random.
::模式可能是摘樱桃 也可能是随机的Work it Out
::工作出来-
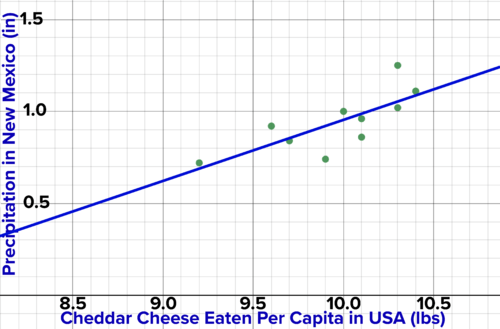
Below is a graph of the amount of rain in
New Mexico
versus the amount of cheddar cheese eaten per person in the US over the years. This data was cherry picked. The correlation coefficient is about 0.76. Do you think there is a causal relationship between the amount of rain in
New Mexico
and the amount of cheese eaten over the years? Why or why not? If that had been rain in Wisconsin, would you have changed your opinion? Why or why not?
::下面是新墨西哥州降雨量相对于多年来美国人均干酪奶酪摄入量的图表。 这些数据是摘取的樱桃。 相关系数约为0. 76。 你认为新墨西哥州的降雨量与这些年的奶酪摄入量之间有因果关系吗? 为什么或为什么没有? 如果这是威斯康辛州的雨,你会改变你的观点吗? 为什么或为什么没有?
U.S. Per Capita Consumption of Cheddar Cheese vs Precipitation in New Mexico -
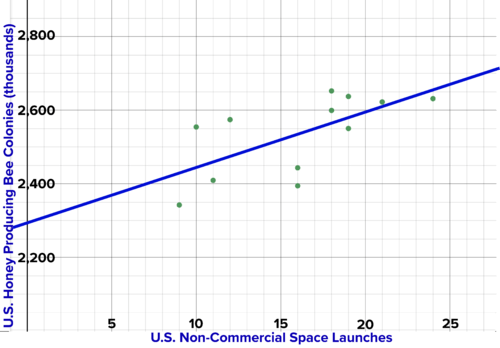
Below is a graph of the number of non-commercial space launches versus the number of commercial bee colonies over the years. The data was cherry picked. The correlation coefficient is about 0.65. Do you think there is causal relationship between the number of bee colonies and the number of space launches? Why or why not?
::下面是这些年来非商业性空间发射数量与商业蜜蜂聚居地数量之间的图表。数据被摘取。相关系数约为0.65。 你认为蜜蜂聚居地数量与空间发射数量之间有因果关系吗?为什么或为什么没有?
(labels, space is y, sources: )
:标签, 空间是 Y, 来源: )
U.S. Non-Commercial Space Launches vs. U.S. Honey Producing Bee Colonies -
(
extension
) Use the tool at this link:
to cherry pick data sets that are correlated. Decide if there is a causal relationship between the two. Explain.
::在此链接上使用工具: 用于摘取相关的樱桃数据集。 决定两者之间是否存在因果关系。 请解释 。 -
It is possible to generate patterns in
univariate data
as well. Roll a dice 10 times. What are all the possible outcomes? Are all the outcomes equally probable? What is the probability of each outcome? Now create an experiment: rolling a dice 100 times.
If you repeat this experiment for years and years
, that is, millions of times, do you think it is possible that eventually you'll stumble across the result that 4 never showed up in 100 rolls? Explain.
::也可以生成单体数据模式。 滚动骰子十次。 可能的结果是什么? 所有的结果都一样可能吗? 每个结果的概率都一样吗? 现在创造一个实验: 滚动骰子100次。 如果您重复这个实验多年, 也就是说, 数百万次, 您是否认为最终你有可能 偶然发现4个从未出现在100卷中的结果? 解释一下 。
Interactive
::交互式互动Use the interactive below to roll 100 dice. Repeat the experiment as many times as you like. How may experiments did it take before 4 appeared less than 10 times? Do you think the experiment where 4 appeared less than 10 times was due to some special feature of the virtual dice during that experiment, or that it was just one random result that you stumbled upon? Explain. How does this connect to the idea that correlation can be the result of random selection of data sets? Explain.
::使用下面的交互式来滚动 100 骰子。 重复多少次实验。 在 4 之前的实验如何显示为10 次 ? 您认为, 4 显示为不到10 次的实验是由于实验中虚拟骰子的某些特殊特性造成的, 还是你偶然碰到的一个随机结果? 解释一下。 这与随机选择数据集的结果之间关联如何? 解释一下 。INTERACTIVERolling Dice-
In the interactive below, click the button to roll 100 dice.
::在下方互动中,单击按钮滚动100骰子。 -
The height of the blue stacks show how many times that number showed up in your 100 dice.
::蓝色堆叠的高度显示 这个数字在你100骰子中 出现多少倍。 -
Click the button to roll the 100 dice again.
::单击按钮再次滚动 100 骰子 。
+Do you want to reset the PLIX?Summary
::摘要-
Correlation doesn't imply causation.
::关系并不意味着因果关系。 -
Correlations can occur because data sets are cherry picked, or because data sets are chosen at random.
::由于数据集是樱桃选取的,或者由于数据集是随机选取的,因此可能发生交错。
-
In the interactive below, the blue line graphs the line of best fit for the red data points.