刻度函数
章节大纲
-
Lesson Objectives
::经验教训目标-
Understand the characteristics and structure of parabolas.
::了解parabolas的特性和结构。 -
Find The
vertex
and axis of
symmetry of a parabola
given a table of values.
::查找给定值表格的抛物线对称的顶点和轴。 -
Identify the graph of a
quadratic function
given the
equation
.
::根据方程式指定二次函数的图形。 -
Calculate the average
rate
of change
using
the
graph of a function
over a specified interval.
::使用指定间隔内函数的图形计算平均变化速率。
Introduction: Average Rate of C hange
::导言:平均变化率In Algebra 1, you learned that have a constant rate of change . This creates a proportional relationship between the increase in the -value and the increase in the -value. The rate at which the -value changes compared to the corresponding change in the -value is called the rate of change .
::在代数1中,你学到了有固定变化率的数值。这在 x - 值的增加与 y - 值的增加之间形成了比例关系。y - 值相对于x - 值的相应变化的变化率被称为变化率。T he rate of change of a quadratic function is not as straight forward. A quadratic function is a function that takes the form where To find the rate of change of a quadratic function, let's consider the example of a falling object.
::二次函数的变速率不是直向的。二次函数是一个函数,以 f( x) = ax2+bx+c 的形式出现。 a+++0。要查找二次函数的变速率,让我们考虑一个下降对象的例子。As an object falls to Earth, the speed of the object accelerates at a constant rate in the absence of friction. Every second the speed of the object increased by 9.8 meters per second, or 32 feet per second. This increase in speed means that every second the object covers more distance than in covered the previous second. Recall that if an object is traveling 50 feet per second, it will cover 50 feet in one second. However, if an object is accelerating, it is not traveling at a constant speed . In this case, the speed of the falling object is increasing at a constant rate since the acceleration is constant. S tarting at a speed of 0 feet per second and, with constant acceleration, ending at a speed of 32 feet per second, the average speed will be the average of 0 and 32.
::当一个物体坠落到地球时,物体的速度在没有摩擦的情况下会以恒定速度加速。 物体的速度每秒每秒增加9. 8米每秒, 或32英尺每秒每秒。 速度的增加意味着天体每秒覆盖的距离比前秒多。 提醒注意, 如果一个物体每秒移动50英尺, 它每秒将覆盖50英尺。 但是, 如果一个物体在加速, 它不会以恒定速度运行。 在这种情况下, 自加速度保持不变以来, 坠落物体的速度会以恒定速度增长。 以每秒0英尺的速度开始, 并且以恒定加速速度以每秒32英尺的速度结束, 平均速度将是0和32平均速度。
::平均速度=S0+Sf2=0+322=16平方英尺/秒The distance traveled by the object can be determined using the formula :
::对象所穿行的距离可以使用公式确定:Assuming that the starting speed is 0 feet per second and the final speed, after 1 second, is 32 feet per second, the object will travel the following distance:
::=平均速度=平均速度=S0+Sf2-timeA 假设起始速度为每秒0英尺,最后速度为每秒32英尺,该天体将行走以下距离:
::=平均速度=S0+Sf2}时间=0+322=1=16英尺Use the interactive below to find the object's speed, and distance traveled after seconds. In this interactive, an acceleration due to gravity of 32 feet per second will be used.
::使用下面的交互效果来查找天体的速度, 距离在 t 秒后持续。 在此交互效果中, 将使用32 英尺/ 秒的重力加速 。INTERACTIVERate of Change-
Fill in the table for the speed and distance at the given time. Acceleration is 32 ft/s.
::在表格中填充给定时间的速度和距离。加速度为32英尺/秒。 -
Click "Next" for the next time.
::下一次点击“ 下一个 ” 。 -
When finished, click "Drop" to drop the ball or "Step" to increase time 1 second at a time.
::完成后, 单击“ 下降” 将球或“ 步数” 击落, 以每次增加时间 1 秒 。
+Do you want to reset the PLIX?
Activity 1: What is a Parabola ?
::活动1:帕拉波拉是什么?To better understand the scenario posed in the introduction, knowledge of quadratic functions will be required. A quadratic function can be identified by its u-shaped graph, known as a parabola . The picture below displays the basic characteristics of a quadratic function.
::为了更好地了解导言中的设想,需要了解二次函数。二次函数可以用其u形图(称为抛物线图)来识别。下面的图象显示二次函数的基本特征。In addition to these characteristics, if the ends of a parabola are pointing up, this is considered concave up . When the ends of the parabola are pointing down, this is considered concave down . When applied to the context of a real-world scenario, each of these characteristics takes on a specific meaning. Use the interactive below to explore quadratic functions in context.
::除了这些特征之外,如果抛物线的终点向上看,这被认为是串联起来的。当抛物线的终点向下看时,这被认为是串联起来的。当应用到现实世界的情景时,这些特征中的每一个都具有特定的含义。使用下面的交互作用来探索上下文的二次函数。
Extension: Increasing and Decreasing Functions
::扩展扩展: 增加和减少函数Use the interactive below to practice identifying whether a part of a function is increasing or decreasing.
::使用以下互动方式确定某一职能的一部分是在增加还是减少。
Activity 2: Plotting Points
::活动2:绘图点Any function can be graphed by plotting input-output pairs. M aking a table of inputs and corresponding outputs helps to approximate the shape formed by a function when graphed. The more points that are graphed, the more accurate the graph will be. While this approach can be time-consuming, it is a great approach for understanding functions.
::任何函数都可以通过绘制输入输出对方来绘制图表。 制作一个输入和相应输出的表格有助于接近图形绘制时函数形成的形状。 图形显示的点越多,图形就越准确。 虽然这种方法耗费时间,但它是理解函数的好方法。Example
::示例示例示例示例Graph the function
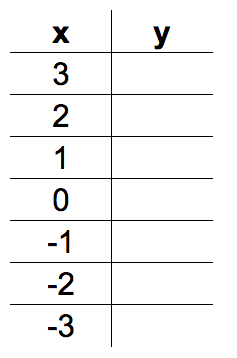
::函数 f( x) =x2 - 4x - 3Let's begin by making a two-column table and choosing input values. The input values can be any numbers that you choose. In this case, the integers from -3 to 3 are chosen. These values can be adjusted and add more values can be added if these inputs do not give a representative view of the graph.
::我们先用两列的表格来开始,然后选择输入值。输入值可以是您选择的任何数字。在此情况下,选择了 -3 至 3 的整数。这些数值可以调整,如果这些输入不代表对图形的视图,则可以添加更多的值。To find the output values, substitute the input values into the function.
::要找到输出值, 请在函数中替换输入值 。-
::f(3)=(3)2-4(3)-36 -
::f(2)=(2)2-2-4(2)-3___________________________________________________________________________________________________________________________________________________________________________________________________________________________________________________________________________________________________________________________________________________________________________________________________________________________________________________________________________________________________________________________________________________________________________________________________________________________________________________________________________________________________________________________________________________________________________________________________________________________________________________________________________________________________
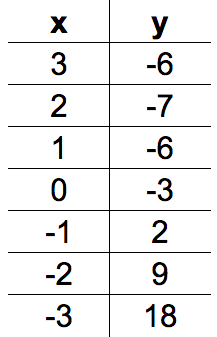
Continuing this process until the table is filled out will produce the following:
::在填写表格之前继续这一进程将产生以下结果:Notice how both the inputs 1 and 3 produce an output value of -6. These repeat outputs happen in quadratic functions because of the symmetric nature of a parabola caused by the degree of 2. The coordinate about which the points are symmetric is the vertex. The axis of will run through the vertex and can be written using the linear equation Plotting these values will help to understand how the graph of the function will look.
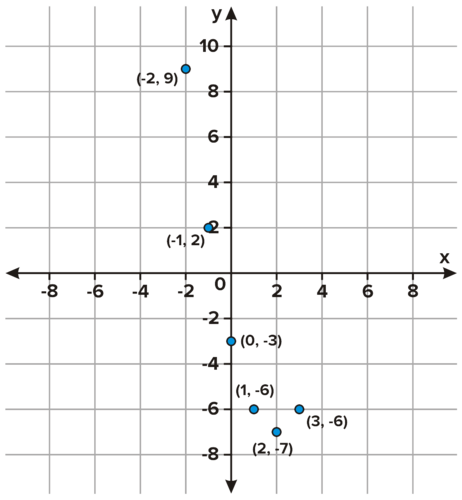
::注意输入 1 和 3 如何产生输出值 - 6. 这些重复输出在二次函数中发生, 这是因为参数2 的程度导致对称性。 坐标(2, - 7) 是点对称的坐标, 是顶点。 轴将穿过顶点, 可以用线性方程 y= 2 写入 。 绘制这些值将有助于理解函数图形的外观 。C onsider plotting the input values 4, 5, and 6 to get a more representative graph. Fitting a parabola to the points above w ill display what the function will look like when graphed.
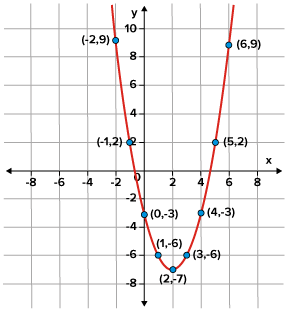
::考虑绘制输入值 4 、 5 和 6 以获得一个更具代表性的图表。 将抛物线与以上点相匹配将显示函数 f( x) =x2 - 4x- 3 的像值。Answer:
::答复:Answer the questions below to practice graphing quadratic functions.
::回答以下关于绘制二次函数图的问题。
Activity 3: Rate of Change Continued
::活动3:持续变化率In the introduction, it was stated that the average rate of change of a linear function is constant.
::在导言中,有人说线性函数的平均变化率是不变的。T he introduction displayed, how this is not the case for quadratic functions.
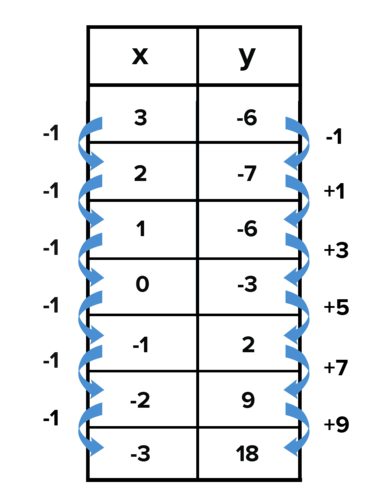
::所显示的引言, 二次函数的情况并非如此 。Notice that the differences in the y-values are linear. Although the y-values do not increase at a constant rate, the differences between y-values increase at a constant rate. T he rate at which the differences between y-values increase is called the second difference .
::注意 Y 值的差异是线性的。 Y 值虽然不是以恒定速率增长,但y 值之间的差异以恒定速率增长。 y 值差异增加的速率被称为第二个差。The second difference directly ties into the introduction because it is the rate at which the function is "accelerating". Additionally, notice how half the second difference is the same as the value of the a- coefficient . This relationship is no coincidence. Recall from the introduction that the formula for the distance traveled by an accelerating object was derived as the following:
::第二个差异与导言直接相关,因为它是函数“加速”的速率。此外,请注意第二个差异的一半与系数值相同。这种关系不是巧合。从导言中回顾,加速物体所穿行距离的公式如下:
::d(t)=12加速率 = 时间 2= 12at2Since the rate of change is increasing at a constant rate, the a-value of the function will always be half the second difference of a quadratic function.
::由于变化率以恒定速率上升,该函数的值将始终是二次函数的第二差数的一半。The average rate of change between two points is the ratio of the change along the x-axis to the change along the y-axis . This is called the average rate of change, instead of the , because the graph of a quadratic function is curved and does not have a constant rate of change between any two separate points.
::两点之间的平均变化率是 X 轴变化与 y 轴变化之比。 这称为平均变化率, 而不是 。 因为二次函数的图形是曲线, 且二次函数之间没有固定的变动率 。The formula below can be used to find the average rate of change between points and
::以下公式可用于查找点(a,f(a))和点(b,f(b))之间的平均变化率。
::平均变化率=f(b)-f(a)b-aUse the interactive below to practice finding the average rate of change between two points of a quadratic function.
::使用下面的交互功能来练习如何在二次函数的两个点之间找到平均变化率。INTERACTIVEGraphing Quadratic FunctionsInput the correct average rate of change between points A and B to load another problem
::输入正确的A点和B点之间平均变化率的正确平均值,以装入另一个问题+Do you want to reset the PLIX?
Wrap-Up: Review Questions
::总结:审查问题Summary
::摘要-
A parabola is the u-shape created by the graph of a quadratic function.
::抛物线是二次函数图中生成的u-shape。 -
If the ends of a parabola are pointing up, it is considered concave up.
::如果抛物线的尾端 指向上, 它被认为是集合起来。 -
If the ends of a parabola are pointing down, it is considered concave down.
::如果抛物线的尾部向下向下,它就被认为是集合物。 -
The vertex is the
minimum
point of a
concave up
function. It is the
maximum
point of a
concave down
function.
::顶点是组合向上函数的最小点。它是组合向下函数的最大点。 -
The axis of symmetry is the line about which the values of a quadratic function are symmetric.
::对称轴是二次函数值对称的线条。 -
A quadratic function can be graphed by plotting points.
::二次函数可以通过绘图点绘制图形。
-
Understand the characteristics and structure of parabolas.