抽样
章节大纲
-
Lesson Objectives
::经验教训目标-
Use
data
from a randomized experiment to compare two treatments.
::使用随机实验的数据比较两种治疗方法。 -
Use simulations to decide if differences between parameters are significant.
::使用模拟来确定参数之间的差异是否显著。 -
Evaluate reports based on data.
::根据数据对报告进行评价。
Introduction: Musically Inclined
::一. 导言:音乐素养An image of an orchestra Stephanie is a researcher who believes that playing an instrument can positively impact a person’s intelligence. To test this, she took a simple random sample of 50 Americans that played an instrument and administered an IQ test, which she will compare to population data. The average IQ of a citizen in the United States is 98, and the average IQ of Stephanie’s sample was 103.
::Stephanie是一个研究者,他相信玩乐器可以对一个人的智力产生积极影响。 为了测试这一点,她对50名玩乐器的美国人进行了简单的随机抽样,并进行了智商测试,她将与人口数据进行比较。 美国公民的平均智商为98人, Stephanie的平均智商为103人。Discussion Question: Do you think there is a link between playing an instrument and increased intelligence? What additional information would Stephanie need to prove or disprove her sample results?
::讨论问题:你认为玩弄工具与增加情报之间有联系吗? Stephanie需要哪些额外信息来证明或否定她的样本结果?
Activity 1: The Null and Alternative Hypothesis
::活动1: " 假说和替代假设 "The example above presents a question that can be answered through hypothesis testing . One of the main uses for statistics is the testing of hypotheses. Commonly, a statement is made, such as “ A study reported that at least 7 0% of high school seniors have their driver's license ,” with a counterclaim such as, "I believe that 70% is too high." E xperiments are then conducted to determine the validity of the counterclaim. When testing the counterclaim, we want to specify in what way we believe the initial claim is wrong. Do we believe the initial claim underestimates the parameter , overestimates the parameter, or is just flat out wrong? When testing this claim , specific steps should be followed as the experiment is set up, carried out, and reviewed or reported to strengthen the validity of the results. The first step is the establishment of the null hypothesis , notated as H 0 , and the alternative hypothesis , notated as H a .
::上面的例子提出了一个可以通过假设测试解答的问题。 统计的主要用途之一是测试假设。 通常,有人发表声明,例如“ 一项研究报告说,至少70%的高中高年级学生持有驾驶执照”, 并提出了反要求, 例如“ 我认为70%太高了 ” 。 然后进行实验以确定反要求的有效性。 当测试反要求时, 我们想具体说明我们认为最初索赔错误的方式。 我们认为最初索赔低估了参数,高估了参数,还是完全错误了? 当测试这项索赔时,应该遵循具体的步骤,以建立、执行和审查或报告实验,以加强结果的有效性。 第一步是确定无效假设,不称为H0, 而替代假设则称为Ha。The null hypothesis , H 0 , is the assumption that the re is not a significant difference between the variables being tested . The variables refer to the measured characteristics of the populations defined by the null hypothesis and the alternative hypothesis . In the claim above, the null hypothesis would be, “The probability of a high school senior having their driver's license is at least 70%.” We are assuming that this initial claim is true as initially reported. The null hypothesis is often referred to as the “no-change” hypothesis and i s the default conclusion. This hypothesis can be written using the notation H 0 : p ≥ 0.7 , where p stands for the population proportion .
::无效假设H0是假设所测试的变量之间没有重大差别。变量指的是无效假设和替代假设所定义的人口的测算特征。在以上索赔中,无效假设是:“高中毕业生拥有驾驶执照的概率至少为70%。” 我们假设最初报告的这一初始索赔属实。无效假设通常被称为“不变”假设,是默认结论。这一假设可以用P代表人口比例的H0:p0.7的注H0:p0.7来写。The alternative hypothesis , H a , is the proposition that there is a significant difference between the variables being tested. This is what we are trying to demonstrate through conducting the hypothesis test . In the example above , the hypothesis could be: “The probability of a high school s enior having their driver's license is less than 70%.” We can write this hypothesis using the notation H a : p < 0.7 , where p stands for the population proportion. We are comparing two populations: the population reflected by the sample with an assumed proportion of less than 0.7 and the assumed proportion of at least 0.7 from the null hypothesis. The alternative hypothesis and null hypothesis must be mutually exclusive, meaning that if one is true, the other must be false.
::另一种假设,Ha,是认为正在测试的变量之间差别很大。这就是我们试图通过进行假设测试来证明的。在以上的例子中,假设可能是:“高中毕业生的驾驶执照可能低于70%。” 我们可以用Ha:p < 0.7来写这个假设,P代表人口比例。我们正在比较两种人口:样本中反映的人口假定比例小于0.7,而假设比例至少为0.7。替代假设和否定假设必须是相互排斥的,这意味着如果一个是真实的,另一个必须是虚假的。Example
::示例示例示例示例A researcher wants to test the claim that 8 out of 10 dogs prefer the taste of Paws Puppy Chow, with the belief that this claim is too high. What are the null and alternative hypotheses in this scenario?
::研究者想检验每10只狗中就有8只狗喜欢Paws Pupy Phow的味道,认为这一说法太高。 假设中无效和替代的假设是什么?The researcher’s hypothesis, which is the null hypothesis, states that 80% of puppies prefer the taste of Paws Puppy Chow . The alternative hypothesis would be that fewer than 80% of puppie s prefer the taste of Paws Puppy Chow .
::研究者的假设 — — 即无效假设 — — 指出80%的小狗更喜欢Paws Pupy Pow。 另一种假设是不到80%的小狗更喜欢Paws Pupy Puppy Pow。Answer: H 0 : p = 0.8 and H a : p < 0.8.
::答复:H0:p=0.8和Ha:p<0.8。Example
::示例示例示例示例A study claims the average driver gets in 4 car accidents during their lifetime. You believe this claim to be false. What are the null and alternative hypotheses in this scenario?
::一份研究报告声称,平均驾驶员一生中遭遇4起汽车事故。你认为这一说法是虚假的。在这种假设中,什么是无效的和替代的假设?In this situation, an exact claim is made. The null hypothesis should assume that the mean number of accidents in the average person’s lifetime is exactly 4. In this case, we are dealing with a mean and not a proportion, so we will use μ to represent the mean number of car accidents instead of p . The population mean of the null hypothesis is equal to 4. Since the alternative hypothesis will claim the opposite of the null hypothesis, the alternative hypothesis should state that the population mean of the null hypothesis is not equal to 4.
::在这种情况下,可以提出确切的索赔要求。无效假设应假定平均人一生中平均事故次数完全为4。 在这种情况下,我们处理的是平均而不是比例,因此我们将使用微值代表平均汽车事故次数,而不是p。 无效假设的人口平均数等于4。 由于替代假设将提出与无效假设相反的要求,替代假设应说明,无效假设的人口平均数不等于4。Answer: H 0 : μ = 4 and H a : μ ≠ 4.
::答复:H0:__________________________________________________________________________________________________________________________________________________________________________________________________________________________________________________________________________Use the interactive below to practice identifying null and alternative hypotheses.
::使用以下互动方式来实践确定无效和替代假设的做法。Discussion Question: How would you write a null and alternative hypothesis for the following scenario: More people like cereal X than cereal Y.
::讨论问题:你将如何为下列情况写出一个无效的和替代性的假设:更多的人喜欢谷类X,而不是谷类Y。
Activity 2: Setting the Criteria
::活动2:制定标准The next step, before any sample data is taken, is to determine the criteria that would be sufficient to disprove the null hypothesis. Would it take a significantly high value, a significantly low value, or an extreme value in any direction? It will be the z scores and their resulting tails that mark these extremes that define the division between the null and alternative hypotheses.
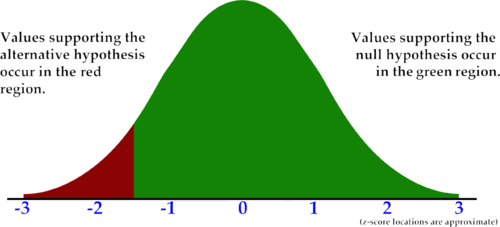
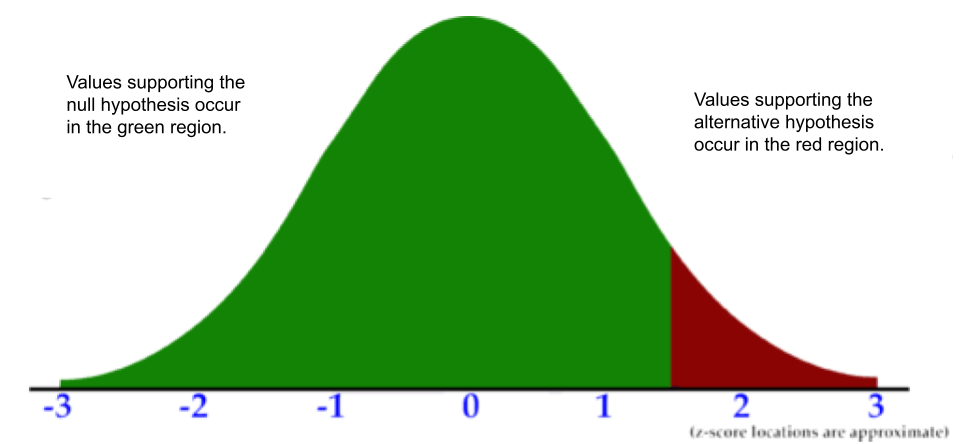
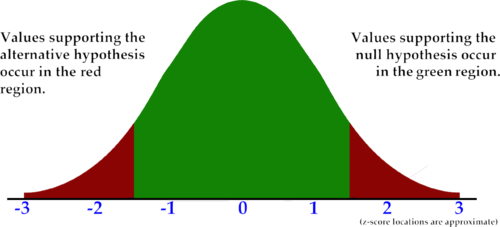
::下一个步骤是,在采集任何样本数据之前,确定足以推翻无效假设的标准。 是否需要相当高的价值、非常低的价值或任何方向的极端价值? 划上这些极端的Z分数及其产生的尾巴将决定无效假设和替代假设之间的区别。In the graphs below, the rejection region is in red, and the rest of the distribution is in green. A value in the rejection region indicates that the null hypothesis should be rejected.
::在下图中,拒绝区域是红色的,其余分布是绿色的。 拒绝区域的一个数值表明应该拒绝无效假设。If a significantly small sample mean or proportion is required to reject the null hypothesis, the test is referred to as left-tailed. A left-tailed test only has a rejection region tail on the left side of the graph. For example: "More than 88% of voters in Colorado are expected to vote for the incumbent as Governor. We want to conduct a hypothesis test to determine if this proportion is too high." It would take a sample with a proportion considered significantly lower than 88% to disprove the null hypothesis.
::如果拒绝无效假设需要很小的样本平均值或比例,则试验称为左尾,左尾试验仅图左侧有一个拒绝区尾尾。例如:“预计科罗拉多州超过88%的选民将投票支持现任总督。我们要进行假设测试,以确定这个比例是否太高。” 要推翻无效假设,要用一个比例大大低于88%的样本来证明这个比例是否过高。H 0 : p ≥ 0.88 and H A : p < 0.88
::H0:p0.88和HA:p<0.88If a significantly large sample mean or proportion is required to reject the null hypothesis, the test is referred to as right-tailed. A right-tailed test only has a critical region tail on the right side of the graph. For example: "Fewer than 56 out of every 1,000 people prefer cabbage to pizza. We want to conduct a hypothesis test with the belief that the proportion is greater than reported." It would take a sample with a proportion considered significantly greater than 5.6% to disprove the null hypothesis.
::如果拒绝无效假设需要大得多的样本平均值或比例,则试验称为右尾切换。右尾切仅图右侧有一个关键区域尾巴。例如:“每1 000人中有56人比披萨更喜欢卷心菜。我们想进行假设测试,认为比例大于报告的比例。” 将采用比例大大高于5.6%的样本来反驳无效假设。H 0 : p < 0.056 and H A : p ≥ 0.056
::H0:p<0.056和HA:p0.056If either a significantly small or significantly large statistic is required to reject the null hypothesis, the test is referred to as two-tailed. This type of test is used in situations where the null hypothesis is equal to a number. A two-tailed test has critical region tails on both ends of the graph. A two-tailed test is a test that attempts to disprove a claim that a specific value is not true in either direction. For example: "A magazine article claims that the unemployment rate in the U.S. is 3.6%. We suspect that this proportion is false." It would take a sample with a proportion considered significantly greater or smaller than 3.6% to disprove the null hypothesis.
::如果拒绝无效假设需要极小或大得多的统计数字,则试验称为双尾试验。这种试验在无效假设等于数字的情况下使用。双尾试验在图形两端都有关键的区域尾部。双尾试验是试图否定关于某一具体价值在任一方向都不真实的说法的检验。例如:“杂志文章声称美国的失业率为3.6%。我们怀疑这一比例是虚假的。” 它将用一个比例明显大于或小于3.6%的样本来推翻无效假设。H 0 : x = 0.036 and H A : x ≠ 0.036.
::H0:x=0.036和HA:x=0.036。Use the interactive below to explore the idea of right-tailed, left-tailed, and 2-tailed tests further.
::利用下面的交互性来进一步探讨右尾、左尾和双尾测试的想法。Once we identify the tails of the sampling distribution required to reject the null hypothesis, it is important to put a number on that region. If the null hypothesis is true, further testing should produce expected results based on a sample distribution of the proposed parameter. It is possible for the mean or proportion of a sample to be an extreme value. However, the more extreme the sample mean or proportion, the less likely it is to obtain. How extreme must the newer samples be to convince you that the proposed parameter is incorrect? Should they be in the top 10% of sample means, the top 5%, or the top 1%?
::一旦我们确定了拒绝无效假设所需的抽样分布的尾巴, 就必须在这一地区设置一个数字。 如果无效假设是真实的, 进一步的测试应该根据拟议参数的样本分布产生预期结果。 样本的平均值或比例有可能是一个极端值。 但是, 样本的平均值或比例越极端, 获取的可能性就越小。 更新的样本必须多么极端才能说服你拟议的参数不正确? 它们是在样本的前10%中, 最高5%, 还是最高1%?The value used to define the strength of evidence required to reject the null hypothesis is known as the significance level , denoted by 𝛼. Normally a sample is considered sufficient to reject the null hypothesis if there is at most a 5% chance of obtaining the statistic. However, this can vary based on the situation. In a left-tailed test, the significance level is the bottom proportion of sample means required to reject the null hypothesis. In a right-tailed test, the significance level is the top proportion of sample means required to reject the null hypothesis.
::用来确定拒绝无效假设所需证据的强度的数值被称为重要程度,由α表示。通常,如果获得统计数据的可能性最多为5%,样本就被认为足以拒绝无效假设。但是,根据情况,这可以有所不同。在左尾试验中,重要程度是拒绝无效假设所需的样本手段的底部比例。在右尾试验中,重要程度是拒绝无效假设所需的样本手段的顶部比例。While in many textbook situations, the level of significance may be given to you, when conducting a hypothesis test, you should choose the level of significance. The level of significance should always be chosen before any testing and sampling are done.
::虽然在许多教科书中,在进行假设测试时,可能会给予你重要程度,但您应该选择重要程度,在进行任何测试和取样之前,应当始终选择重要程度。Example
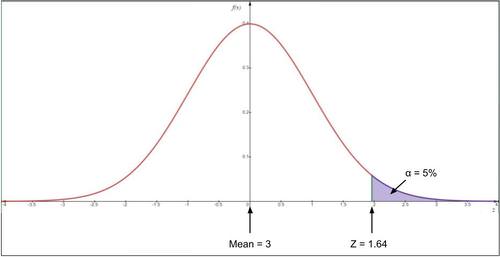
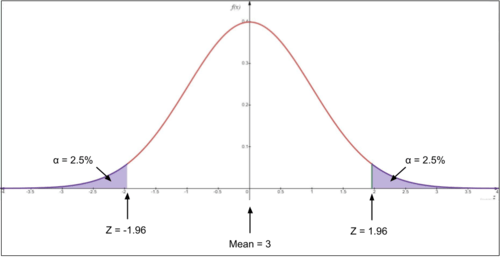
::示例示例示例示例A package delivery company claims a mean delivery time of at most 3 days. You suspect that they take longer. Construct the sample distribution of the null hypothesis, including the tail(s) with a 0.05 level of significance.
::包件交货公司声称平均交货时间最多为3天。 您怀疑它们需要更长的时间。 构造无效假设的样本分布, 包括具有0.05级意义的尾巴 。The null hypothesis is the claim of the company that the mean delivery time is at most 3 days, H 0 : x ̄ ≤ 3. The alternative hypothesis is that the mean delivery time is more than 3 days, H a : x ̄ > 3. Since the null hypothesis states that the mean delivery time is 3 days or less, we are looking to see if the delivery time is greater than 3 days. The side of the distribution that is greater than the believed population mean of 3 is the right side. Thus this is a right-tailed test. Additionally, since the significance level is 0.05, we will need to obtain a sample mean in the top 5% of the distribution to reject the mean. The top 5% of the sample means will be considered “rare enough” not to be the product of sampling variability.
::无效假设是该公司声称平均交货时间最多为3天,H0:x3。 替代假设是平均交货时间超过3天,Ha:x3。 由于无效假设规定平均交货时间为3天或更短,我们想看看交货时间是否超过3天。比3岁人口平均数高的分布方是右侧。因此这是一个直接的测试。此外,由于意义是0.05,我们需要在分发量的前5 % 中获得样本平均值以拒绝平均值。 最前5 % 的抽样手段将被视为“足够”而不是抽样变异的产物。Answer:
::答复:In a two-tailed test, the significance level represents the outer proportion of sample means required to reject the null hypothesis. A two-tailed test splits the significance level in half, requiring a sample mean or proportion in either the top 𝛼/2 or the bottom 𝛼/2 to reject the null hypothesis.
::在双尾试验中,意义水平代表了拒绝无效假设所需的样本手段的外部比例。 双尾试验将意义水平分成一半,要求上方α/2或下方α/2的样本平均值或比例拒绝无效假设。
Activity 4: Forming a Conclusion
::活动4:形成结论Once the null hypothesis, alternative hypothesis, tails, and significance level are chosen, you are ready to collect data and form a conclusion. Based on the sample distribution of the data, you will either reject the null hypothesis or fail to reject the null hypothesis. To reject the null hypothesis means that the sample mean is so rare, as defined by the significance level, that it makes you doubt that the sample mean was obtained from the population. This result could imply that either there are two different populations or that the original population claim was incorrect. To fail to reject the null hypothesis means that the sample mean obtain is not rare, as defined by the significance level, and could be explained by the variability of the sample distribution. In this case, you don’t have enough evidence to claim that the null hypothesis is false; thus, we will continue to accept it as true.
::一旦选择了无效假设、替代假设、尾巴和意义等级,您就准备收集数据并得出结论。 根据数据样本分布,您要么拒绝无效假设,要么拒绝无效假设。如果拒绝无效假设,意味着根据意义等级定义的样本平均值非常罕见,从而让你怀疑样本平均值是从人群中获取的。这一结果可能意味着有两种不同的人口,或者最初的人口要求是不正确的。如果不拒绝无效假设,则意味着按意义等级定义的样本获取平均值并不罕见,并且可以用样本分布的变异性来解释。 在这种情况下,您没有足够的证据证明无效假设是虚假的;因此,我们将继续接受无效假设的真实性。In this section, we will use a simulation to model the sample distribution. Let’s return to the example in the introduction.
::在本节中,我们将使用模拟来模拟样本分布。 让我们回到引言中的例子。Example
::示例示例示例示例Stephanie is a researcher who believes that playing an instrument can positively impact a person’s intelligence. To test this belief, she took a simple random sample of 50 Americans that played an instrument and administered an IQ test, which she will compare to population data. The average IQ of an American citizen is 98, and the average IQ of Stephanie’s sample was 103. Given a sample distribution, conduct a hypothesis test at a 0.05 level of significance.
::Stephanie是一位研究者,他相信玩乐器可以对一个人的智力产生积极影响。 为了测试这一信念,她对50名玩乐器的美国人进行了简单的随机抽样,并进行了智商测试,她将与人口数据进行比较。 美国公民的平均智商为98, Stephanie的样本平均智商为103。 抽样分布显示,她进行了0.05级的假设测试,其意义是有意义的。Our null hypothesis will assume that there is no link between playing an instrument and intelligence. This is because Stephanie wants to show that the population she is focusing on diverges from the normal population. It is important when comparing treatments that you first rule out the connection being the result of sampling variability. In other words, the sample results should suggest no change in intelligence or H 0 : x ̄ ≠ 98. The alternative hypothesis is that a sample of people who play an instrument will not have a typical average IQ or H a : x ̄ = 98. Although Stephanie suspects the IQ of the sample group will be higher, that implies causality, which requires further testing.
::我们的空虚假设将假定玩乐器和智能之间没有任何联系。 这是因为 Stephanie想要显示她所关注的人口与正常人口的差异。 在比较治疗方法时,你必须先排除因抽样变异而产生的关联。 换句话说, 抽样结果应该表明情报或H0:x98没有变化。 另一种假设是, 玩乐器的抽样人不会有典型的平均IQ或Ha:x98。 尽管 Stephanie怀疑样本组的智商会更高, 这意味着因果关系, 需要进一步测试。Next, we must establish the tails of the distribution and the significance level. Since Stephanie is looking to disprove that there is no link between playing an instrument and intelligence, we will look for the sample mean to take an extreme value on either side of the population mean. The distribution will be Two-tailed. Additionally, the significance level is 𝛼 = 0.05. This means that if the sample mean is in the top 2.5% of sample means or bottom 2.5% of sample means in the population sample distribution, we can reject the null hypothesis that playing an instrument has no link to intelligence.
::接下来,我们必须确定分布的尾部和重要性。 Stephanie正试图证明玩乐器与智能之间没有联系,因此我们将寻找样本意味着在人口两侧都具有极端价值。 分布将是双尾的。 此外, 意义水平是 α = 0.05。 这意味着, 如果样本平均值位于抽样手段的顶端2.5%或样本的底部2.5%意味着人口抽样分布, 我们可以拒绝关于玩乐器与情报没有联系的无效假设。Below is a histogram displaying a simulation of 1000 trials with a sample size of 50. This histogram represents the sample distribution for the IQ score sample means. Use the interactive to see where the sample IQ score of 103 fits into the sample distribution. If the sample mean falls in the top 2.5% or bottom 2.5% of the sample means, we will reject the null hypothesis that there is no link between playing an instrument and intelligence. If the sample mean falls below the top 5% of the sample means, we will fail to reject the null hypothesis that negative to no link between playing an instrument and intelligence. Use the simulation below to help make our conclusion.
::下面是一个直方图, 模拟了1000个试验, 样本大小为50。 这个直方图代表了 IQ 评分样本的样本分布 。 使用互动来查看103 个IQ 评分在样本分布中的位置 。 如果样本意味着在样本的上半部下降2.5%或下半部下降, 我们将拒绝关于玩耍仪器与智能之间没有关联的无效假设 。 如果样本平均值在样本的上5%以下, 我们将不会拒绝关于玩乐器与智能之间没有联系的无效假设 。 使用以下的模拟来帮助我们得出结论 。Discussion Questions:
::讨论问题:-
Is it possible our conclusion could be incorrect? How often might we make this mistake?
::我们的结论有可能不正确吗?我们多久犯一次这样的错误? -
Assuming that the alternative hypothesis is true, can we conclude that playing an instrument will, on average, result in an increase in intelligence?
::假设替代假设是真实的,我们能否得出结论,发挥工具作用将平均导致情报增加?
Activity 5: Type I and Type II Errors
::活动5:第一类和第二类错误To help understand why we use the wording “fail to reject,” consider the metaphor of the judicial system. In a criminal case, a defendant, the person being accused of committing a crime, is innocent until proven guilty. When there isn’t enough evidence to convict, we say “not guilty” instead of innocent. We are not declaring the defendant innocent we are stating that there was not enough evidence to convict the defendant of the accused crime. This concept is referred to as the burden of proof. The burden of proof in a criminal case is to prove that someone is guilty beyond a reasonable doubt. The null hypothesis is true until proven false, much like the defendant is innocent until proven guilty. The burden of proof is to prove that the null hypothesis is false “beyond a reasonable doubt.” The reasonable doubt is defined as the significance level chosen by the tester.
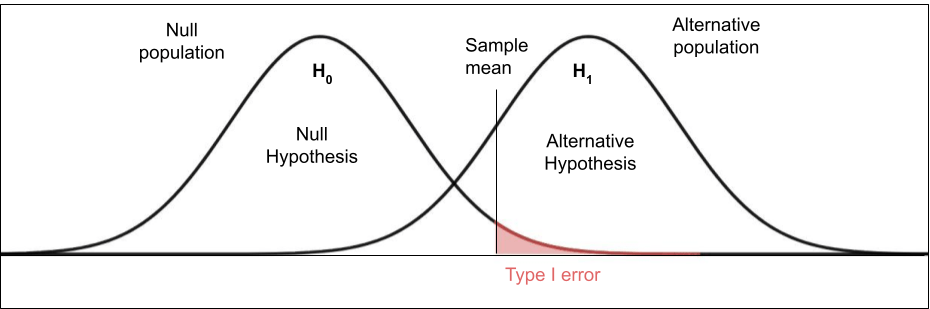
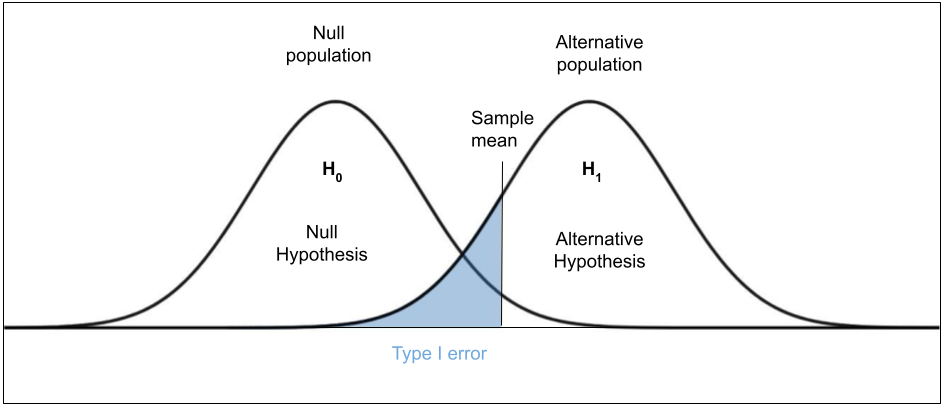
::为了帮助理解我们为什么使用“拒绝失败”的词句,考虑司法制度的比喻。 在刑事案件中,被告(被控犯罪的人)在被证明有罪之前是无罪的。当没有足够的证据来定罪时,我们说“无罪”而不是无罪。我们不是说被告无罪,而是说没有足够的证据来判定被告有罪。这个概念被称为举证责任。在刑事案件中,举证责任是证明某人有罪,而不是合理怀疑。 无效假设在被证明有罪之前是真实的,就像被告在被证明有罪之前是无罪的一样。 举证责任是证明无效假设是虚假的“超越合理怀疑 ” 。 合理怀疑被定义为测试者所选择的重要程度。The idea of innocent until proven guilty dates back to the late 1700s. The English judge William Blackstone stated, “It is better that ten guilty escape than one innocent suffer.” This quote pinpoints the belief that the effects of a false positive are more harmful than the effects of a false negative. We refer to false positives and false negatives as type 1 and type II errors, respectively.
::在被证明有罪之前的无罪概念可追溯到1700年代末期。 英国法官威廉·布莱克斯通(William Blackstone)说 , “ 比一个无辜者受罪好10人越狱。 ”这句引文明确指出,假阳性的效果比假阴性的效果更有害。 我们分别将假正反和假反差称为第1类和第二类错误。Null hypothesis is true Null hypothesis is false Reject null hypothesis Type 1 Error (False positive)
::类型 1 错误( 偏偏正)Correct (True positive) Fail to reject null hypothesis Correct (True negative) Type II Error (False negative) A type I error occurs when we reject the null hypothesis, but it is true. Type I errors happen as the result of normal variability in the sample distribution. Recall that if we choose a significance level of 0.05, a sample mean in the top 5% of the sample distribution will be considered rare enough to reject the null hypothesis. However, even though a mean in the top 5% is unlikely, it is still going to happen 5% of the time, or 1 out of every 20 samples, even if the null hypothesis isn’t false. The likelihood of a type I error is equal to the significance level. It is important to set a low significance level of 1% or below when doing high-stakes testing like medical testing.
::当我们拒绝无效假设时,就会出现一种类型I错误,但这是事实。类型I错误会发生于样本分布的正常变异。回顾如果我们选择了0.05的临界值,那么在样本分布的前5 % 中,一个样本平均值将被视为稀有,足以拒绝无效假设。 然而,即使顶5 % 的平均值不太可能,但它仍然会发生5%的时间,或者每20个样本中就有1个,即使无效假设并不是假的。 类型I错误的可能性与临界值相等。 重要的是,在进行像医学测试那样的高测试时,将低值水平设定为1 % 或低于1 % 。A type II error occurs when we don’t have enough evidence to reject the null hypothesis, but it is indeed false. Type II errors happen when the populations being compared are indeed different, but we obtain a rare sample from the alternative population that overlaps the normal range of the believed null population. The likelihood of this happening fluctuates based on the distance between the null population and the alternative population.
::当我们没有足够的证据来拒绝无效假设时,就会出现第二类错误。 第二类错误发生时,被比较的人口确实不同,但我们从与被认为的无效人口的正常范围相重叠的替代人口中获得了罕见的样本。 发生这种情况的可能性取决于无效人口与替代人口之间的距离。Use the interactive below to explore type I and type II errors further.
::使用以下互动方式进一步探讨第一类和第二类错误。Summary -
The
null hypothesis
,
H
0
,
is the assumption that there is not a significant difference between the variables being tested.
::无效假设H0假定测试的变量之间没有重大差别。 -
The
alternative hypothesis
,
H
a
,
is the proposition that there is a significant difference between the variables being tested.
::替代假设Ha提出,所测试的变量之间有很大差异。 -
The
significance level
,
α
,
is the value used to define the strength of evidence required to reject the null hypothesis.
::重要程度(α)是用来确定拒绝无效假设所需证据的强度的价值。 -
A
type I error
occurs when we reject the null hypothesis, but it is true. Also known as a false positive.
::当我们拒绝无效假设时, 会出现类型I 错误, 但这是真的。 也被称为假正数 。 -
A
type II error
occurs when we don’t have enough evidence to reject the null hypothesis, but it is indeed false. Also known as a false negative.
::当我们没有足够的证据来拒绝无效假设时,就会发生第二类错误,但这种错误确实是虚假的。 也被称为虚假的否定。
Wrap-Up: Review Questions
::总结:审查问题 -
Use
data
from a randomized experiment to compare two treatments.