符合数据线
章节大纲
-
Fitting a Line to Data
::符合数据线The scatter plot pictured below, previously shown in , compares engine size with efficiency.
::下面的散射图图图(先前显示在...)将引擎大小与效率进行比较。This graph has a negative trend, implying that the larger the engine, the less efficient.
::该图呈负趋势,意味着发动机越大,效率就越低。Progress0 / 11.If we were asked to predict the mileage of a car with a 2-liter engine, what could we say?
::如果有人要求我们预测一辆车的里程数 加上两升引擎,我们还能说什么呢?Select all that applyaThe best mpg recorded is 39.
::记录最佳的mpg为39。bCars with a 2-liter engine are not fast.
::两升引擎的汽车不快cThe least mpg recorded is 21
::记录最少的mpg为21dThere are many answers to "what is the mileage of a car with a 2-liter engine".
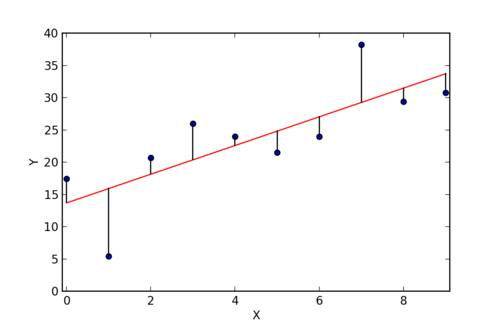
::有许多答案是,“用二升引擎的汽车里程是多少”。This is where fitting a straight line to the data can be helpful. The scatter plot below displays the same information with a trend line. Straight lines are widely used to model relationships between variables.
::这是将一条直线与数据相匹配可以有所帮助的地方。 下面的散射图用一条趋势线显示相同的信息。 直线被广泛用来建模变量之间的关系 。The line allows us to more easily interpret the rate of change in the relationship between the variables. Additionally, we can look at the line as a starting point when predicting outcomes.
::这条线让我们更容易解释变量之间关系的变化速度。 此外,我们可以将这条线作为预测结果的起点。
Line of Best Fit
::最佳适用线A line of best fit is a straight line drawn through the center of the data points on a scatter plot.
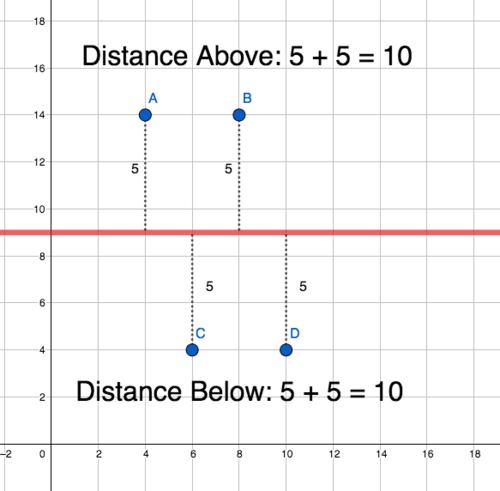
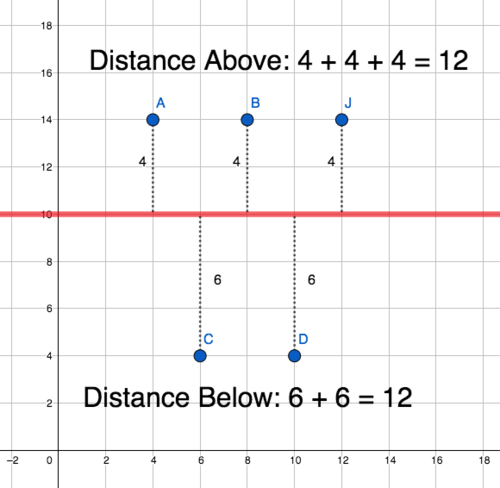
::最适合的线是一条直线,通过散射图数据点的中心线。If you total the distance from a line of best fit to all the points above it, and subtracted the total distance from the line to all the points below it, you'd get zero.
::如果您将最合适线的距离加到它上方的所有点上, 并减去从线的总距离到它下方的所有点上, 你会得到零。Another way to say this is that the sum of the vertical distances from all the points on the graph to the line must be the same on both sides of the line. Additionally, the line of best fit will have the minimum possible distance to the data points.
::另一种说法是,从图表上的所有点到线的垂直距离总和必须是线两侧相同的。 此外,最合适的线将具有与数据点之间的尽可能小的距离。Adding points will affect the location of the line, moving it closer to the side with more points.
::添加点将影响线条的位置, 以更多点移动到侧端 。In general, we want there to be about an equal number of points on either side of the line.
::总的来说,我们希望这条线两边的点数大致相等。Use the interactive below to construct a line that best fits the data.
::使用下面的交互式线条构建一条最适合数据的线条。INTERACTIVEFitting a Line to the Data-
Drag the red points to construct a line that best fits the data.
::拖曳红色点以构建最符合数据的线条 。 -
Press the white buttons to check your answer and randomize a new data set.
::按白色按钮检查您的回答,并随机设置新的数据集。
+Do you want to reset the PLIX?Discussion Question
::讨论问题Manny says, "It doesn't matter if a line of best fit is perfect because it's not going to match the data anyway. As long as you are close it's fine." Do you agree or disagree with Manny? Support your argument with evidence.
::曼尼说,“最合适的一行是否完美并不重要,因为它无论如何都不符合数据。只要你接近,它就很好。”你同意或不同意曼尼的意见?用证据支持你的论点。
Baseball Analytics Revisited
::重新审视的基球分析分析Now that you know how to construct a line to best fit a linear pattern , examine a real-world situation. In the previous chapter, you saw how analytics have been changing the landscape of sports over the past few decades. Baseball has been chief among these sports with analytics impacting decisions on and off the field. Salary is an important factor general managers have to consider before signing a player. They need to be able to project how salaries will change overtime to make sure they have enough money to sign all the players that they want. In the interactive, you will play the role of a general manager. Construct a line of best fit for the scatter plot which shows how the average player salary has changed over time.
::现在你知道如何构建一条最符合线性模式的线条, 检查现实世界的情况。 在前一章中, 您看到分析在过去几十年里是如何改变运动风景的。 棒球是这些运动中最主要的, 其分析影响着球场内外的决策。 薪金是总经理在签署一个玩家之前必须考虑的一个重要因素 。 他们需要能够预测工资如何改变加班时间, 以确保他们有足够的钱来签署他们想要的所有玩家。 在互动中, 您将扮演一个总经理的角色 。 构建一条最适合分布区的最佳线, 显示平均玩家工资如何随时间变化 。INTERACTIVEFitting Baseball Data-
Drag the red points to construct a line that best fits baseball players' salary data.
::拖动红点以构建一条最符合棒球运动员工资数据的线。 -
Press the white button when it appears to check your answer.
::当检查您的回答时, 按下白色按钮 。
+Do you want to reset the PLIX?Discussion Question
::讨论问题What challenges does constructing a line of best fit by hand present? Are those same challenges presented when using computer software? Which do you prefer and what advantages does your choice present?
::如何用手来构筑一条最合适的线?在使用计算机软件时,是否也提出了同样的挑战?你更喜欢什么,你的选择有什么好处?
Outliers
::外部线Creating a line to represent the points in a scatter plot is very common across a wide range of professions. However, what if there are some points that don’t follow the trend? These points are called outliers. An outlier is a point that distinctly differs from the rest of the data points. It is important to understand what caused an outlier to occur. Look at the scatter plot below which displays the total number of strikeouts over the history of professional baseball, do you see any outliers?
::创建一条线以代表散射图中的各个点在广泛的职业中非常常见。 但是, 如果有些点没有跟上趋势, 则会如何? 这些点被称为外部点。 外部点是一个与其它数据点截然不同的点。 重要的是要理解是什么导致了外部点的出现。 看看下面的散射图显示专业棒球历史中罢工的总数, 你是否看到任何外部点?The points representing the years 1884 and 1981 are the biggest outliers. The year 1884 was one of the greatest seasons for pitchers in Major League Baseball history. The pitchers, by all accounts, simply had a great season. In the year 1981, only half the season was played because of a labor strike.
::代表1884年和1981年的分数是最大的离线。 1884年是大联盟棒球史上最大的投手赛季之一。 投手队的赛季都非常棒。 1981年,只有一半的赛季是因罢工而起的。Discussion Question
::讨论问题Which of these points do you think we could omit from the graph: neither, 1884, 1981, or both?
::你认为我们可以从图表中省略其中哪些点:1884年、1981年或两者兼而有之?Use the interactive below to examine the effect an outlier has on a line of best fit based on distance and the number of values.
::利用下面的交互效果来检查外线根据距离和数值数量在最合适线上的效果。INTERACTIVEOutliers and Line of Best Fit-
Drag the red point up and down to move the outlier.
::向上或向下拖动红色点以移动外端。 -
Click the blue points to include or remove them from the data set.
::单击蓝色点以从数据集中包括或删除它们。
+Do you want to reset the PLIX?Summary
::摘要-
A
line of best fit
is a straight line that represents the data on a
scatter plot
.
::最合适的直线是直线,代表散射图上的数据。 -
An
outlier
is a point that distinctly differs from the rest of the data points.
::外部线是一个与数据点其他部分明显不同的点。
-
Drag the red points to construct a line that best fits the data.