线性不平等
Section outline
-
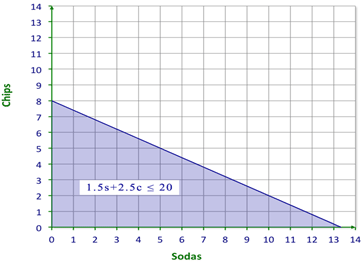
You are invited to a party and asked to bring chips and dips. Chips cost $2.50 a bag and a soda costs $1.50. If you only have $20.00 to spend, how many of each can you buy?
::薯片每袋2.50美元,苏打水1美元1.50美元。如果你只有20美元可以花,你每人能买多少?In this concept, you will learn to graph linear inequalities.
::在此概念中,您将学会绘制线性不平等的图表。Graphing Linear Inequalities
::线性不平等The solutions to an inequality can be listed as ordered pairs. However, listing the ordered pairs would take a long time. Another way to represent the solution to an inequality is by graphing it on a number line. If the symbol shown in the inequality is or < the endpoint is displayed using an open circle (an outline of a circle) since that value is not included in the solution. When the symbol shown in the inequality is or the endpoint is displayed using a closed circle since that value is included in the solution.
::不平等的解决方案可以作为定购配对列出。 但是, 列出定购配对需要很长的时间。 代表不平等的解决方案的另一种方式是用数字行绘制图形。 如果不平等中显示的符号是 > 或 < 端点是使用开放圆( 圆的大纲) 显示的, 因为该值没有包括在解决方案中。 当不平等中显示的符号是 或 时, 端点是使用封闭圆显示的, 因为该值包含在解决方案中 。Let’s look at an example.
::让我们举个例子。Show the solution set for the given inequality on a number line,
::在数字行中显示给定不平等的解决方案,
::x <2First, draw a number line that shows numbers that are less than 2. Since 2 is the endpoint, 2 must be shown on the number line. It is a good idea to show at least one number to the right of the endpoint to create a clearer picture of the solution.
::首先, 绘制一个数字线, 显示数字小于 2 。 因为 2 是终点, 2 必须显示在数字线上 。 在终点右侧至少显示一个数字, 以便更清晰地了解解决方案, 是一个好主意 。Next, mark the endpoint of 2 using an open circle.
::下一步,使用开放圆圈标记 2 的终点。Then, draw a line to the left with an arrow on the end to indicate the direction of the values in the solution set. The following diagram is the number line graph that models the given inequality:
::然后,在左边画一条向左的线,在结尾处画一条箭头,以显示解决方案集中的数值方向。下图是模拟给定不平等的数字线图:
::x <2This is only one method of visually displaying the solution set of an inequality and is used most often when the inequality consists of a single variable .
::这只是视觉显示一套不平等解决办法的一种方法,当不平等由单一变量组成时,最经常使用这种方法。A linear inequality that has two variables can be plotted on a Cartesian grid the same way a linear equation can be plotted. The inequality can be written in slope-intercept form the same way an equation can be expressed in this form. The plotted line modeling a linear inequality serves as the boundary line between the solution set and the rest of the Cartesian grid. If the inequality displays the symbol or < the boundary line will be a broken or dashed line. However, if the inequality displays the symbol or the boundary line will be a solid line.
::有两个变量的线性不平等可以像绘制线性方程式一样在笛卡尔格网格上绘制线性不平等。这种不平等可以以斜度截面形式写成,也可以以这种形式表示一个方程式。线性不平等的绘图性线性线性线性线性线性线性线性线性线性线性线性线性线性线性线性线性线性线性线性线性线性线性线性线性线性线性线性线性线性线性线性线性线性线性线性线性线性线性线性线性线性线性线性线性线性线性线性线性线性线性线性线性线性线性线性线性线性线性线性线性线性线性线性线性线性线性线性线性线性线性线性线性线性线性线性线性线性线性线性线性线性线性线性线性线性线性线性线性线性线性线性线性线性线性线性线性线性线性线性线性线性线性线性线性线性线性线性线性线性线性线性线性线性线性线性线性线性线性线性线性线性线性线性线性线性线性线性线性线性线性线性线性线性线性线性线性线性线性线性线性线性线性线性线性线性线性线性线性线性线性线性线性线性线性线性线性线性线性线性线性线性线性线性线性线性线性线性线性线性线性线性线性线性线性线性线性线性线性线性线性线性线性线性线性线性线性线性线性线性线性线性线性线性线性线性线性线性线性线性线性线性线性线性线性线性线性线性线性线性线性线性线性线性线性线性线性线性线性线性线性线性线性线性线性线性线性线性线性To determine which side of the boundary line contains the solution set, an ordered pair will be selected from one side of the line and its coordinates will be substituted into the given inequality. Do not use a point that the line passes through. If the ordered pair makes the inequality true then the side from which the point was selected will be shaded to show where the solution set is located on the graph. If the ordered pair does not make the inequality true, then the other side of the boundary line will be shaded.
::要确定边界线的哪一边包含所设定的解决方案, 定购的对将从线的一边选出, 其坐标将被替换为给定的不平等。 不要使用线经过的点 。 如果定购的对使不平等成为真实, 那么选择点所在的侧将被遮蔽, 以显示所设定的解决方案在图中的位置 。 如果定购的对不使不平等成为真实, 那么边界线的另一边将被遮蔽 。Let’s look at an example.
::让我们举个例子。Graph the solution set of the following inequality.
::绘制以下不平等的解决方案集。
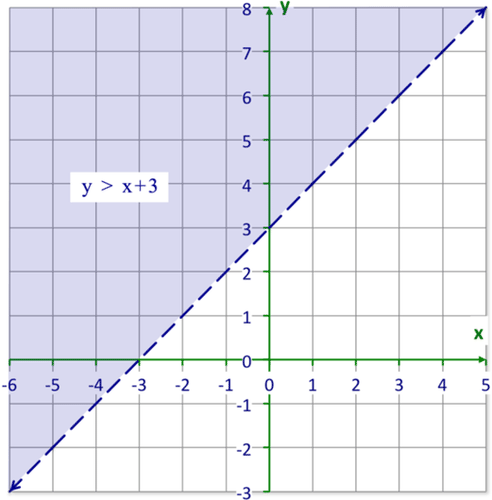
::y>x+3 y>x+3Notice the inequality is written in slope-intercept form with an inequality symbol replacing the equal sign.
::注意不平等以斜坡界面y=mx+b写成,用不平等符号代替等号。First, plot the ‘ ’ value, which is the - intercept , and from here move horizontally one to the right and up one which is the value of the ‘ ’.
::首先,绘制“b”值,即 Y 界面,然后从这里横向移动一个到右边,再向上移动一个是“m”值。Next, join the two points using a broken line since the inequality symbol is displayed.
::下一步,在显示不平等符号 > 时,使用断线加入两个点。Then, choose an ordered pair from one side of the boundary line to determine if it makes the inequality true.
::然后,从边界线一侧选择一对定购夫妇,以确定它是否使不平等成为事实。Test
::测试(1,1)
::y>x+31>1+31>4The number 1 is not greater than 4. The test point did not make the inequality true. Therefore , the other side of the boundary line must be shaded to indicate the location of the solution set.
::测试点(1,1)没有使不平等成为事实,因此,边界线的另一侧必须用阴影显示所设定的解决方案的位置。An inequality that has two variables can be plotted in this way. Remember to display the boundary line with the correct style of line (broken or solid) as indicated by the inequality symbol. Then, shade the correct side of the boundary line according to the result of the test point.
::含有两个变量的不平等可以这样绘制。 记住要用不平等符号所显示的正确的线条样式( 折叠或固态) 显示边界线。 然后根据测试点的结果将边界线的正确侧面遮蔽 。Examples
::实例Example 1
::例1Earlier, you were given a problem about your invitation to a party. You have to figure out how many bags of chips and how many bottles of soda you can buy with your $20.00.
::早些时候,有人给了你一个邀请参加派对的问题。你必须弄清楚有多少袋薯片和多少瓶苏打水,你可以用$20.00买到。You can figure this out by writing an inequality to model the information given in the story.
::你可以写一个不平等的字 来模拟故事中的信息 来解决这个问题。First, write down what you know from the given information.
::首先,写下你所知道的信息。A bag of chips costs $2.50 and a bottle of soda costs $1.50. The number of bags of chips you buy and the number of bottles of sodas must be less than or equal to $20.00.
::一袋薯片的费用为2.50美元,一瓶苏打水的费用为1.50美元。 你购买的薯片袋数和一瓶苏打水的数量必须少于或等于20美元。Next, name the variables for the inequality.
::接下来,列出不平等的变量。Let ‘ ’ = the number of bags of chips
::让 'c ' =薯片袋数Let ‘ ’ = the number of sodas
::让我们 's ' =苏打水的数量Next, write the inequality using the two variables.
::接下来,用两个变量来写不平等。
::1.50s+2.50c0.00Next, test the point . Substitute and into the given inequality and simplify.
::接下来,测试一个点(1,1),替代 x=1 和y=1 进入给定的不平等并简化。
::1.50s+2.50c20.001.50(1)+2.50(1)_20.001.50+2.5020.000.00The point makes the inequality true. The location of the test point with respect to the boundary line will be shaded.
::点(1,1) 使不平等成为真实。 测试点相对于边界线的位置将被阴影化 。Next, graph the inequality using a solid line, on a Cartesian grid.
::接下来,用一条固线,在笛卡尔语网格上绘制不平等的图表。sodas and 5 bags of chips. sodas and 4 bags of chips; and sodas and 2 bags of chips; With your $20.00 you can buy any combination of soda and chips shown in the shaded area of the graph. Some possible purchases you could make are
::苏打苏打水和5袋薯片。 (5,5,5,5-5 5苏打水和4袋薯片; 以及 (6,4)6苏打水和2袋薯片; (9,2)9,2美元9,20.00美元,你可以购买任何一种苏打水和芯片的组合,在图的阴影区域显示。你可以购买一些可能的购买品。Example 2
::例2Graph the solution set of the following inequality.
::绘制以下不平等的解决方案集。
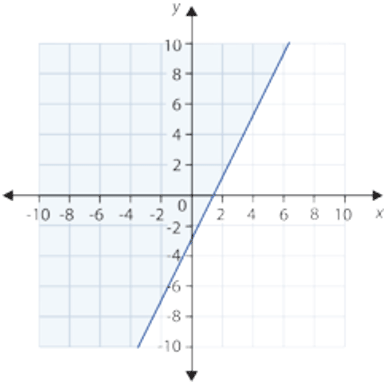
::y=2x- 3First, write down the information given by the inequality.
::首先,写下不平等所提供的信息。The -intercept of the line is and the slope of the line is 2. The boundary line will be a solid line since the inequality sign is .
::线的 Y 界面是 (0,-3) , 线的斜坡是 2 。 边界线将是一条坚固的线, 因为不平等标志是 。Next, test the point .
::接下来,测试点(1,1) 。
::y2x-312(1)-312-311The test point of makes the inequality true. Therefore, the side of the boundary line containing the test point must be shaded.
::测试点(1,1) 使不平等成为事实。 因此, 包含测试点的边界线的侧面必须阴影化 。Example 3
::例3Does the test point make the inequality true?
::测试点(1,1,1) 是否使不平等y3x-4成为真实?First, substitute and into the given inequality.
::首先,将 x=1 和y=1 替换为给定的不平等。
::y3x-41Q3(1)-4Next, simplify the right side of the inequality.
::接下来,简化不平等的右侧。The number 1 is greater than the number -1. The test point makes the inequality true.
::1号数大于1号数。 测试点显示不平等是真实的。Example 4
::例4What type of boundary line will be displayed on the graph of the inequality ?
::在 y < 23x - 5 的不平等图中将显示哪类边界线 ?The inequality symbol displayed in the given inequality is < which means the boundary line will be a dashed or broken line.
::在给定的不平等中显示的不平等符号是 < ,这意味着边界线将是一条破折或破折的线。Example 5
::例5What does the shaded area on the graph of an inequality indicate?
::不平等图中的阴影区域表示什么?The shaded area on the graph of an inequality indicates the location of the solution set for the inequality.
::不平等图中的阴影区域表示为不平等设定的解决方案的位置。Review
::回顾Write an inequality for each graph.
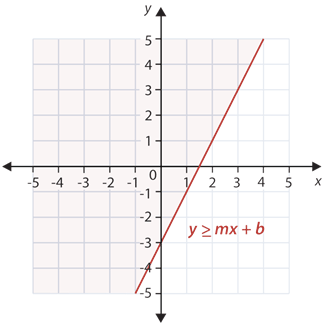
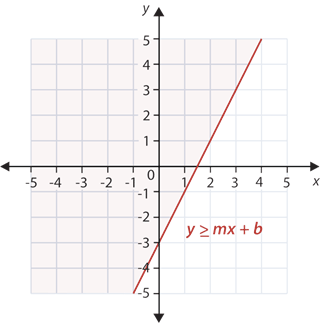
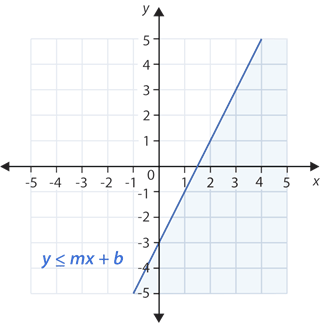
::每个图表都写一个不平等的图表。1.
2.
3.
4.
Graph the following inequalities on the coordinate plane.
::1. 3.4. 图示协调飞机上的以下不平等情况。5.
::5. y < 2x+16.
::6. y=3x-27.
::7. y12x8.
::8. y=14x+29.
::9. y2x10.
::10. y 4Answer each question true or false.
::回答每个问题是否真实或虚假。11. You can’t shade less than a vertical line.
::11. 阴影不能小于垂直线。12. A dotted line can only be used in an inequality with greater than.
::12. 虚线只能用于大于不平等的不平等。13. A dotted line is used when the inequality sign does not include an equals.
::13. 当不平等符号不包括相等符号时,则使用虚线。14. You can shade less than or greater than a horizontal line.
::14. 阴影小于或大于水平线。15. You can graph a linear inequality in two variables.
::15. 您可以用两个变量来图示线性不平等。Review (Answers)
::回顾(答复)Click to see the answer key or go to the Table of Contents and click on the Answer Key under the 'Other Versions' option.
::单击可查看答题键, 或转到目录中, 单击“ 其他版本” 选项下的答题键 。