平根函数图
章节大纲
-
Graphs of Square Root Functions
::平根函数图In this chapter you’ll learn about a different kind of function called the square root function . You’ve seen that taking the square root is very useful in solving quadratic equations. For example, to solve the equation x 2 = 25 we take the square root of both sides: √ x 2 = ± √ 25 , so x = ± 5 .
::在本章中,您将了解一种叫平方根函数的另一种函数。 您已经看到, 平方根对于解决二次方程非常有用。 例如, 要解决方程 x2=25, 我们以两边的平方根: x2=25, 所以 x=5 。A square root function is any function with the form: y = a √ f ( x ) + c —in other words, any function where an expression in terms of x is found inside a square root sign (also called a “radical” sign), although other terms may be included as well.
::平方根函数是任何函数,其窗体为:y=af(x)+c——换句话说,在平方根符号(也称为“激进”符号)中找到 x 表达式的任何函数,尽管其他术语也可以包含在内。Graph and Compare Square Root Functions
::图形和比较平平根函数When working with square root functions, you’ll have to consider the domain of the function before graphing. The domain is very important because the function is undefined when the expression inside the square root sign is negative, and as a result there will be no graph in whatever region of x − values makes that true.
::当使用平方根函数工作时, 您必须在图形绘制前考虑函数的域。 此域非常重要, 因为当平方根符号内的表达式为负值时, 此函数是未定义的, 因此在 x - values 的任何区域中都不会有图形。To discover how the graphs of square root functions behave, let’s make a table of values and plot the points.
::为了发现平方根函数的图形如何运行,让我们绘制一个数值表并绘制点。Graphing Functions
::图图函数Graph the function y = √ x .
::绘制函数 yx 。Before we make a table of values, we need to find the domain of this square root function. The domain is found by realizing that the function is only defined when the expression inside the square root is greater than or equal to zero. Since the expression inside the square root is just x , that means the domain is all values of x such that x ≥ 0.
::在我们绘制一个数值表之前, 我们需要找到此平方根函数的域。 域的查找方法是认识到该函数仅在平方根内的表达大于或等于零时才被定义。 由于平方根内的表达面仅是 x, 这意味着域是 x 的所有值, 如 x+0 。This means that when we make our table of values, we should pick values of x that are greater than or equal to zero. It is very useful to include zero itself as the first value in the table and also include many values greater than zero. This will help us in determining what the shape of the curve will be.
::这意味着当我们编制我们的数值表时,我们应该选择大于或等于零的x值。 将零本身作为表的第一个值列入表内, 并包括许多大于零的值, 将非常有用。 这将帮助我们确定曲线的形状 。x y = √ x 0 y = √ 0 = 0 1 y = √ 1 = 1 2 y = √ 2 = 1.4 3 y = √ 3 = 1.7 4 y = √ 4 = 2 5 y = √ 5 = 2.2 6 y = √ 6 = 2.4 7 y = √ 7 = 2.6 8 y = √ 8 = 2.8 9 y = √ 9 = 3 Here is what the graph of this table looks like:
::这张表格的图表如下:
The graphs of square root functions are always curved. The curve above looks like half of a parabola lying on its side, and in fact it is. It’s half of the parabola that you would get if you graphed the expression y 2 = x . And the graph of y = − √ x is the other half of that parabola:
::平方根函数的图形总是被弯曲。 上面的曲线看上去像半抛物线的半边, 事实上确实如此。 如果您用图解来表示 y2=x 的表达式, 就会得到一半的抛物线。 而 yx 的图形就是该抛物线的另一半 :
Notice that if we graph the two separate functions on the same coordinate axes, the combined graph is a parabola lying on its side.
::注意,如果我们用同一坐标轴上的两个独立的函数来图形, 组合图就是一个放在其侧面的抛物线。
Now let's compare square root functions that are multiples of each other.
::现在让我们比较一下平方根函数, 它们是相互的多重函数。Graphing Multiple Functions on the Same Graph
::在同一图表上绘制多个函数1. Graph the functions y = √ x , y = 2 √ x , y = 3 √ x , and y = 4 √ x on the same graph.
::1. 在同一图中图解函数 yx,y=2x,y=3x,y=4x。Here is just the graph without the table of values:
::这里只是没有数值表格的图表:
If we multiply the function by a constant bigger than one, the function increases faster the greater the constant is.
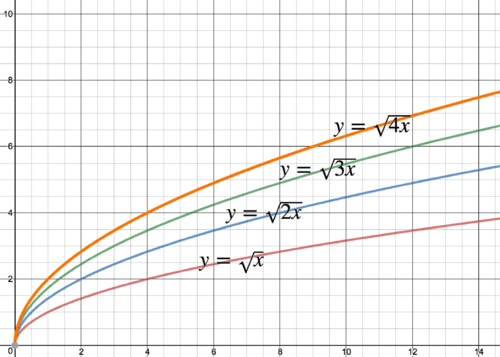
::如果我们将函数乘以一个大于一个的常数,函数的增速越快,常数越大。2. Graph the functions y = √ x , y = √ 2 x , y = √ 3 x , and y = √ 4 x on the same graph.
::2. 在同一图中绘制函数 yx、y2x、y3x和y4x。Notice that multiplying the expression inside the square root by a constant has the same effect as multiplying by a constant outside the square root; the function just increases at a slower rate because the entire function is effectively multiplied by the square root of the constant.
::注意将平方根内的表达式乘以一个常数具有与平方根以外的常数相乘的相同效果;函数只是以较慢的速度增加,因为整个函数有效乘以常数的平方根。Also note that the graph of √ 4 x is the same as the graph of 2 √ x . This makes sense algebraically since √ 4 = 2 .
::2. 还注意到4x的图与2x的图相同。3. Graph the functions y = √ x , y = 1 2 √ x , y = 1 3 √ x , and y = 1 4 √ x on the same graph.
::3. 在同一图中图解函数yx、y=12x、y=13x和y=14x。
If we multiply the function by a constant between 0 and 1, the function increases more slowly the smaller the constant is.
::如果我们将函数乘以 0 到 1 之间的常数, 函数的增速越慢, 常数越小。Examples
::实例Graph the functions
::函数图图Example 1
::例1y = 2 √ x and y = − 2 √ x on the same graph.
::y=2x 和y2x 在同一图表上。If we multiply the whole function by -1, the graph is reflected about the x − axis.
::如果我们将整个函数乘以 -1, 图将显示为 x - 轴 。
Example 2
::例2y = √ x and y = √ − x on the same graph.
::同一图表上的yx和yíx。
On the other hand, when just the x is multiplied by -1, the graph is reflected about the y − axis. Notice that the function y = √ − x has only negative x − values in its domain, because when x is negative, the expression under the radical sign is positive.
::另一方面,当仅 x x 乘以 - 1 时, 图表会反映 y - 轴 。 注意 y x 的函数在其域内只有负 x - 值, 因为当 x 为负时, 基号下的表达为正 。Review
::回顾Graph the following functions.
::如下图所示函数。-
y
=
3
√
x
::y=3x y=3x -
y
=
−
1
2
√
x
::y $ $ $ $ $ $ $ $ $ $ $ $ $ $ $ $ $ $ $ $ $ $ $ $ $ $ $ $ $ $ $ $ $ $ $ $ $ $ $ $ $ $ $ $ $ $ $ $x -
y
=
√
4
x
::y4x -
y
=
√
x
+
7
::yx+7 yx+7 -
y
=
2
√
x
−
5
::y=2x-5 -
y
=
−
√
3
x
+
1
−
2
::y3x+1-2
Graph the following functions on the same coordinate axes.
::在同一坐标轴上图解下列函数。-
y
=
√
x
,
y
=
2.5
√
x
and
y
=
−
2.5
√
x
::y=2.5 y=2.5 x y=2.5 x y=2.5 x -
y
=
√
x
,
y
=
0.3
√
x
and
y
=
0.6
√
x
::y=0.3x y=0.6x y=0.6x -
y
=
√
x
,
y
=
√
x
−
5
and
y
=
√
x
+
5
::yx -5 yx+5 yx+5 -
y
=
√
x
,
y
=
√
x
+
8
and
y
=
√
x
−
8
::yx+8和yx-8
Review (Answers)
::回顾(答复)Click to see the answer key or go to the Table of Contents and click on the Answer Key under the 'Other Versions' option.
::单击可查看答题键, 或转到目录中, 单击“ 其他版本” 选项下的答题键 。 -
y
=
3
√
x