增加和减少函数
章节大纲
-
How do you describe the behavior of a function? One useful way is to identify it as increasing or decreasing , meaning the graph goes up or down from left to right. What about graphs that are not straight lines? What if they increase and decrease in different places on the same graph?
::您如何描述函数的行为 ? 一个有用的方法就是识别函数的增减 , 意思是图形从左向右上下。 那么不是直线的图形呢 ? 如果它们在同一图表的不同位置上增减呢 ?Increasing and Decreasing Functions
::增加和减少函数In this lesson we will consider the function values in between extrema (extremes: minimums or maximums), focusing on where function values are increasing or decreasing.
::在这一课程中,我们将考虑在extrema(极端:最小值或最大值)之间的函数值,重点是函数值在增加或减少的地方。Formally
::正式形式A function is increasing on some interval of its domain if f(a) > f(b) for all a, b in that interval such that a > b .
::如果一个函数的(a) > f(b) 用于所有a、b的(f(a) > f(b)),则该函数在其域域的某些间距上正在增加,该间距为 > b。A function is decreasing on some interval of its domain if f ( a ) < f ( b ) for all a , b in that interval such that a > b .
::如果一个函数的(a) < f(b)对于所有 a,b 的(f(a) < f(b))在该间隔内为 a > b ,则该函数在其域域的某些间隔内正在缩小。Informally
::非正式非正式A function is increasing on a section if the graph of that section 'rises ' to the right.
::如果该节的图示向右,则该函数在某节上增加。A function is decreasing on a section if the graph of that section 'falls ' to the right.
::如果该节的图表从右侧掉入,则该函数在某一节上正在减少。Examples
::实例Example 1
::例1Earlier, you were given a question about describing the behavior of a function.
::早些时候,有人问你 如何描述一个函数的行为。Graphs with curves or which go up and down throughout the graph may be described with the use of intervals. By splitting the description of the graph into sections, each with consistent behavior throughout the section, the entirety of the graph may be evaluated.
::曲线图或图中上下图的图表可以使用间距来描述。通过将图的说明分成各部分,每个部分都有一致的行为,可以评价整张图。Example 2
::例2Describe the behavior of the graph below, which shows the federal minimum wage from 1975 to 2005:
::说明下图的行为,下图显示1975年至2005年联邦最低工资:Overall, from 1975 to 2005, the minimum wage (in dollars per hour) increased from $2.10 per hour to $5.15 per hour. However, if we examine the graph on smaller intervals, we can see that this increase was not steady. For example, the minimum wage increased from $2.30 in 1977 (year 3) to $3.35 in 1981 (year 7), and then it was constant for several years at $3.35 per hour. We can describe this situation using intervals. For example, we can say that the function increases on the interval (3,7) and is constant on the interval (7, 15).
::从1975年到2005年,最低工资(每小时美元)从每小时2.10美元增加到每小时5.15美元,然而,如果用更小的间隔来查看图表,我们可以看到这一增长并不稳定,例如,最低工资从1977年的2.30美元(第3年)增加到1981年的3.35美元(第7年),然后连续几年按每小时3.35美元计算。我们可以用间隔来描述这种情况。例如,我们可以说,每小时的间隔(3,7)和间隔(第7,15年)的功能在增加,间隔(第7,15年)保持不变。Example 3
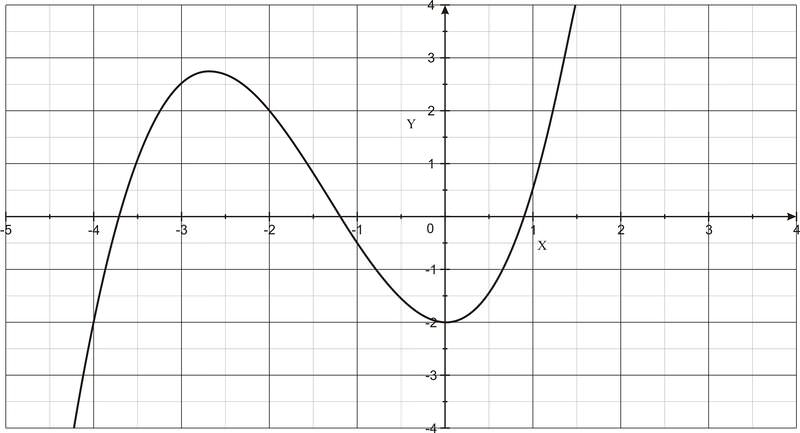
::例3The graph below shows the minimum wage data adjusted for inflation. (Since prices for food and other necessities tend to go up over time, comparing absolute dollar amounts doesn’t make sense. The adjustment shows how much one can buy with minimum wage.) State the intervals on which the graph increases and the intervals on which it decreases. Use proper interval notation.
::下图显示了根据通货膨胀调整的最低工资数据。 (由于食品和其他必需品的价格随时间推移而上升,对绝对美元数额进行比较是没有道理的。 调整表明人们可以用最低工资购买多少。 )请说明图表增长的间隔和下降的间隔。 使用适当的间隔标记。The function decreases on the intervals (2, 3), (5, 15), (18, 21), (24, 31).
::间隔(2、3)、5、15、18、21)、24、31的功能减少。The function increases on the intervals (1, 2), (3, 4), (15, 17), (22, 24).
::间距(1、2)、3、4、15、17、22、24)的功能增加。Notice that this is a discrete function, and the intervals are ranges of specific points. That is, the function is decreasing if, when we look at the graph, the points are sloping down from left to right. The function is increasing if the points are sloping up from left to right. This will be the case for any discrete function.
::注意这是一个离散函数, 间隔是特定点的范围 。 也就是说, 当我们查看图形时, 当点从左向右倾斜时, 函数正在下降 。 当点从左向右倾斜时, 函数正在增加 。 任何离散函数都是这样 。Example 4
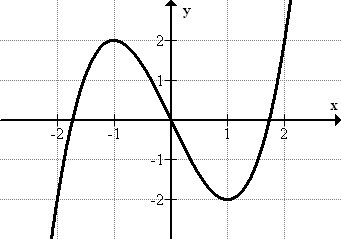
::例4Identify the intervals of increase and decrease, use interval notation:
::确定增减的间隔,使用间隔编号:The function increases on the interval and on the interval . The function decreases on the interval .
::间距( , -1) 和间距(1, ) 的函数增加。 间距( -1) 的函数减少( -1) 。These are open intervals (with parentheses instead of brackets) is because the function is neither increasing nor decreasing at the moment it changes direction. We can imagine a ball thrown into the air. The height increases up to a maximum point before it starts to decrease. What happens at that maximum point? There is an instant when the height is not changing; it is neither increasing nor decreasing, so those specific values are not included on the interval.
::这些是开放间隔(带括号而不是括号),这是因为函数在改变方向时既不增加,也不减少。我们可以想象一个投入空气中的球。高度会增加到最大点,然后才开始下降。在最大点会发生什么?高度没有变化时会有一个瞬间;既不增加,也不减少,因此这些特定值不会包括在间隔内。Example 5
::例5Give an example of a discrete function that increases and decreases on different intervals of its domain.
::举一个不同函数的例子,该函数在其域的不同间隔内增减。Answers will vary, but should describe a function such as a person's height compared to his or her age. That is, values will increase until the age at which the person stops growing. Then the function will be constant for several decades. Then the function will decrease slightly, as some people lose height in their later years.
::答案会有所不同, 但应该描述一个函数, 如一个人的身高与其年龄相比。 也就是说, 数值会增长到他停止成长的年龄。 然后, 该函数会持续几十年。 然后函数会略有下降, 因为有些人在晚年会失去身高 。Example 6
::例6Kim earns tips at work on Mon, Wed, and Fri. She likes to go to the movies with her friends on Tues. evenings when there are no crowds. On Saturdays, she and her boyfriend go skating in the park and always stop for ice cream. Describe the intervals where Kim's money is increasing and decreasing.
::金姆在周一、周五、周五和周五工作时赚到小费。她喜欢和朋友一起看电影。晚上没有人群。星期六,她和男友去公园滑冰,经常停下来吃冰淇淋。描述金姆的钱在增加和减少的间隔。Kim's money is increasing for the interval between Monday and Tuesday evening, decreasing for the Tuesday to Wednesday interval, increasing during the interval between work on Wednesday and ice cream on Saturday, and finally, decreasing between ice cream on Saturday and work on Monday.
::金在周一和周二晚上的间隔期间增加资金, 星期二到周三的间隔期间减少, 星期三工作到周六冰淇淋的间隔期间增加, 最后星期六冰淇淋和周一工作之间减少。Review
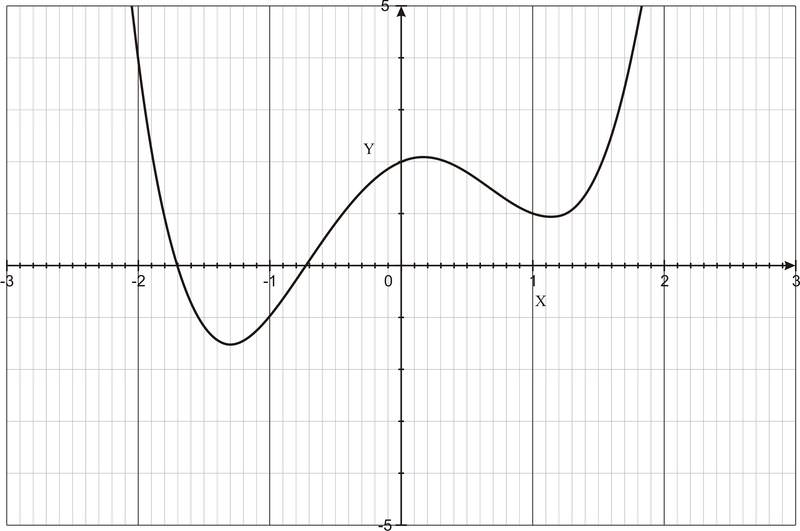
::回顾For questions 1 and 2, consider the following graph:
::关于问题1和2,请参考下图:-
Approximate the coordinates of the relative maximum of the graph
::接近图表相对最大值的坐标 -
Approximate the coordinates of the relative minimum of the graph.
::接近图中相对最小值的坐标。 -
Consider the equation of a linear function
y
=
mx
, where m is the slope of the line. For what values of
m
will the function be an increasing function? For what values of
m
will the function be a decreasing function?
::考虑线性函数 y = mx 的方程, 线性函数的斜度是 m 。 对于 m 的值, 该函数将是一个递增的函数? 对于 m 的值, 该函数将是一个递减的函数? -
Consider the graph above for questions 2 and 3. On what intervals is the function increasing? On what intervals is the function decreasing?
::问题2和3考虑上面的图表。 函数增加的间隔是多少? 函数减少的间隔是多少? -
Sketch a possible graph of the function described here: The function is continuous on
. It is decreasing on the interval
and increasing on the interval
.
::绘制此处描述的函数的可能的图形: R 上的函数是连续的。 它的间隔( , 2) 正在缩小, 间隔(2, ) 则在增加 。 -
Explain in your own words the difference between relative and global extrema.
::用你自己的话来解释一下 相对的和全球性的 极端的区别。 -
For the function shown in the graph below, give approximate coordinates of all global and relative extrema.
::对于下图中显示的函数,请给出所有全球和相对外形的近似坐标。 -
Consider the function
. Use a graphing utility to sketch a graph of this function and to calculate a relative minimum.
::考虑函数 f( x) =x2+2x。使用图形工具绘制此函数的图形,并计算相对最小值。 -
A rectangle is inscribed in a semi-circle of radius 3. a) Write an equation to represent the area of the rectangle as a function of
x
. b) Graph the equation and calculate the maximum area of the rectangle.
::矩形被刻在半半圆3的半圆形中。 a) 写入一个方程以表示矩形区域为 x. b) 绘制方程并计算矩形的最大区域。 -
Sketch a graph of a function which has an absolute maximum, but no local maximum, on the interval [-5, 7].
::绘制一个函数的图形,该函数在间隔[5、5、7]上具有绝对最大值,但没有本地最大值。 -
Sketch a graph of a function with two local minimums on the interval (-4, 9], and no global extrema.
::绘制一个函数的图形,在间隔( 4、 9) 和无全球矩形时,有两个本地最小值。
For questions 13 - 15, use the following information: Sam makes $7.50 per hour at work, and he works anywhere from 15 - 40hrs per week. Occasionally the store gets really busy, and Sam's boss allows him to work up to 15hrs of overtime. Sam loves the busy weeks, because he makes "time-and-a-half", or $11.25, for overtime hours.
::对于问题13-15,请使用以下信息:Sam每小时工作7.50美元,每周工作15至40小时。 偶尔商店非常忙,Sam的老板允许他加班15小时。 Sam喜欢繁忙的几周,因为他的加班时间是“半小时 ” , 即11.25美元。-
Sketch a graph showing Sam's
regular
income range. Where are the local extrema?
::绘制一张显示Sam正常收入范围的图表。当地电流在哪里? -
Sketch another graph including Sam's regular and overtime income, identifying all local extrema.
::绘制另一幅图 包括萨姆的定期收入和加班收入 标明所有本地的终点
Review (Answers)
::回顾(答复)Click to see the answer key or go to the Table of Contents and click on the Answer Key under the 'Other Versions' option.
::单击可查看答题键, 或转到目录中, 单击“ 其他版本” 选项下的答题键 。