合理函数分析
章节大纲
-
Consider the following situation:
::审议下列情况:Students in your school are currently required to demonstrate their understanding of their classwork at a level of 75% or higher in order to move on to more advanced material.
::目前,学校的学生必须表明他们对班级工作的了解达到75%或以上,才能继续学习更先进的教材。The amount of homework time T required for each student based on understanding level of p % is given by:
::根据理解水平(p%),每名学生需要的功课时间T, 具体如下: T=(18p)(100-p)If the school administration decides to raise the minimum level of understanding to 82%, how will this affect the students' homework time?
::如果学校行政部门决定将最低理解水平提高到82%,这将如何影响学生的功课时间?This is an example of a rational function in a real-world situation.
::这是在现实世界局势中合理发挥作用的一个例子。Analyzing Rational Functions
::分析逻辑函数Finding Vertical Asymptotes and Breaks
::查找垂直单数和断点Recall that rational functions are defined as where and are .
::回顾合理函数定义为 r( x) = p( x)q( x) , 而 p( x) 和 q( x) 是 。To find vertical asymptotes and breaks in the domain of a rational function, set the denominator equal to zero and solve for . Given , set and solve for .
::要在合理函数域中找到垂直的单位和折号, 请将分母设置为零, 并解决 x. give r( x) =p( x)q( x), 设定 q( x) =0 和 x 的解答 。Note that some rational functions have vertical asymptotes and others do not. Some rational functions have a break in the function , but no vertical asymptote . This usually happens when one term in the numerator cancels with one term in the denominator.
::请注意, 某些理性函数有垂直的零点, 而另一些则没有。 有些理性函数有函数断裂, 但没有垂直的零点。 通常当分子中的某个词在分母中用一个词取消时, 就会发生这种情况 。Evaluating End Behavior
::评价结束行为The end behavior of a rational function can often be identified by the horizontal asymptote . That is, as the values of get very large or very small, the graph of the rational function will approach (but not reach) the horizontal asymptote.
::理性函数的结束行为通常可以通过水平零点来识别。 也就是说, 当 x 的值变得非常大或非常小时, 理性函数的图形将接近( 但没有达到) 水平零点 。Examples
::实例Example 1
::例1Earlier, you were asked a question about students' homework time.
::早些时候,有人问你一个问题 关于学生的功课时间。The number of minutes of homework time T required for each student based on understanding level of p '% is given by: If the school administration decides to raise the minimum level of understanding to 82%, how will this affect the students' homework time?'
::如果学校行政部门决定将最低理解水平提高到82%,这将如何影响学生的功课时间?”The current time required is: ==>
::目前需要的时间是: (18(75)/(100-75) 54minBy substituting in the increased level: ==>
::以增加的水平取代增加的水平: (18(82)/(100-82) 82minThe increase in required proficiency would result in an average of 28mins of added study time per student.
::所需熟练程度的提高将使每个学生平均增加28分钟的学习时间。Example 2
::例2Consider the following rational function. Find all restrictions on the domain and asymptotes.
::考虑以下的理性函数。 查找对域和小数数的所有限制 。
:xx) =x2+2x-35x-5
Factoring the numerator
::乘数计算器
:Canceling
::取消取消
:Notice that there is no asymptote in this function, but rather a break in the graph at .
::请注意,此函数中不存在空洞状态,而是在 x=5 的图形中进行中断。Example 3
::例3Find the restrictions on the domain of
::找出对以下领域的限制:
::h(x)=3x22-2-2-25Setting the denominator equal to 0,
::设定等于 0 的分母,
::x2 - 25=0x2=25x% 5Thus, the domain of is the set all real numbers with the restriction . has two vertical asymptotes, one at and one at .
::因此,h(x)的域是设定所有真实数字 x ,并有限制 x5. h(x) 有两个垂直的单位数, 一个在 x=5 , 一个在 x=5 5 。Note for graphing using technology problems: If you do not have a graphing calculator, there are a number of excellent free apps, and an excellent free online calculator here: .
::使用技术问题的图形化注释:如果您没有图形化计算器,请使用一些极好的免费应用程序,并使用一个极好的免费在线计算器: 。Example 4
::例4(Graphing calculator exercise)
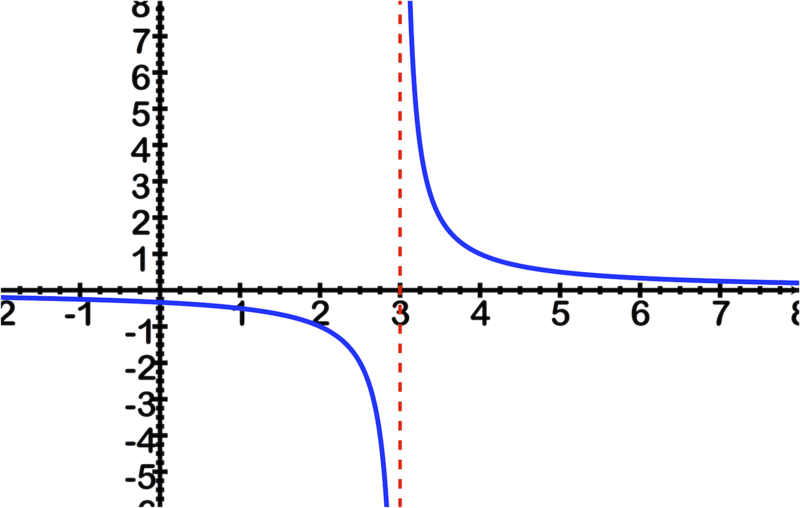
:Graph on the window [-10,10] X [-10,10]. (This means {XMIN}=-10, {XMAX}=10, {YMIN}=-10, and {YMAX}=10).
::图f(x)=1x-3 窗口 [10,10] X [10,10]。 (这意味着 {XMIN}-10,{XMAX}-10,{YMIN}-10,和{YMAX}_10)。Notice:
::通知 :-
When graphing a rational function by entering the function in the
screen, remember that you need to use parenthesis to group the numerator and denominator of the rational function.
::当通过输入 Y= 屏幕中的函数来绘制理性函数时, 请记住您需要使用括号来组合理性函数的分子和分母。 -
Vertical asymptotes are sometimes graphed as vertical lines.
::垂直的微粒有时被用垂直线划为垂直线。 -
Graphs of rational functions can be difficult to interpret if the window settings are not chosen carefully.
::如果不仔细选择窗口设置, 则很难解释合理函数的图形 。
showing vertical line at
::y=1x-3 显示 x=3 的垂直线is undefined and has a vertical asymptote at , but the way the graphing calculator draws the graph, it shows a vertical line at . One way to “fix” this problem is to press MODE and select the option “Dot” rather than “Connected”. However, dot graphs can be hard to interpret as well.
::f(x) 未定义, 且在 x=3 上有一个垂直的空位, 但图形计算计算器绘制图形的方式显示在 x=3 上的垂直线 。 “ 固定” 的方法之一是按 MODE 键, 选择“ 点” 选项, 而不是“ 连接” 。 但是, 点图形也很难解释 。Example 5
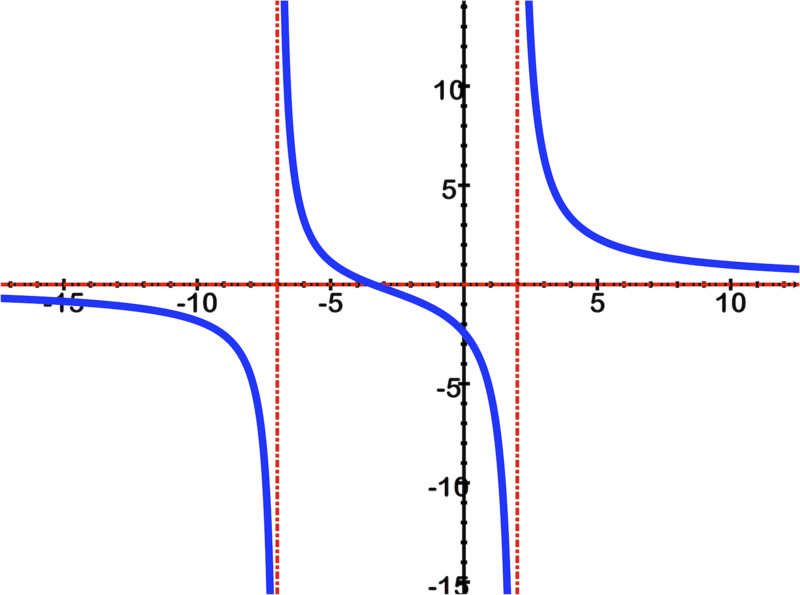
::例5Solve the equation and find any points of discontinuity using technology: .
::利用技术(f(x)=6x-2+4x+7)解决方程式并找到任何不连续点。Input the function into the grapher, don't forget to use "(" ")" to group polynomials. Your function should look something like this on your input screen (at least until you tell the calc to process the function): 6/(x - 2) + 4/(x + 7) . Note that some calculators require the " y = " or " f ( x ) = " and some do not.
::将函数输入到图形器中,不要忘记使用“ (”) ” 来组合多数值。 您的函数应该在输入屏幕上看起来像这样( 至少在您告诉计算器处理函数之前): 6/( x - 2) + 4/( x + 7) 。 请注意, 某些计算器需要“ y =” 或“ f( x) = ” , 而有些计算器则不需要 。Once you are sure you have the information entered correctly, press "calculate", or the equivalent. The graph should look like:
::一旦您确定信息输入正确, 请按“ 计算 ” 或等值 。 图形应该看起来像 :There are asymptotes at and and .
::在 x=2 和 x=7 和 y=0 处有小数点。Example 6
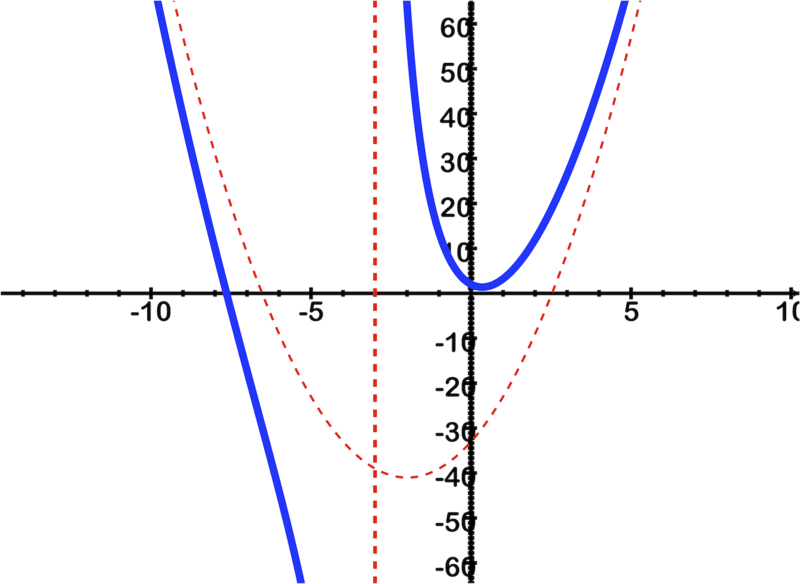
::例6Using technology, find all intercepts , asymptotes, and discontinuities, and graph: .
::使用技术,找到所有拦截、无症状和不连续,图表:2x3+14x2-9x+6x3。Input the function with care, it should look something like: before you press the calc or view button.
::输入函数时要小心, 它应该看起来像 : (2x3+14x2- 9x+6) / (x+3) 在您按下计算器或查看按钮之前 。The graph should look like:
::图表应该看起来像:The intercepts are at (apx) and (exactly) .
::拦截地点是(传真)(-7.64,0)和(准确的)(0,2)。There is a vertical asymptote at and a curved asymptote described by: .
::在 x=3 和 y= 2x2+8x- 33 描述的曲线的星点为: y= 2x2+8x- 33 。Example 7
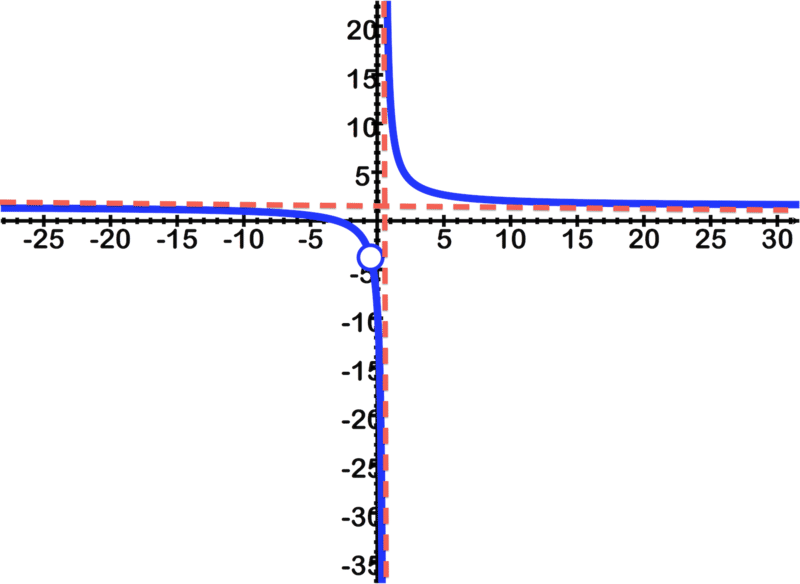
::例7Using technology, simplify, find discontinuities and limitations, then graph: .
::使用技术、简化、发现不连续和限制,然后用图:6x2+21x+94x2-1。Input the function accurately. The graph should look like:
::输入函数的准确性。图形应显示为 :The function simplifies to:
::函数简化为 3( 2x2+7x+3) 4( x2 - 14) 4( x2 - 14) 3( 2x+1)( x+3) 4( x - 12)( x+12)There are asymptotes at and at .
::在 x=12 和 y=12 处有小数点。There is a hole at .
::y334有个洞Review
::回顾For questions 1 - 5, factor the numerator and denominator, then set the denominator equal to zero and solve to find restrictions on the domain.
::对于问题1-5,将分子和分母乘以乘以数和分母,然后将分母设为零,然后解决以找出对域的限制。-
::y=x2+3x-10x-2 -
: -
: -
::y=x2+1220x+45 -
::y=x2+13x+42x+7
For questions 6 - 15 , input the function into your graphing tool carefully and accurately. Record any asymptotes or holes and record x and y intercepts. Finally either copy and print or sketch the image of the graphed function.
::对于问题 6 - 15, 请仔细准确地将函数输入您的图形工具。 记录任何小孔或孔, 记录 x 和 y 拦截。 最后要么复制, 打印, 要么绘制图形函数的图像 。-
::y=x3+5x2+3x+7x-1 -
::y= 9x2+6x y= 9x2+6x -
::f( x) 8x3 - 8x2+2x+8x+2 -
: -
::y= (- 2x3+2x2+5x+2x2(x-2)(x+7)) -
::y=4x3+2x2+7(x+2)2 -
: -
: -
::y5x2 - 2x - 5x2+2 -
::y=x - 1x3 - 2
Review (Answers)
::回顾(答复)Click to see the answer key or go to the Table of Contents and click on the Answer Key under the 'Other Versions' option.
::单击可查看答题键, 或转到目录中, 单击“ 其他版本” 选项下的答题键 。 -
When graphing a rational function by entering the function in the
screen, remember that you need to use parenthesis to group the numerator and denominator of the rational function.