贫穷和收入分配
章节大纲
-
Poverty & the Distribution of Income
::贫穷和收入分配Measuring inequality involves making comparisons across the entire distribution of income, not just the poor. One way of doing this is to divide the population into groups, like quintiles, and then calculate what share of income is received by each group. An alternative approach is to draw Lorenz curves, which compare the cumulative income actually received to a perfectly equal distribution of income. Income inequality in the United States increased substantially from the late 1970s and early 1980s into the 2000s. The two most common explanations cited by economists are changes in the structure of households that have led to more two-earner couples and single-parent families, and the effect of new information and communications technology on wages.
::衡量不平等的方法是对整个收入分配进行对比,而不仅仅是对穷人进行对比。这样做的一种方法是将人口分为五等分层等群体,然后计算每个群体的收入份额。另一种办法是绘制洛伦茨曲线,将实际收到的累积收入与完全平等的收入分配进行比较。从1970年代末和1980年代初到2000年代,美国的收入不平等大幅度增加。经济学家引用的两个最常见的解释是导致更多两代夫妇和单亲家庭的家庭结构变化以及新的信息和通信技术对工资的影响。Universal Generalizations
::普遍化-
There are various reasons for income inequality, including education and discrimination.
::造成收入不平等的原因多种多样,包括教育和歧视。 -
Economists use the Lorenzo Curve to contrast the distribution of income at different points in time.
::经济学家使用洛伦佐曲线来对比不同时间点的收入分配。
Guiding Questions
::问 问 问 问 问 问 问 问 问 问 问 问 问 问 问 问 问 问 问 问 问 问 问 问 问 问 问 问 问 问 问 问 问 问 问 问 问 问 问 问 问 问 问 问 问 问 问 问 问 问 问 问 问 问 问 问 问 问 问 问 问 问 问 问 问 问 问 问 问 问 问 问 问 问 问 问 问 问 问 问 问 问 问 问 问 问 问 问 问 问 问 问 问 问 问 问 问 问-
Who determines the poverty guidelines for the U.S. government?
::谁来决定美国政府的贫困准则? -
What is one reason for the continued high poverty numbers in the U.S.?
::美国贫穷人数居高不下的原因何在? -
Why was "welfare" created?
::为什么"福利"是创造的? -
Why are states moving from welfare to workfare?

::为什么各州从福利转向工作福利?
On September 17, 2011, Occupy Wall Street began in New York City’s Wall Street financial district. (Credit: modification of work by David Shankbone/Flickr Creative Commons)
Occupy Wall Street
::占领华尔街In September 2011, a group of protesters gathered in Zuccotti Park in New York City to decry what they perceived as increasing social and economic inequality in the United States. Calling their protest “Occupy Wall Street,” they argued that the concentration of wealth among the richest 1% in the United States was both economically unsustainable and inequitable, and needed to be changed. The protest then spread to other major cities, and the Occupy movement was born.
::2011年9月,一群抗议者聚集在纽约市Zucccotti公园(Zuccotti Park ) , 指责他们认为美国社会和经济不平等加剧。 他们称他们的抗议“豪华街 ” ( Occupy Wall Street ) , 他们认为财富集中在美国最富有的1%人口身上在经济上是不可持续的和不公平的,需要改变。 然后抗议蔓延到其他主要城市,占领运动诞生了。Why were people so upset? How much wealth is concentrated among the top 1% in our society? How did they acquire so much wealth? These are very real, very important questions in the United States now, and this chapter on poverty and economic inequality will help us address the causes behind this sentiment.
::为何人们如此沮丧? 多少财富集中在我们社会最前的1%中? 他们是如何获得如此多财富的? 在美国,这些都是非常真实、非常重要的问题,而关于贫穷和经济不平等的这一章将帮助我们解决这种情绪背后的原因。The Occupy movement took on a life of its own over the last few months of 2011, bringing to light issues faced by many people on the lower end of the income distribution. The contents of this chapter indicate that there is a significant amount of income inequality in the United States. The question is: What should be done about it?
::占领运动在2011年最后几个月中自生自灭,暴露了许多人在收入分配低端所面临的问题,本章的内容表明,美国存在相当大程度的收入不平等。 问题是:应该做些什么呢?The Great Recession of 2008–2009 caused unemployment to rise and incomes to fall. Many people attribute the recession to mismanagement of the financial system by bankers and financial managers—those in the 1% of the income distribution—but those in lower quintiles bore the greater burden of the recession through unemployment. This seemed to present the picture of inequality in a different light: the group that seemed responsible for the recession was not the group that seemed to bear the burden of the decline in output. A burden shared can bring a society closer together; a burden pushed off onto others can polarize it.
::2008—2009年的大衰退导致失业上升和收入下降。 许多人将衰退归咎于银行家和金融经理对金融体系的管理不善 — — 收入分配的1% — — 但下五等分层的人却通过失业承担了更大的衰退负担。 这似乎从不同的角度呈现了不平等的景象:似乎应对衰退负责的群体并不是似乎承担了产出下降负担的群体。 共同的负担可以让社会更加紧密地联系在一起;被推到其他人身上的负担可以使社会两极分化。On one level, the problem with trying to reduce income inequality comes down to whether you still believe in the American Dream. If you believe that one day you will have your American Dream—a large income, large house, happy family, or whatever else you would like to have in life—then you do not necessarily want to prevent anyone else from living out their dream. You certainly would not want to run the risk that someone would want to take part of your dream away from you. This thinking makes people reluctant to engage in a redistributive policy to reduce inequality.
::一方面,试图减少收入不平等的问题在于你是否仍然相信“美国梦 ” 。 如果你相信有一天你会有你的“美国梦 ” — —一个大收入、大房子、幸福的家庭,或者你生活所希望的任何东西 — — 那么,你不一定想阻止其他人实现他们的梦想。你当然不想冒着让某人将你的梦想从你身边夺去的风险。 这种想法使人们不愿采取再分配政策来减少不平等。However, when those for whom the likelihood of living the American Dream is very small are considered, there are sound arguments in favor of trying to create greater balance. As the text indicated , a little more income equality, gained through long-term programs like increased education and job training, can increase overall economic output. The desired result is that everyone is made better off, and the 1% will not seem like such a small group anymore.
::然而,当那些生活在美国梦中的可能性很小的人被考虑时,有合理的理由支持试图创造更大的平衡。 正如文本所示,通过长期方案(如增加教育和职业培训)获得的更多收入平等可以提高总体经济产出。 所期望的结果是每个人都得到更好的待遇,而1 % 将不再像一个如此小的群体了。The Labor Market and Inequalities
::劳动力市场和不平等The labor markets that determine what workers are paid do not take into account how much income a family needs for food, shelter, clothing, and healthcare. Market forces do not worry about what happens to families when a major local employer goes out of business. Market forces do not take time to contemplate whether those who are earning higher incomes should pay an even higher share of taxes.
::确定哪些工人得到工资的劳动力市场没有考虑到家庭对食物、住房、衣着和医疗保健的需求。 市场力量不担心当一个主要本地雇主倒闭时家庭会发生什么。 市场力量不需要花时间来考虑那些收入较高的人是否应该缴纳更高的税收份额。However, labor markets do create considerable inequalities of income. In 2012, the median American family income was $62,241 (the median is the level where half of all families had more than that level and half had less). According to the U.S. Census Bureau, almost nine million U.S. families were classified by the federal government as being below the poverty line in that year. Think about a family of three—perhaps a single mother with two children—attempting to pay for the basics of life on perhaps $17,916 per year. After paying for rent, healthcare, clothing, and transportation, such a family might have $6,000 to spend on food. Spread over 365 days, the food budget for the entire family would be about $17 per day. To put this in perspective, most cities have restaurants where $17 will buy you an appetizer for one.
::然而,劳动力市场确实造成了相当严重的收入不平等。 2012年,美国家庭收入中位数为62,241美元(中位数是所有家庭的一半家庭收入超过这一水平,一半家庭的收入低于这一水平 ) 。 据美国人口普查局统计,近900万个美国家庭被联邦政府归类为该年贫困线以下的家庭。 想想三个家庭 — — 也许一个有两个孩子的单身母亲 — — 试图每年支付17,916美元的基本生活费用。 在支付房租、医疗费、服装和交通费之后,这样的家庭可能会有6000美元用于食品。 超过365天,整个家庭的食品预算将达到每天17美元左右。 从这个角度看,大多数城市都有一家餐馆,17美元将买给你一顿开胃菜。This section explores how the U.S. government defines poverty, the balance between assisting the poor without discouraging work, and how federal antipoverty programs work. It also discusses income inequality—how economists measure inequality, why inequality has changed in recent decades, the range of possible government policies to reduce inequality, and the danger of a tradeoff that too great a reduction in inequality may reduce incentives for producing output.
::本节探讨美国政府如何定义贫困,在帮助穷人而不阻碍工作与联邦除贫方案如何运作之间保持平衡。 它还讨论了收入不平等问题 — — 经济学家如何衡量不平等问题,为什么近几十年来不平等发生了变化,政府减少不平等的可能政策的范围,以及过度减少不平等可能减少产出激励因素的权衡风险。Drawing the Poverty Line
::贫困线的划定Comparisons of high and low incomes raise two different issues: economic inequality and poverty. Poverty is measured by the number of people who fall below a certain level of income—called the poverty line —that defines the income needed for a basic standard of living. Income inequality compares the share of the total income (or wealth) in a society that is received by different groups; for example, comparing the share of income received by the top 10% to the share of income received by the bottom 10%.
::高收入和低收入的比较提出了两个不同的问题:经济不平等和贫穷;贫穷是按低于某种收入水平的人数来衡量的——所谓的贫困线——确定基本生活水平所需的收入;收入不平等比较了不同群体在社会总收入(或财富)中所占的份额;例如,将前10%的收入份额与下10%的收入份额进行比较。In the United States, the official definition of the poverty line traces back to a single person: Mollie Orshansky. In 1963, Orshansky, who was working for the Social Security Administration, published an article called “Children of the Poor” in a highly useful and dry-as-dust publication called the Social Security Bulletin . Orshansky’s idea was to define a poverty line based on the cost of a healthy diet.
::在美国,贫困线的官方定义可以追溯到一个人身上:莫利·奥尔尚斯基(Mollie Orshansky ) 。 1963年,为社会保障管理局工作的奥尔尚斯基(Orshansky)在一份非常有用和干燥的《社会保障公报》出版物上发表了一篇文章,题为《穷人儿童 》 。 奥尔尚斯基的想法是根据健康饮食的成本来界定贫困线。Her previous job had been at the U.S. Department of Agriculture, where she had worked in an agency called the Bureau of Home Economics and Human Nutrition. One task of this bureau had been to calculate how much it would cost to feed a nutritionally adequate diet to a family. Orshansky found that the average family spent one-third of its income on food. She then proposed that the poverty line be the amount needed to buy a nutritionally adequate diet, given the size of the family, multiplied by three.
::她以前的工作是在美国农业部,她曾在一个名为家政学和人类营养局的机构工作,该局的一项任务是计算向一个家庭提供营养充足膳食的费用,Orshandsky发现平均家庭将其收入的三分之一用于食品,然后她建议贫困线是购买营养充足膳食所需的金额,考虑到家庭的规模,乘以3。The current U.S. poverty line is essentially the same as the Orshansky poverty line, although the dollar amounts are adjusted each year to represent the same buying power over time. The U.S. poverty line in 2012 ranged from $11,720 for a single individual to $23,492 for a household of four people.
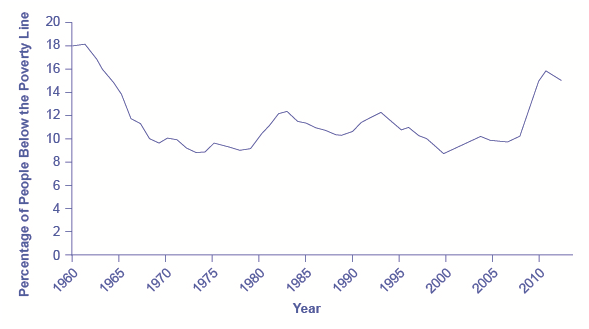
::美国目前的贫困线与奥尔尚斯基贫困线基本相同,尽管美元数额每年都会调整,以代表同一时期的购买力。 2012年,美国贫困线从单人11,720美元到四人家庭的23,492美元不等。1 shows the U.S. poverty rate over time; that is, the percentage of the population below the poverty line in any given year. The poverty rate declined through the 1960s, rose in the early 1980s and early 1990s, but seems to have been slightly lower since the mid-1990s. However, in no year in the last four decades has the poverty rate been less than 11% of the U.S. population— that is, at best about one American in nine is below the poverty line. In recent years, the poverty rate appears to have peaked at 15.9% in 2011 before dropping to 15.0% in 2012. 1 compares poverty rates for different groups in 2011. As you will see when we delve further into these numbers, poverty rates are relatively low for whites, for the elderly, for the well-educated, and for male-headed households. Poverty rates for females, Hispanics, and African Americans are much higher than for whites. While Hispanics and African Americans have a higher percentage of individuals living in poverty than others, most people in the United States living below the poverty line are white.
::贫困率在1960年代一直下降,在1980年代初和1990年代初有所上升,但自1990年代中期以来似乎略有下降,但自1990年代中期以来,贫困率似乎略有下降。然而,在过去40年中,美国人口中的贫困率从未低于11%,也就是说,最多九分之一的美国人处于贫困线以下。近年来,贫困率似乎在2011年达到高峰,达到15.9%,2012年降至15.0%。 1 2011年,不同群体的贫困率相比,2011年,不同群体的贫困率有所上升,白人、老年人、受过良好教育的老年人和以男性为户主的家庭的贫困率相对较低。女性、西班牙裔和非洲裔美国人的贫困率比白人高得多。西班牙裔美国人和非洲裔美国人的贫困率高于其他人,而生活在贫困线以下的美国人大多是白人。The U.S. Poverty Rate since 1960
::美国自1960年以来的贫困率The poverty rate fell dramatically during the 1960s, rose in the early 1980s and early 1990s, and, after declining in the 1990s through mid-2000s, rose to 15.9% in 2011, which is close to the 1960 levels. In 2012, the poverty dropped slightly to 15.0%. (Source: U.S. Census Bureau)
Group
::组组群Poverty Rate
::贫穷率 贫困率Females
::女性 女性 女性16.3%
Males
::男性 男性13.6%
White
::白白13.0%
Black
::黑黑色27.6%
Hispanic
::西班牙语25.3%
Under age 18
::18岁以下21.9%
Ages 18–24
::18-24岁20.6%
Ages 25–34
::25-34岁15.9%
Ages 35–44
::35-44岁12.2%
Ages 45–54
::45-54岁10.9%
Ages 55–59
::55-59岁10.7%
Ages 60–64
::60-64岁10.8%
Ages 65 and older
::65岁及65岁以上8.7%
Poverty Rates by Group, 2011
The concept of a poverty line raises many tricky questions. In a vast country like the United States, should there be a national poverty line? After all, according to the Federal Register, the median household income for a family of four was $102,552 in New Jersey and $57,132 in Mississippi in 2013, and prices of some basic goods like housing are quite different between states. The poverty line is based on cash income, which means it does not take into account government programs that provide assistance to the poor in a non-cash form, like Medicaid (health care for low-income individuals and families) and food aid. Additionally, low-income families can qualify for federal housing assistance. (These and other government aid programs will be discussed in detail later in this section.)
::贫困线的概念提出了许多棘手的问题。 在像美国这样的广大国家中,如果有国家贫困线的话? 毕竟,根据联邦登记册,2013年新泽西州四个家庭的中位家庭收入为102,552美元,密西西比州为57,132美元,各州住房等一些基本商品的价格差异很大。 贫困线以现金收入为基础,这意味着它没有考虑到政府以非现金形式向穷人提供援助的方案,如医疗补助(低收入个人和家庭的医疗保健)和粮食援助。 此外,低收入家庭有资格获得联邦住房援助。 (这些和其他政府援助方案将在本节下文详细讨论。 )Should the poverty line be adjusted to take the value of such programs into account? Many economists and policymakers wonder whether the concept of what poverty means in the twenty-first century should be rethought. The following Clear It Up feature explains the poverty lines set by the World Bank for low-income countries around the world.
::贫穷线是否应该调整,以考虑到这些方案的价值? 许多经济学家和决策者想知道是否应该重新思考21世纪贫穷意味着什么的概念。 下面的“清一色”特征解释了世界银行为全世界低收入国家设定的贫穷线。Clear it Up: How is Poverty Measured in Low-income Countries?
::明确:低收入国家如何衡量贫穷程度?The World Bank sets two poverty lines for low-income countries around the world. One poverty line is set at an income of $1.25/day per person; the other is at $2/day. By comparison, the U.S. 2011 poverty line of $17,916 annually for a family of three works out to $16.37 per person per day.
::世界银行为世界各地的低收入国家设定了两条贫困线,一条贫困线为每人每天1.2美元的收入,另一条贫困线为每天2美元,相比之下,美国2011年3个家庭的贫困线为每年17 916美元,每人每天16.37美元。Clearly, many people around the world are far poorer than Americans, as 2 shows. China and India both have more than a billion people; Nigeria is the most populous country in Africa; and Egypt is the most populous country in the Middle East. In all four of those countries, in the mid-2000s, a substantial share of the population subsisted on less than $2/day. Indeed, about half the world lives on less than $2.50 a day, and 80 percent of the world lives on less than $10 per day. (Of course, the cost of food, clothing, and shelter in those countries can be very different from those costs in the United States, so the $2 and $2.50 figures may mean greater purchasing power than they would in the United States.)
::显然,正如两点所显示的,全世界许多人比美国人穷得多。 中国和印度都拥有10亿多人口;尼日利亚是非洲人口最多的国家;埃及是中东人口最多的国家。 在这些国家中,在2000年代中期,在这些国家中,很大一部分人口每天生活费不足2美元。 事实上,全世界约有一半人每天生活费不到2.50美元,世界80%的人每天生活费不到10美元。 (当然,这些国家的食品、衣物和住房费用可能与美国非常不同,因此2美元和2.50美元的数字可能意味着比美国更大的购买力。 )Country
::国家Share of Population below $1.25/Day
::低于1.25美元/日数的人口比例Share of Population below $2.00/Day
::低于每日2.00美元的人口比例Brazil (in 2009)
::巴西(2009年)6.1%
10.8%
China (in 2009)
::中国(2009年)11.8%
27.2%
Egypt (in 2008)
::埃及(2008年)1.7%
15.4%
India (in 2010)
::印度(2010年)32.7%
68.8%
Mexico (in 2010)
::墨西哥(2010年)0.7%
4.5%
Nigeria (in 2010)
::尼日利亚(2010年)68.0%
84.5%
Poverty Lines for Low-Income Countries, mid-2000s(Source: )
::低收入国家的贫困线,2000年代中期(资料来源: )Any poverty line will be somewhat arbitrary, and it is useful to have a poverty line whose basic definition does not change much over time. If Congress voted every few years to redefine what poverty means, then it would be difficult to compare rates over time. After all, would a lower poverty rate mean that the definition had been changed, or that people were actually better off? Government statisticians at the U.S. Census Bureau have ongoing research programs to address questions like these.
::任何贫困线都将是任意的,而且制定一条基本定义不会随时间而改变的贫困线是有用的。 如果国会每几年投票一次来重新定义贫困的含义,那么就很难在一段时间内比较贫困率。 毕竟,降低贫困率意味着定义已经改变,还是意味着人们实际上变得更好? 美国人口普查局的政府统计员有持续的研究方案来解决这些问题。- Video: Poverty Rates Surge in American Suburbs
The Poverty Trap
::贫困陷阱Can you give people too much help, or the wrong kind of help? When people are provided with food, shelter, healthcare, income, and other necessities, assistance may reduce their incentive to work. Consider a program to fight poverty that works in this reasonable-sounding manner: the government provides assistance to the poor, but as the poor earn income to support themselves, the government reduces the level of assistance it provides. With such a program, every time a poor person earns $100, the person loses $100 in government support. As a result, the person experiences no net gain for working. Economists call this problem the poverty trap .
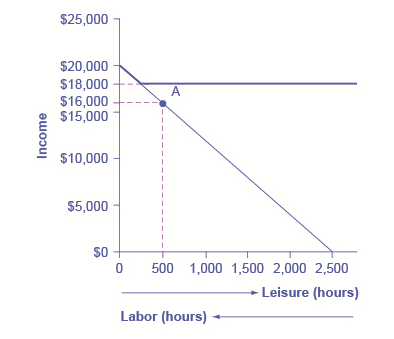
::你能给人们太多帮助,还是错误的帮助?当人们获得食物、住所、医疗保健、收入和其他必需品时,援助可能会减少他们工作的动力。 考虑一个以合理、合理的方式运作的消除贫困方案:政府向穷人提供援助,但随着穷人赚取收入来养活自己,政府会降低它所提供的援助水平。 有了这样一个方案,穷人每次挣100美元,政府支助就会损失100美元。 结果,人们在工作上没有净收益。 经济学家们将这个问题称为贫困陷阱。Consider the situation faced by a single-parent family such as a single mother (earning $8 an hour) with two children, as illustrated in 2. First, consider the labor-leisure budget constraint faced by this family in a situation without government assistance. On the horizontal axis is hours of leisure (or time spent with family responsibilities) increasing in quantity from right to left. Also on the horizontal axis is the number of hours at paid work, going from zero hours on the right to the maximum of 2,500 hours on the left. On the vertical axis is the amount of income per year rising from low to higher amounts of income. The budget constraint line shows that at zero hours of leisure and 2,500 hours of work, the maximum amount of income is $20,000 ($8 × 2,500 hours). At the other extreme of the budget constraint line, an individual would work zero hours, earn zero income, but enjoy 2,500 hours of leisure. At point A on the budget constraint line, by working 40 hours a week, 50 weeks a year, the utility-maximizing choice is to work a total of 2,000 hours per year and earn $16,000.
::考虑单亲家庭,如单身母亲(每小时8美元)和两个孩子所面临的情况,如第2段所示,第一,考虑该家庭在没有政府援助的情况下所面临的劳动休息预算限制;横向轴线是从右向左增加闲暇时间(或承担家庭责任的时间),从右向左增加数量;横向轴线是有偿工作小时数,从右零小时到左最多2 500小时;纵向轴线是每年收入数额从低到较高;预算制约线显示,在零闲暇时间和2 500小时工作的情况下,最高收入额为20 000美元(8 × 2 500小时);在预算制约线的另一极端,个人工作零小时,赚取零收入,但享受2 500小时的闲暇;在预算制约线的A点,每周工作40小时,每年50周,效用最大化的选择是每年工作总共2 000小时,赚取16 000美元。Now suppose that a government anti-poverty program guarantees every family with a single mother and two children $18,000 in income. This is represented on the graph by a horizontal line at $18,000. With this program, each time the mother earns $1,000, the government will deduct $1,000 of its support. 3 shows what will happen at each combination of work and government support.
::现在假设政府除贫方案能保障每个有单身母亲和两个孩子的家庭的收入为18 000美元。 图表上以水平线表示,其水平线为18 000美元。 有了这个方案,每次母亲挣1 000美元,政府就会扣除1 000美元的支持。 3 显示在工作和政府支助的每一种组合中会发生什么。- The Poverty Trap in Action
The original choice is 500 hours of leisure, 2,000 hours of work at point A, and income of $16,000. With a guaranteed income of $18,000, this family would receive $18,000 whether it provides zero hours of work or 2,000 hours of work. Only if the family provides, say, 2,300 hours of work does its income rise above the guaranteed level of $18,000—and even then, the marginal gain to income from working many hours is small.
::最初的选择是500小时的闲暇、在A点的2 000小时的工作时间和16 000美元的收入。如果有18 000美元的保证收入,这个家庭将获得18 000美元的收入,无论它提供零小时的工作时间还是2 000小时的工作时间。 只有家庭提供2 300小时的工作,收入才能超过18 000美元的保障水平 — — 即便如此,从许多小时工作获得的边际收入也很小。Amount Worked (hours)
::工作数量(小时)Total Earnings
::收入共计Government Support
::政府支助Total Income
::收入共计0
0
$18,000
$18,000
500
$4,000
$14,000
$18,000
1,000
$8,000
$10,000
$18,000
1,500
$12,000
$6,000
$18,000
2,000
$16,000
$2,000
$18,000
2,500
$20,000
0
$20,000
Total Income at Various Combinations of Work and Support
The new budget line, with the antipoverty program in place, is the horizontal and heavy line that is flat at $18,000. If the mother does not work at all, she receives $18,000, all from the government. If she works full time, giving up 40 hours per week with her children, she still ends up with $18,000 at the end of the year. Only if she works 2,300 hours in the year—which is an average of 44 hours per week for 50 weeks a year—does household income rise to $18,400. Even in this case, all of her year’s work means that household income rises by only $400 over the income she would receive if she did not work at all. She would need to work 50 hours a week to reach $20,000.
::新的预算项目,即除贫计划已经到位,是横向和重线,平定为18 000美元;如果母亲根本不工作,她从政府那里得到18 000美元;如果她全时工作,每周与孩子一起放弃40小时,到年底她仍然有18 000美元;只有她每年工作2 300小时——平均每周44小时,每年50周——家庭收入增加到18 400美元;即使在这种情况下,她一年的全部工作意味着家庭收入只比如果她不工作的话收入增加400美元。 她需要每周工作50小时才能达到20 000美元。Indeed, the poverty trap is even stronger than this simplified example shows, because a working mother will have extra expenses like clothing, transportation, and child care that a nonworking mother will not face, making the economic gains from working even smaller. Moreover, those who do not work fail to build up job experience and contacts, which makes working in the future even less likely.
::事实上,贫困陷阱甚至比这个简化例子更强大,因为工作母亲将拥有衣着、交通和儿童保育等额外开支,而无工作母亲将无法面对这些开支,从而使工作带来的经济收益更小。 此外,不工作的母亲无法积累工作经验和接触,这使得未来工作的可能性更小。The bite of the poverty trap can be reduced by designing an antipoverty program so that, instead of reducing government payments by $1 for every $1 earned, payments are reduced by some smaller amount instead. The bite of the poverty trap can also be reduced by imposing requirements for work as a condition of receiving benefits and setting a time limit on benefits.
::贫困陷阱的咬痕可以通过设计一个除贫方案来减少,这样,政府支付的工资不是每挣一美元就减少一美元,而是减少一美元。 贫困陷阱的咬痕也可以通过规定工作要求作为领取福利的条件和对福利设定时限来减少。4 illustrates a government program that guarantees $18,000 in income, even for those who do not work at all, but then reduces this amount by 50 cents for each $1 earned. The new, higher budget line in 4 shows that, with this program, additional hours of work will bring some economic gain. Because of the reduction in government income when an individual works, an individual earning $8.00 will really net only $4.00 per hour. The vertical intercept of this higher budget constraint line is at $28,000 ($18,000 + 2,500 hours × $4.00 = $28,000). The horizontal intercept is at the point on the graph where $18,000 and 2500 hours of leisure is set. 4 shows the total income differences with various choices of labor and leisure.
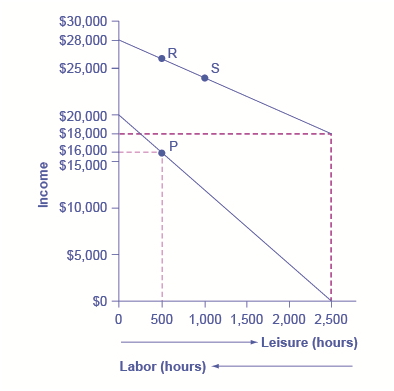
::4 说明一个政府方案,该方案保证收入18 000美元,即使那些根本不工作的人也是如此,但随后每挣一美元就减少50美分。 4个新的、更高的预算项目显示,有了这个方案,额外工作时间将带来一些经济收益。由于个人工作时政府收入的减少,个人每小时收入8.00美元实际上只净值4.00美元。这个较高的预算限制项目纵向拦截费用为28 000美元(18 000美元+2 500小时×4.00美元=28 000美元)。 横向拦截是在图中设定的18 000美元和25小时闲暇时间的点。 4 显示各种劳动和休闲选择的总收入差异。However, this type of program raises other issues. First, even if it does not eliminate the incentive to work by reducing government payments by $1 for every $1 earned, enacting such a program may still reduce the incentive to work. At least some people who would be working 2,000 hours each year without this program might decide to work fewer hours but still end up with more income—that is, their choice on the new budget line would be like S, above and to the right of the original choice P. Of course, others may choose a point like R, which involves the same amount of work as P, or even a point to the left of R that involves more work.
::但是,这种类型的方案也引起了其他问题。 首先,即使它没有通过将政府工资每挣一美元减少1美元来消除工作激励,但制定这样的方案仍可能降低工作激励。 至少有些每年工作2 000小时而没有这个方案的人可能决定减少工作时间,但最终仍然拥有更多的收入 — — 也就是说,他们在新的预算项目上的选择会像S, 以及最初选择P的权利。 当然,其他人可以选择R这样的点,它涉及与P相同的工作量,甚至可以选择R左边的某个点,它涉及更多的工作。The second major issue is that when the government phases out its support payments more slowly, the antipoverty program costs more money. Still, it may be preferable in the long run to spend more money on a program that retains a greater incentive to work, rather than spending less money on a program that nearly eliminates any gains from working.
::第二个主要问题是,当政府逐步更缓慢地停止其支助性付款时,除贫方案的成本会更高。 但从长远看,最好花更多的钱给一个保持更大工作激励力的方案,而不是花更少的钱给一个几乎消除工作收益的方案。Loosening the Poverty Trap: Reducing Government Assistance by 50 Cents for Every $1 Earned
::放松贫困陷阱:将政府援助减少50美分,每1美元收入减少50美分On the original labor-leisure opportunity set, the lower budget set shown by the smaller dashed line in the figure, the preferred choice P is 500 hours of leisure and $16,000 of income. Then, the government created an antipoverty program that guarantees $18,000 in income even to those who work zero hours, shown by the larger dashed line. In addition, every $1 earned means phasing out 50 cents of benefits. This program leads to the higher budget set shown in the diagram. The hope is that this program will provide incentives to work the same or more hours, despite receiving income assistance. However, it is possible that the recipients will choose a point on the new budget set like S, with less work, more leisure, and greater income, or a point like R, with the same work and greater income.
::在最初的劳动休息机会设定上,由数字中较小的破折线线所显示的较低预算设定,首选选择P为500小时的休闲时间和16,000美元的收入。 然后,政府制定了一个除贫方案,保证收入为18,000美元,即使那些工作零小时的人也是如此,如更大的破折线所示。 此外,每一美元就意味着逐步取消50美分的福利。这个方案导致图表中列出更高的预算。希望这个方案能激励那些工作相同或更多小时的工作,尽管得到了收入援助。 但是,在新的预算设定上,接受者有可能选择一个点,比如S,减少工作,增加闲暇,增加收入,或者像R那样的工作,增加收入。Amount Worked (hours)
::工作数量(小时)Total Earnings
::收入共计Government Support
::政府支助Total Income
::收入共计0
0
$18,000
$18,000
500
$4,000
$16,000
$20,000
1,000
$8,000
$14,000
$22,000
1,500
$12,000
$12,000
$24,000
2,000
$16,000
$10,000
$26,000
2,500
$20,000
$8,000
$28,000
The Labor-Leisure Tradeoff with Assistance Reduced by 50 Cents for Every Dollar Earned
Next we will consider a variety of government support programs focused specifically on the poor, including welfare, SNAP (food supplement), Medicaid, and the earned income tax credit (EITC). Although these programs vary from state to state, it is generally a true statement that in many states from the 1960s into the 1980s, if poor people worked, their level of income barely rose—or did not rise at all—after the reduction in government support payments was factored in. The following Work It Out feature shows how this happens.
::接下来,我们将考虑专门针对穷人的各种政府支助方案,包括福利、食品补贴、医疗补助和收入所得税抵免(EITC ) 。 尽管这些方案在州与州之间各不相同,但通常真实的说法是,从1960年代到1980年代,在许多州,如果穷人工作,他们的收入水平在扣除政府支助支付额之后几乎没有上升,或者根本没有上升。 接下来的工作“Out”特征说明了这种情况是如何发生的。Work It Out: The Safety Net
::工作:安全网The U.S. government has implemented a number of programs to assist those below the poverty line and those who have incomes just above the poverty line, who are referred to as the near-poor. Such programs are called the safety net , in recognition of the fact that they offer some protection for those who find themselves without jobs or income.
::美国政府实施了一系列方案来帮助那些生活在贫困线以下的人和那些收入略高于贫困线的人,他们被称为接近穷人。 这些方案被称为安全网,承认它们为那些没有工作或收入的人提供了某种保护。-
Temporary Assistance for Needy Families (TANF)
::贫困家庭临时援助(TANF)
From the Great Depression of the 1930s until 1996, the United States’ most visible antipoverty program was Aid to Families with Dependent Children (AFDC), which provided cash payments to mothers with children who were below the poverty line. This program was often just called “welfare.” In 1996, Congress passed and President Bill Clinton signed into law the Personal Responsibility and Work Opportunity Reconciliation Act, more commonly called the “welfare reform act.” The new law replaced AFDC with Temporary Assistance for Needy Families (TANF).
::从1930年代的大萧条到1996年,美国最引人注目的除贫计划是援助有受抚养子女的家庭(AFDC ) , 向有生活在贫困线以下子女的母亲提供现金支付。 这个计划常常被称为“福利 ” 。 1996年国会通过,克林顿总统签署了《个人责任和工作机会和解法案 》 , 更常见的被称为“福利改革法案 ” 。 新法律用临时帮助贫困家庭取代了AFDC 。TANF brought several dramatic changes in how welfare operated. Under the old AFDC program, states set the level of welfare benefits that they would pay to the poor, and the federal government guaranteed it would chip in some of the money as well. The federal government’s welfare spending would rise or fall depending on the number of poor people, and on how each state set its own welfare contribution.
::TANF在福利运作方式上带来了一些巨大的变化。 在旧的AFDC计划下,各州设定了他们向穷人支付的福利水平,联邦政府也保证了这一水平会影响到部分资金。 联邦政府的福利支出将随着穷人人数的增加或下降,以及每个州如何设定自己的福利捐款。Under TANF, however, the federal government gives a fixed amount of money to each state. The state can then use the money for almost any program with an antipoverty component: for example, the state might use the money to give cash to poor families or to reduce teenage pregnancy, or even to raise the high school graduation rate. However, the federal government imposed two key requirements. First, if states are to keep receiving the TANF grants, they must impose work requirements so that most of those receiving TANF benefits are working (or attending school). Second, no one can receive TANF benefits with federal money for more than a total of five years over his or her lifetime. The old AFDC program had no such work requirements or time limits.
::但是,根据《德黑兰联邦法》,联邦政府向每个州提供固定数额的资金。然后,州可以将这笔资金用于几乎任何含有除贫内容的方案:例如,州可以将这笔资金用于向贫困家庭提供现金或减少少女怀孕,甚至提高高中毕业率。然而,联邦政府规定了两项关键要求。第一,如果州要继续获得TANF赠款,它们必须规定工作要求,以便接受TANF福利的大多数人能够工作(或上学 ) 。 其次,任何人在其一生中,用联邦资金获得TANF福利的时间总共不得超过五年。 旧的AFDC方案没有这样的工作要求或时限。TANF attempts to avoid the poverty trap by requiring that welfare recipients work and by limiting the length of time they can receive benefits. In its first few years, the program was quite successful. The number of families receiving payments in 1995, the last year of AFDC, was 4.8 million. By 2012, according to the Congressional Research Service, the average number of families receiving payments under TANF was 1.8 million—a decline of more than half.
::TANF试图避免贫困陷阱,要求福利领取者工作,并限制他们领取福利的时间,在最初几年中,该方案相当成功,1995年,即AFDC的最后一年,领取津贴的家庭数量为480万,到2012年,根据国会研究服务局的数据,领取TANF津贴的家庭平均数量为180万,下降了一半以上。TANF benefits to poor families vary considerably across states. For example, again according to the Congressional Research Service, in 2011 the highest monthly payment in Alaska to a single mother with two children was $923, while in Mississippi the highest monthly payment to that family was $170. These payments reflect differences in states’ cost of living. Total spending on TANF was approximately $16.6 billion in 1997. As of 2012, spending was at $12 billion, an almost 28% decrease, split about evenly between the federal and state governments. When you take into account the effects of inflation, the decline is even greater. Moreover, there seemed little evidence that poor families were suffering a reduced standard of living as a result of TANF—although, on the other side, there was not much evidence that poor families had greatly improved their total levels of income, either.
::各州对贫困家庭的TANF福利差异很大。 比如,根据国会研究服务局的数据,2011年阿拉斯加州对一个有两个孩子的单身母亲的月工资最高为923美元,而在密西西比州,该家庭的月工资最高为170美元。 这些支出反映了各州生活费用的差异。 1997年,TANF的总支出约为166亿美元。 截至2012年,支出为120亿美元,下降近28 % , 联邦政府和州政府平分。 考虑到通货膨胀的影响,下降幅度甚至更大。 此外,似乎几乎没有证据表明贫困家庭因为TANF而生活水平下降 — — 尽管在另一方面,没有多少证据表明贫困家庭的收入总量大幅提高。Video: Welfare Reform 20 Years Later
::影片:20年后的福利改革-
The Earned Income Tax Credit (EITC)
::收入所得税抵免(EITC)
The earned income tax credit (EITC), first passed in 1975, is a method of assisting the working poor through the tax system. The EITC is one of the largest assistance programs for low-income groups, and projections for 2013 expected 26 million households to take advantage of it at an estimated cost of $50 billion. In 2013, for example, a single parent with two children would have received a tax credit of $5,372 up to an income level of $17,530. The amount of the tax break increases with the amount of income earned, up to a point. The earned income tax credit has often been popular with both economists and the general public because of the way it effectively increases the payment received for work.
::收入税抵免(EITC)于1975年首次通过,是通过税收制度帮助贫困劳动者的一种方法。 收入税抵免(EITC)是低收入群体的最大援助计划之一,预计2013年将有2,600万户家庭利用这项抵免,估计成本为500亿美元。 比如,2013年,有两个孩子的单亲父母将获得5,372美元的税收抵免,最高可达17,530美元的收入水平。税抵免额与收入额相加,最高可达17,530美元。 收入所得税抵免额经常受到经济学家和一般公众的欢迎,因为收入税抵免能有效增加工作报酬。What about the danger of the poverty trap that every additional $1 earned will reduce government support payments by close to $1? To minimize this problem, the earned income tax credit is phased out slowly. According to the Tax Policy Center, for a single-parent family with two children in 2013, the credit is not reduced at all (but neither is it increased) as earnings rise from $13,430 to $17,530. Then, for every $1 earned above $17,530, the amount received from the credit is reduced by 21.06 cents, until the credit phases out completely at an income level of $46,227.
::贫困陷阱的危险在于,每多挣一美元就能减少政府支助付款近1美元? 为尽量减少这一问题,赚取的收入税抵免将逐步逐步取消。 根据税收政策中心,对于2013年有两个孩子的单亲家庭,信贷不会因为收入从13 430美元增加到17 530美元而减少(但也不会增加 ) 。 然后,每赚一美元超过17 530美元,从信贷获得的金额将减少21.06美分,直到信贷完全以46 227美元的收入水平结束。5 illustrates that the earned income tax credits, child tax credits, and the TANF program all cost the federal government money—either in direct outlays or in loss of tax revenues. CTC stands for the government tax cuts for the child tax credit.
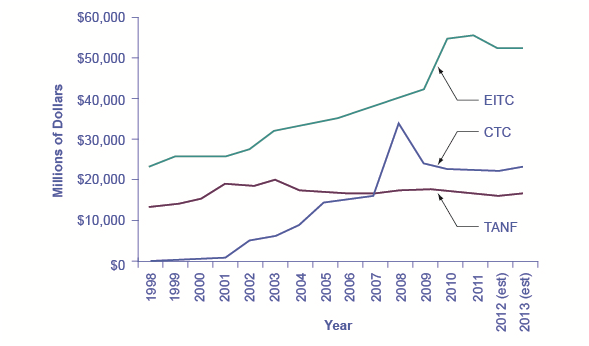
::5 说明收入所得税抵免、儿童税抵免和TANF方案都花费联邦政府资金——无论是直接支出还是税收损失。 反恐委员会支持政府削减儿童税抵免的税收。Real Federal Spending on CTC, EITC, and TANF, 1975-2013
::1975-2013年联邦在反恐委员会、贸易分类和德黑兰联邦银行的实际支出,1975-2013年EITC increased from more than $20 billion in 2000 to over an estimated $50 billion by 2013, far exceeding estimated 2013 outlays in the CTC (Child Tax Credits) and TANF of over $20 billion and $10 billion, respectively. (Source: Office of Management and Budget)
In recent years, the EITC has become a hugely expensive government program for providing income assistance to the poor and near-poor, costing about $60 billion in 2012. In that year, the EITC provided benefits to about 27 million families and individuals and, on average, is worth about $2,296 per family (with children), according to the Tax Policy Center. One reason that the TANF law worked as well as it did is that the EITC was greatly expanded in the late 1980s and again in the early 1990s, which increased the returns to work for low-income Americans.
::近年来,印约理事会已成为为穷人和近乎穷人提供收入援助的耗资巨大的政府方案,2012年耗资约600亿美元。 2012年,印约理事会向大约2,700万个家庭和个人提供了福利,根据税收政策中心的数据,平均每户家庭(有子女)约值2,296美元。 《德黑兰贸易基金法》行之有效的一个原因是,在1980年代末和1990年代初,印约理事会大幅扩展,增加了低收入美国人的工作回报。Video: How Do Food Stamps Work?
::录像:食物印章如何运作?-
Supplemental Nutrition Assistance Program (SNAP)
::补充营养援助方案
Often called “food stamps,” Supplemental Nutrition Assistance Program (SNAP) is a federally funded program, started in 1964, in which each month poor people receive a card like a debit card that they can use to buy food. The amount of food aid for which a household is eligible varies by income, number of children, and other factors, but households are generally expected to spend about 30% of their own net income on food, and if 30% of their net income is not enough to purchase a nutritionally adequate diet, then those households are eligible for SNAP.
::补充营养援助方案(SNAP)通常被称为“粮食邮票 ” , 是一个联邦资助的方案,始于1964年,在该方案中,穷人每月领取一张卡片,像借记卡一样,他们可以用来购买食物。 家庭有资格领取的粮食援助数额因收入、子女人数和其他因素而异,但一般预期家庭将自己净收入的30%用于食品,如果其净收入的30%不足以购买营养适足的饮食,那么这些家庭就有资格享受SNAP。SNAP can contribute to the poverty trap. For every $100 earned, the government assumes that a family can spend $30 more for food, and thus reduces its eligibility for food aid by $30. This decreased benefit is not a complete disincentive to work—but combined with how other programs reduce benefits as income increases, it adds to the problem. SNAP, however, does try to address the poverty trap with its own set of work requirements and time limits.
::SNAP可以助长贫困陷阱。 每赚到100美元,政府就假设一个家庭可以多花30美元用于食品,从而将获得粮食援助的资格降低30美元。 这一减少的福利并不是完全抑制工作,而是与其他方案如何随着收入增加而减少福利相结合,这加剧了问题。 然而,SNAP确实试图用自己的一套工作要求和时限来解决贫困陷阱问题。Why give debit cards and not just cash? Part of the political support for SNAP comes from a belief that since the cards must be spent on food, they cannot be “wasted” on other forms of consumption. From an economic point of view, however, the belief that cards must increase spending on food seems wrong-headed. After all, say that a poor family is spending $2,500 per year on food, and then it starts receiving $1,000 per year in SNAP aid. The family might react by spending $3,500 per year on food (income plus aid), or it might react by continuing to spend $2,500 per year on food, but use the $1,000 in food aid to free up $1,000 that can now be spent on other goods. So it is reasonable to think of SNAP cards as an alternative method, along with TANF and the earned income tax credit, of transferring income to the working poor.
::为何要给借记卡,而不只是现金? 对SNAP的政治支持部分来自这样一种信念:既然卡必须花在食品上,就不能在其他形式的消费上“浪费 ” 。 然而,从经济观点看,卡必须增加食品支出的信念似乎是错误的。 毕竟,说一个贫困家庭每年花在食品上2 500美元,然后开始每年领取1 000美元SNAP援助。 家庭可能会通过每年花3 500美元购买食品(收入加援助 ) , 或者通过继续每年花2 500美元购买食品来作出反应,但用1 000美元的粮食援助来释放1 000美元现在可以花在其他商品上。 因此,将SNAP卡连同TANF和赚取的收入税抵免税,视为将收入转移给贫困劳动者的一种替代方法是合理的。Indeed, anyone eligible for TANF is also eligible for SNAP, although states can expand eligibility for food aid if they wish to do so. In some states, where TANF welfare spending is relatively low, a poor family may receive more in support from SNAP than from TANF. In 2012, about 46.6 million people received food aid at an annual cost of about $74.6 billion, with an average monthly benefit of about $287 per person per month. SNAP participation increased by 70% between 2007 and 2011, from 26.6 million participants to 45 million. According to the Congressional Budget Office, this dramatic rise in participation was caused by the Great Recession of 2008–2009 and rising food prices.
::事实上,任何有资格获得TANF的人也有资格获得SNAP,尽管如果国家愿意的话,它们可以扩大获得粮食援助的资格。 在某些州,TANP福利支出相对较低,贫困家庭从SNAP得到的支持可能比TANF多。 2012年,大约4660万人获得粮食援助,每年费用约为746亿美元,平均每月人均287美元。 SNAP的参与在2007年至2011年间增加了70%,从2,660万参与者增加到4,500万。 据国会预算办公室称,参与人数剧增的原因是2008-2009年大衰退和粮价上涨。The federal government deploys a range of income security programs that are funded through departments such as Health and Human Services, Agriculture, and Housing and Urban Development (HUD) (see 6). According to the Office of Management and Budget, collectively, these three departments provided an estimated $62 billion of aid through programs such as supplemental feeding programs for women and children, subsidized housing, and energy assistance. The federal government also transfers funds to individual states through special grant programs.
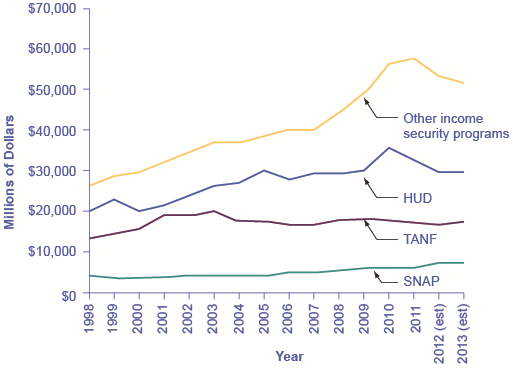
::联邦政府部署了一系列收入保障方案,这些方案通过卫生与公众服务、农业、住房和城市发展等部门提供资金(见6),据管理和预算办公室称,这三个部门通过妇女和儿童补充营养餐方案、补贴住房和能源援助等方案,共同提供了约620亿美元的援助,联邦政府还通过特别赠款方案向各州转移资金。Expenditure Comparison of TANF, SNAP, HUD, and Other Income Security Programs, 1988–2013 (est.)
::TANF、SNAP、HUD和其他收入保障方案的支出比较,1988-2013年(截至2013年)Total expenditures on income security continued to rise between 1988 and 2010, while payments for TANF have increased from $13 billion in 1998 to an estimated $17.3 billion in 2013. SNAP has seen relatively small increments. These two programs comprise a relatively small portion of the estimated $106 billion dedicated to income security in 2013. Note that other programs and housing programs increased dramatically during the 2008 and 2010 time periods. (Source: Table 12.3 Section 600 Income Security, http://www.whitehouse.gov/sites/default/files/omb/budget/fy2013/assets/hist.pdf)
The safety net includes a number of other programs: government-subsidized school lunches and breakfasts for children from low-income families; the Special Supplemental Food Program for Women, Infants and Children (WIC), which provides food assistance for pregnant women and newborns; the Low Income Home Energy Assistance Program, which provides help with home heating bills; housing assistance, which helps pay the rent; and Supplemental Security Income, which provides cash support for the disabled and the elderly poor.
::安全网包括其他一些方案:政府为低收入家庭儿童补贴的学校午餐和早餐;妇女、婴儿和儿童特别补充食品方案(WIC),该方案向孕妇和新生儿提供食品援助;低收入家庭能源援助方案,该方案为家庭取暖费提供帮助;住房援助,该方案帮助支付房租;补充安全收入,该方案向残疾人和老年穷人提供现金支助。Video: Understanding Healthcare Costs: Medicaid
::视频:了解保健费用:医疗补助-
Medicaid
::医疗补助
Medicaid was created by Congress in 1965 and is a joint health insurance program entered into by both the states and the federal government. The federal government helps fund Medicaid, but each state is responsible for administering the program, determining the level of benefits, and determining eligibility. It provides medical insurance for certain low-income people, including those below the poverty line, with a focus on families with children, the elderly, and the disabled. About one-third of Medicaid spending is for low-income mothers with children. While an increasing share of the program funding in recent years has gone to pay for nursing home costs for the elderly poor. The program ensures that a basic level of benefits is provided to Medicaid participants, but because each state sets eligibility requirements and provides varying levels of service, the program differs from state to state.
::医疗补助计划是1965年国会创立的,是各州和联邦政府共同制定的一项医疗保险计划。联邦政府帮助为医疗补助提供资金,但各州负责实施该计划,确定福利水平和资格。它为某些低收入人群,包括贫困线以下的人提供医疗保险,重点是有子女、老年人和残疾人的家庭。医疗补助开支的大约三分之一用于有子女的低收入母亲。近年来,医疗补助计划资金中越来越多的部分用于为老年穷人支付养老院费用。该计划确保向医疗补助参与者提供基本的福利水平,但由于各州规定了资格要求,并提供了不同水平的服务,因此该方案因州而异。In the past, a common problem has been that many low-paying jobs pay enough to a breadwinner so that a family could lose its eligibility for Medicaid, yet the job does not offer health insurance benefits. A poor parent considering such a job might choose not to work rather than lose health insurance for his or her children. In this way, health insurance can become a part of the poverty trap. Many states recognized this problem in the 1980s and 1990s and expanded their Medicaid coverage to include not just the poor, but the near-poor earning up to 135% or even 185% of the poverty line. Some states also guaranteed that children would not lose coverage if their parents worked.
::过去,一个共同的问题是,许多低薪工作给养家糊口的人支付足够多的工资,使家庭可能失去享受医疗补助的资格,但工作却不能提供医疗保险福利。 认为这种工作的贫穷父母可能选择不工作,而不是失去子女的医疗保险。 这样,医疗保险就可能成为贫困陷阱的一部分。 许多州在1980年代和1990年代都认识到了这个问题,并且扩大了医疗补助的覆盖范围,不仅包括穷人,还包括收入高达贫困线135 % 甚至185%的近穷人。 有些州还保证如果父母工作,儿童不会失去保险。These expanded guarantees cost the government money, of course, but they also helped to encourage those on welfare to enter the labor force. As of 2012, approximately 67 million people participated in Medicaid. Of those enrolled, almost half are children. Healthcare expenditures, however, are highest for the elderly population, which comprises approximately 25% of participants. As 7 (a) indicates, the largest number of households that enroll in Medicaid are those with children. Lower-income adults are the next largest group enrolled in Medicaid at 28%. The blind and disabled are 16% of those enrolled, and seniors are 9% of those enrolled. 7 (b) shows how much actual Medicaid dollars are spent for each group. Out of total Medicaid spending, more is spent on seniors (20%) and the blind and disabled (44%). So, 64% of all Medicaid spending goes to seniors, the blind, and disabled. Children receive 21% of all Medicaid spending, followed by adults at 15%.
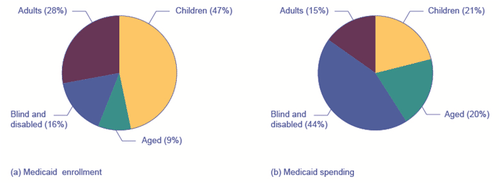
::当然,这些扩大的保障使政府付出了钱财,但是它们也帮助鼓励福利人群加入劳动力队伍。截至2012年,约有6 700万人参加了医疗援助计划,其中近6 700万人是儿童,近一半是儿童。但是,保健支出在老年人口中最高,约占参与者的25%。如7(a)所示,加入医疗援助计划的家庭中,有儿童的家庭数量最多;低收入成年人是医疗援助计划注册人数第二大群体,占28%;盲人和残疾人占注册人数的16%,老年人占9%。7(b)显示医疗援助计划每个群体的实际支出额。在医疗援助总支出中,老年人(20%)和盲人和残疾人(44%)支出更多。因此,医疗援助计划所有支出的64%用于老年人、盲人和残疾人。儿童获得医疗援助计划所有支出的21%,其次是成年人,占15%。- Medicaid Enrollment and Spending
Part (a) shows the Medicaid enrollment by different populations, with children comprising the largest percentage at 47%, followed by adults at 28%, and the blind and disabled at 16%. Part (b) shows that Medicaid spending is principally for the blind and disabled, followed by the elderly. Although children are the largest population covered by Medicaid, expenditures on children are only at 21%.
:a)部分显示不同人口的医疗补助入学率,儿童占最大比例,为47%,成人占28%,盲人和残疾人占16%,(b)部分显示医疗补助主要用于盲人和残疾人,其次是老年人,虽然儿童是医疗补助覆盖的最大人口,但儿童开支仅为21%。
Income Inequality: Measurement and Causes
::收入不平等:计量和原因Poverty levels can be subjective based on the overall income levels of a country; typically poverty is measured based on a percentage of the median income. Income inequality, however, has to do with the distribution of that income, in terms of which group receives the most or the least income. Income inequality involves comparing those with high incomes, middle incomes, and low incomes—not just looking at those below or near the poverty line. In turn, measuring income inequality means dividing up the population into various groups and then comparing the groups.
::收入不平等与收入分配有关,而收入不平等则与收入分配有关,按收入分配而言,这一群体收入最多或最少,收入不平等涉及比较高收入、中等收入和低收入者,而不只是看贫穷线以下或接近贫穷线的人,而衡量收入不平等则意味着将人口分成不同群体,然后比较各群体。Why did inequality of household income increase in the United States in recent decades? Indeed, a trend toward greater income inequality has occurred in many countries around the world, although the effect has been more powerful in the U.S. economy. Economists have focused their explanations for the increasing inequality on two factors that changed more or less continually from the 1970s into the 2000s. One set of explanations focuses on the changing shape of American households; the other focuses on greater inequality of wages, what some economists call “winner take all” labor markets. We will begin with how we measure inequality, and then consider the explanations for growing inequality in the United States.
::美国家庭收入不平等近几十年来为何会增加? 事实上,尽管其影响在美国经济中更为强大,但世界许多国家都出现了收入不平等加剧的趋势。 经济学家们将不平等加剧的解释集中在两个因素上,这两个因素从1970年代到2000年代一直或多或少地不断发生变化。 一套解释侧重于美国家庭不断变化的形式;另一套解释侧重于工资不平等的加剧,而另一些则侧重于工资不平等的加剧,一些经济学家称之为“赢家抓住所有”劳动力市场。 我们将从我们如何衡量不平等开始,然后考虑美国不平等加剧的原因。Visit the for more information on U.S. poverty.
::访问有关美国贫困问题的更多信息。Separating Poverty and Income Inequality
::脱贫和收入不平等Poverty can change even when inequality does not move at all. Imagine a situation in which income for everyone in the population declines by 10%. Poverty would rise, since a greater share of the population would now fall below the poverty line. However, inequality would be the same, because everyone suffered the same proportional loss. Conversely, a general rise in income levels over time would keep inequality the same, but reduce poverty.
::即便不平等没有发生任何变化,贫困也会改变。 想象一下人口中每个人的收入都会下降10 % 。 贫困将会增加,因为现在有更大比例的人口将下降到贫困线以下。 然而,不平等会是一样的,因为每个人都遭受同样的比例损失。 相反,收入水平的普遍上升会让不平等维持不变,但会减少贫困。It is also possible for income inequality to change without affecting the poverty rate. Imagine a situation in which a large number of people who already have high incomes increase their incomes by even more. Inequality would rise as a result—but the number of people below the poverty line would remain unchanged.
::收入不平等也有可能在不影响贫困率的情况下发生变化,想象一下已经高收入的许多人的收入会增加更多,因此不平等会加剧,但生活在贫困线以下的人数将保持不变。Lorenz Curve
::Lorenz 曲线The data on income inequality can be presented in various ways. For example, you could draw a bar graph that showed the share of income going to each fifth of the income distribution. 8 presents an alternative way of showing inequality data in what is called a Lorenz curve . The Lorenz curve shows the cumulative share of the population on the horizontal axis and the cumulative percentage of total income received on the vertical axis.
::有关收入不平等的数据可以不同方式提供。例如,您可以绘制一个条形图,显示收入占收入分配的五分之一的份额。 8 提供了另一种方式,在所谓的洛伦茨曲线中显示不平等数据。 Lorenz曲线显示横向轴上人口的累计份额和垂直轴上所得总收入的累计百分比。The Lorenz Curve
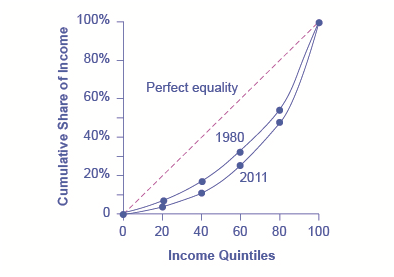
::洛伦茨曲线A Lorenz curve graphs the cumulative shares of income received by everyone up to a certain quintile. The income distribution in 1980 was closer to the perfect equality line than the income distribution in 2011—that is, the U.S. income distribution became more unequal over time.
::洛伦兹曲线图示了每个人在特定五分位数以下所得收入的累计份额。 1980年的收入分配比2011年的收入分配更接近于完全平等线 — — 也就是说,美国的收入分配随着时间的推移变得更加不平等。Every Lorenz curve diagram begins with a line sloping up at a 45-degree angle, shown as a dashed line in 8. The points along this line show what perfect equality of the income distribution looks like. It would mean, for example, that the bottom 20% of the income distribution receives 20% of the total income, the bottom 40% gets 40% of total income, and so on. The other lines reflect actual U.S. data on inequality for 1980 and 2011.
::洛伦茨的每一个曲线图都以45度角的线向上倾斜,在8中以破折线显示,8中显示,这条线的点显示收入分配的完全平等是什么样的。这意味着,例如,收入分配的20%底部收入得到总收入的20%,40%底部收入得到总收入的40%,等等。其他线反映了美国1980年和2011年关于不平等的实际数据。The trick in graphing a Lorenz curve is that you must change the shares of income for each specific quintile, which are shown in the first column of numbers in 5, into cumulative income, shown in the second column of numbers. For example, the bottom 40% of the cumulative income distribution will be the sum of the first and second quintiles; the bottom 60% of the cumulative income distribution will be the sum of the first, second, and third quintiles, and so on. The final entry in the cumulative income column needs to be 100%, because, by definition, 100% of the population receives 100% of the income.
::绘制洛伦茨曲线图解的伎俩是,您必须改变每个特定五分位数的收入份额,每分位数第一栏显示为5分之5, 其为累积收入,第二列显示为数字第二列。例如,累积收入分配的底部40%将是第一和第二五分位数的总和;累积收入分配的底部60%将是第一、第二和第三五分位数之和,等等。累计收入列的最后条目必须是100%,因为根据定义,100%的人口获得100%的收入。Income Category
::收入类别Share of Income in 1980 (%)
::1980年收入份额(%)Cumulative Share of Income in 1980 (%)
::1980年累计收入份额(%)Share of Income in 2011 (%)
::2011年收入份额(%)Cumulative Share of Income in 2011 (%)
::2011年累计收入份额(%)First quintile
::第一五五五分位第一4.2
4.2
3.2
3.2
Second quintile
::第二五五分位五分位五分位二(五分位五分位五分位五分位二)10.2
14.4
8.4
11.6
Third quintile
::第三五五五分层16.8
31.2
14.3
25.9
Fourth quintile
::第四五五五分五层24.7
55.9
23.0
48.9
Fifth quintile
::第五五五五分位五分位五分位五分位五分位五分位五分位五分位五分位五分位五分位五分位五分位五分位五分五分位五分五分五分五分五分五分五分五分五分五分五分五分五分五分五分五分五分五分五分五分五分五分五分五分五分五分五分五分五分五分五分五分五分五分五分五分五分五分五分五分五分五分五分五分五分五分五分五分五分五分五分五分五分五分五分五分五分五分五分五分五分五分五分五分五分五分五五分五五分五分五分五分五分五分五分五分五分五分五分五分五分五分五分五分五分五分五分五分五分五分五分五分五分五分五分五分五五五分五五分五分五分五分五分五分五分五分五分五分五分五分五分五分五分五分五分五分五分五分五分五分五分五分五分五分五分五分五分五分五分五分五分五分五分五分五分五分五分五分五分五分五分五分五分五分五分五分五分五分五分五分五分五分五分五分五分五分五分五分五分五分五分五分五分五分五分五分五分五分五分五分五分五分五分五分五分五分五分五分五分五分五分五分五分五分五分五分五分五分五分五分五分五分五分五分五分五分五分五分五分五分五分五分五五分五分五分五分五分五分五分五分五分五分五分五分五分五分五分五分五分五分五分五分五分五分五分五分五分五分五44.1
100.0
51.1
100.0
Calculating the Lorenz Curve
::计算 Lorenz 曲线In a Lorenz curve diagram, a more unequal distribution of income will loop farther down and away from the 45-degree line, while a more equal distribution of income will move the line closer to the 45-degree line. The greater inequality of the U.S. income distribution between 1980 and 2011 is illustrated in 8 because the Lorenz curve for 2011 is farther from the 45-degree line than the Lorenz curve for 1980. The Lorenz curve is a useful way of presenting the quintile data that provides an image of all the quintile data at once. The next Clear It Up feature shows how income inequality differs in various countries compared to the United States.
::在Lorenz曲线图中,收入分配更加不均的分布将进一步从45度线向下和向外循环,而收入分配更加平等则将线向45度线移动。1980年至2011年期间美国收入分配的不平等程度在8个中显示出来,因为2011年的Lorenz曲线比1980年的Lorenz曲线离45度线更远。Lorenz曲线是展示五分位数数据的有用方法,它一次提供所有五分位数数据图像。下一个清晰的It Up特征显示不同国家的收入不平等与美国不同。Clear It Up: How Does Economic Inequality Vary Around the World?
::清清楚楚:全世界经济不平等状况如何?The U.S. economy has a relatively high degree of income inequality by global standards. As 6 shows, based on a variety of national surveys done for a selection of years in the last five years of the 2000s (with the exception of Germany, and adjusted to make the measures more comparable), the U.S. economy has greater inequality than Germany (along with most Western European countries). The region of the world with the highest level of income inequality is Latin America, illustrated in the numbers for Brazil and Mexico. The level of inequality in the United States is lower than in some of the low-income countries of the world, like China and Nigeria, or some middle-income countries like the Russian Federation. However, not all poor countries have highly unequal income distributions; India provides a counterexample.
::按照全球标准,美国经济的收入不平等程度相对较高。 正如6个例子所示,根据2000年代最后5年中若干年(除德国之外,并经过调整,使措施更具可比性)进行的各类国家调查,美国经济的不平等程度比德国(与大多数西欧国家一样)要大。 收入不平等程度最高的世界地区是拉丁美洲,巴西和墨西哥的数字就说明了这一点。 美国的不平等程度低于世界一些低收入国家,如中国和尼日利亚,或俄罗斯联邦等一些中等收入国家。 然而,并非所有穷国的收入分配高度不平等;印度则提供了相反的例子。Country
::国家Survey Year
::调查年份First Quintile
::第一个五分位Second Quintile
::第二个五分位Third Quintile
::第三个五分位Fourth Quintile
::第四五分位Fifth Quintile
::第五五五分位United States
::美国 美国 美国 美国2011
3.2%
8.4%
14.3%
23.0%
51.1%
Germany
::德国 德国2000
8.5%
13.7%
17.8%
23.1%
36.9%
Brazil
::巴西 巴西2009
2.9%
7.1%
12.4%
19.0%
58.6%
Mexico
::墨西哥 墨西哥 墨西哥 墨西哥 墨西哥2010
4.9%
8.8%
13.3%
20.2%
52.8%
China
::中国 中国 中国 中国 中国 中国 中国2009
4.7%
9.7%
15.3%
23.2%
47.1%
India
::印度 印度 印度2010
8.5%
12.1%
15.7%
20.8%
42.8%
Russia
::俄罗斯 俄罗斯2009
6.1%
10.4%
14.8%
21.3%
47.1%
Nigeria
::尼日利亚 尼日利亚 尼日利亚2010
4.4%
8.3%
13.0%
20.3%
54.0%
Income Distribution in Select Countries(Source: U.S. data from U.S. Census Bureau Table H-2. Other data from The World Bank Poverty and Inequality Data Base,
Video: Record Inequality between Rich and Poor
::录像:记录富人和穷人之间的不平等Causes of Growing Inequality: The Changing Composition of American Households
::不平等加剧的原因:美国家庭组成的变化In 1970, 41% of married women were in the labor force, but by 2011, according to the Bureau of Labor Statistics, 60.2% of married women were in the labor force. One result of this trend is that more households have two earners. Moreover, it has become more common for one high earner to marry another high earner. A few decades ago, the common pattern featured a man with relatively high earnings, such as an executive or a doctor, marrying a woman who did not earn as much, like a secretary or a nurse. Often, the woman would leave paid employment, at least for a few years, to raise a family. However, now doctors are marrying doctors and executives are marrying executives, and mothers with high-powered careers are often returning to work while their children are quite young. This pattern of households with two high earners tends to increase the proportion of high-earning households.
::1970年,41%的已婚妇女在劳动力队伍中工作,但根据劳动统计局的数据,到2011年,60.2%的已婚妇女在劳动力队伍中工作,这一趋势的一个结果是,更多的家庭有两个收入者;此外,一个高收入者与另一个高收入者结婚也越来越普遍。 几十年前,一个收入较高的男子,如行政主管或医生,与一个收入不高的妇女结婚,如秘书或护士。 通常,妇女为了养家而离开有薪工作,至少几年。 然而,现在,医生与医生和管理人员结婚,高收入母亲往往在孩子年幼时返回工作岗位。 高收入者与两个高收入家庭结婚,这往往会增加高收入家庭的比例。According to data in the National Journal, even as two-earner couples have increased, so have single-parent households. Of all U.S. families, 13.1% were headed by single mothers; the poverty rate among single-parent households tends to be relatively high.
::根据《国家日报》的数据,即使双亲夫妇增加,单亲家庭也增加。 在美国所有家庭中,13.1%的户主是单身母亲;单亲家庭的贫困率往往相对较高。These changes in family structure, including the growth of single-parent families who tend to be at the lower end of the income distribution, and the growth of two-career high-earner couples near the top end of the income distribution, account for roughly half of the rise in income inequality across households in recent decades.
::家庭结构的这些变化,包括往往处于收入分配低端的单亲家庭的增长,以及接近收入分配顶端的双职工高薪夫妇的增长,约占近几十年来家庭收入不平等增加的一半。Causes of Growing Inequality: A Shift in the Distribution of Wages
::造成日益加剧的不平等的原因:工资分配的变动Another factor behind the rise in U.S. income inequality is that earnings have become less equal since the late 1970s. In particular, the earnings of high-skilled labor relative to low-skilled labor have increased. Winner-take-all labor markets result from changes in technology, which have increased global demand for “stars,”—whether the best CEO, doctor, basketball player, or actor. One way to measure this change is to take the earnings of workers with at least a four-year college bachelor’s degree (including those who went on and completed an advanced degree) and divide them by the earnings of workers with only a high school degree. The result is that those in the 25–34 age bracket with college degrees earned about 1.67 times as much as high school graduates in 2010, up from 1.59 times in 1995, according to U.S. Census data.
::美国收入不平等上升的另一个因素是,自1970年代末以来,收入已经变得不那么平等。 特别是,高技能劳动力相对于低技能劳动力的收益有所增加。 赢家通吃劳动力市场是技术变革的结果,这增加了全球对“明星 ” — —不管是最好的首席执行官、医生、篮球运动员还是演员 — — 的需求。 衡量这一变化的一个方法就是将至少拥有四年大学学士学位的工人(包括上大学并完成高等学位的工人)的收入除以只有高中学历的工人的收入。 其结果是,2010年,25-34岁有大学学位的毕业生的收入比美国人口普查数据显示的1995年的1.59倍高出约1.67倍。Economists use the demand and supply model to reason through the most likely causes of this shift. According to the National Center for Education Statistics, in recent decades, the supply of U.S. workers with college degrees has increased substantially; for example, 840,000 four-year bachelor’s degrees were conferred on Americans in 1970; in 2009–2010, 1,602,480 such degrees were conferred—an increase of about 90%. In 9, this shift in supply to the right, from S 0 to S 1 , should result in a lower equilibrium wage for high-skilled labor. Thus, the increase in the price of high-skilled labor must be explained by a greater demand, like the movement from D 0 to D 1 . Evidently, combining both the increase in supply and in demand has resulted in a shift from E 0 to E 1 , and a resulting higher wage.
::经济学家利用供需模式来解释这一转变的最可能原因。 根据国家教育统计中心(National Center of Education Center of Education Statistic,Center of Education Statistics,Center of National Education States,Center of Education States,最近几十年来,美国拥有大学学位的工人的供应大幅增加;例如,1970年,美国授予了840,000个四年学士学位;2009-2010年,授予了1,602,480个学士学位 — — 增加了约90 % 。 在9年,从S0到S1, 向右的供给的这一转变应该导致高技能劳动力的平衡工资降低。 因此,高技能劳动力价格的上涨必须归因于更高的需求,比如从D0到D1的更大需求。 显然,将供需增长结合起来的结果是,从E0到E1,导致工资的上升。Why Would Wages Rise for High-Skilled Labor?
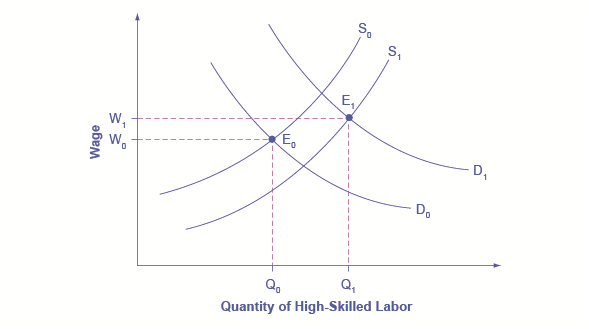
::为什么高技能劳工的工资会上升?The proportion of workers attending college has increased in recent decades, so the supply curve for high-skilled labor has shifted to the right, from S 0 to S 1 . If the demand for high-skilled labor had remained at D 0 , then this shift in supply would have led to lower wages for high-skilled labor. However, the wages for high-skilled labor, especially if there is a large global demand, have increased even with the shift in supply to the right. The explanation must lie in a shift to the right in demand for high-skilled labor, from D 0 to D 1 . The figure shows how a combination of the shift in supply, from S 0 to S 1 , and the shift in demand, from D 0 to D 1 , led to both an increase in the quantity of high-skilled labor hired and also to a rise in the wage for such labor, from W 0 to W 1 .
::上大学的工人比例近几十年来有所增加,因此高技能劳动力的供应曲线已经从S0转向了权利,从S0转向了S1。如果对高技能劳动力的需求保持在D0,那么这种供应的转变会导致高技能劳动力的工资降低。 然而,高技能劳动力的工资,特别是如果全球需求很大的话,随着供应向右的转变,工资也有所增加。 解释必须在于转向对高技能劳动力的需求权,从D0转向D1。 这个数字表明,供应从S0转向S1和需求从D0转向D1的组合如何导致高技能劳动力的聘用量增加,以及此类劳动力的工资从W0上升到W1。What factors would cause the demand for high-skilled labor to rise? The most plausible explanation is that while the explosion in new information and communications technologies over the last several decades has helped many workers to become more productive, the benefits have been especially great for high-skilled workers like top business managers, consultants, and design professionals. The new technologies have also helped to encourage globalization, the remarkable increase in international trade over the last few decades, by making it more possible to learn about and coordinate economic interactions all around the world. In turn, the rising impact of foreign trade in the U.S. economy has opened up greater opportunities for high-skilled workers to sell their services around the world.
::导致高技能劳动力需求上升的因素是什么? 最可信的解释是,尽管过去几十年中新信息和通信技术的爆发帮助了许多工人提高了生产率,但对于高级企业经理、顾问和设计专业人员等高技能工人来说,好处尤其巨大。 新技术还有助于鼓励全球化,即在过去几十年里国际贸易的显著增长,这让全世界更容易了解和协调经济互动。 反过来,美国经济对外贸易的不断上升为高技能工人在世界各地销售服务开辟了更大的机会。The market for high-skilled labor can be viewed as a race between forces of supply and demand. Additional education and on-the-job training will tend to increase the supply of high-skilled labor and to hold down its relative wage. Conversely, new technology and other economic trends like globalization tend to increase the demand for high-skilled labor and push up its relative wage. The greater inequality of wages can be viewed as a sign that demand for skilled labor is increasing faster than supply. On the other hand, if the supply of lower skilled workers exceeds the demand, then average wages in the lower quintiles of the income distribution will decrease. The combination of forces in the high-skilled and low-skilled labor markets leads to increased income disparity.
::高技能劳动力的市场可被视为供求力量之间的竞争; 额外教育和在职培训往往会增加高技能劳动力的供应并抑制相对工资; 相反,新技术和其他经济趋势,如全球化,往往会增加对高技能劳动力的需求并提升其相对工资; 工资不平等的加剧可被视为对熟练劳动力的需求增长快于供应的迹象; 另一方面,如果低技能工人的供应超过需求,收入分配的低五分位的平均工资就会下降; 高技能和低技能劳动力市场的力量加在一起导致收入差距扩大。Video: Wealth Inequality in America
::录像:美国财富不平等Government Policies to Reduce Income Inequality
::减少收入不平等的政府政策No society should expect or desire complete equality of income at a given point in time, for a number of reasons. First, most workers receive relatively low earnings in their first few jobs, higher earnings as they reach middle age, and then lower earnings after retirement. Thus, a society with people of varying ages will have a certain amount of income inequality. Second, people’s preferences and desires differ. Some are willing to work long hours to have income for large houses, fast cars and computers, luxury vacations, and the ability to support children and grandchildren.
::任何社会都不应该期望或渴望在某个时间点实现收入完全平等,原因很多。 首先,大多数工人在头几个工作岗位上的收入相对较低,中等年龄后收入较高,然后退休后收入较低。 因此,不同年龄的人的社会将存在一定程度的收入不平等。 其次,人们的偏好和愿望各不相同。 有些人愿意长时间工作以获得大房子、快车和电脑、奢侈假期的收入,以及抚养子女和孙子的能力。These factors all imply that a snapshot of inequality in a given year does not provide an accurate picture of how people’s incomes rise and fall over time. Even if some degree of economic inequality is expected at any point in time, how much inequality should there be? There is also the difference between income and wealth.
::所有这些因素都意味着,对某一年不平等状况的简单描述并不能准确反映人们的收入如何随时间而上升和下降。 即使预期在任何时刻都会出现某种程度的经济不平等,但应该存在多少不平等? 收入和财富之间也存在差异。How do you Measure Wealth Versus Income Inequality?
::如何衡量财富比收入不平等?Income is a flow of money received, often measured on a monthly or an annual basis; wealth is the sum of the value of all assets, including money in bank accounts, financial investments, a pension fund, and the value of a home. In calculating wealth all debts must be subtracted, such as debt owed on a home mortgage and on credit cards. A retired person, for example, may have relatively little income in a given year, other than a pension or Social Security. However, if that person has saved and invested over time, the person’s accumulated wealth can be quite substantial.
::收入是一种收入流动,通常按月或年度衡量;财富是所有资产价值的总和,包括银行账户、金融投资、养老基金和家庭价值中的货币。 在计算财富时,所有债务都必须扣除,如房屋抵押和信用卡债务。 例如,退休者在特定年份的收入可能相对较少,但养恤金或社会保障除外。 但是,如果此人在一段时间内储蓄和投资,其积累的财富可能相当可观。The wealth distribution is more unequal than the income distribution, because differences in income can accumulate over time to make even larger differences in wealth. However, the degree of inequality in the wealth distribution can be measured with the same tools we use to measure the inequality in the income distribution, like quintile measurements. Data on wealth are collected once every three years in the Survey of Consumer Finance.
::财富分配比收入分配更不平等,因为收入差异会随着时间的积累而积累,从而造成更大的财富差异。 但是,财富分配不平等的程度可以用我们用来衡量收入分配不平等的同样工具来衡量,如五等分层计量。 财富数据每三年在《消费者金融调查》中收集一次。Even if they cannot answer the question of how much inequality is too much, economists can still play an important role in spelling out policy options and tradeoffs. If a society decides to reduce the level of economic inequality, it has three main sets of tools: redistribution from those with high incomes to those with low incomes; trying to assure that a ladder of opportunity is widely available; and a tax on inheritance.
::即使他们无法回答不平等程度过大的问题,经济学家仍然可以在阐明政策选择和权衡中发挥重要作用。 如果社会决定降低经济不平等水平,它有三套主要工具:从高收入者向低收入者重新分配;努力确保机会的阶梯能够广泛提供;以及继承税。Redistribution
::重新分配Redistribution means taking income from those with higher incomes and providing income to those with lower incomes. Earlier in this chapter, we considered some of the key government policies that provide support for the poor: the welfare program TANF, the earned income tax credit, SNAP, and Medicaid. If a reduction in inequality is desired, these programs could receive additional funding.
::重新分配意味着从高收入者那里获取收入,并向低收入者提供收入。 在本章前面,我们考虑了为穷人提供支持的一些关键政府政策:TANF福利方案、收入所得税抵免、SNAP和MedicAid。 如果希望减少不平等,这些计划可以得到额外的资金。The programs are paid for through the federal income tax, which is a progressive tax system designed in such a way that the rich pay a higher percent in income taxes than the poor. Data from household income tax returns in 2009 shows that the top 1% of households had an average income of $1,219,700 per year in pre-tax income and paid an average federal tax rate of 28.9%. The effective income tax, which is total taxes paid divided by total income (all sources of income such as wages, profits, interest, rental income, and government transfers such as veterans’ benefits), was much lower. The effective tax paid by the top 1% of householders was 20.4%, while the bottom two quintiles actually paid negative effective income taxes, because of provisions like the earned income tax credit. News stories occasionally report on a high-income person who has managed to pay very little in taxes, but while such individual cases exist, according to the Congressional Budget Office, the typical pattern is that people with higher incomes pay a higher average share of their income in federal income taxes.
::这些计划是通过联邦所得税来支付的,这是一种累进税制度,其设计方式是让富人缴纳高于穷人的所得税。 2009年家庭所得税申报数据显示,最高1%的家庭年平均收入在税前收入中为1 219 700美元,平均联邦税率为28.9 % 。 有效的所得税是除以总收入(工资、利润、利息、租金收入和政府拨款等所有收入来源,如退伍军人福利)支付的税收总额要低得多。 顶层1 % 的住户缴纳的有效税收为20.4 % , 底层2个五分之一的家庭实际缴纳了负有效所得税,因为收入税抵免等规定。 偶尔有关于高收入者纳税率很低的新闻报道,但根据国会预算办公室,这类个别案例的典型模式是收入较高的人在联邦所得税中平均支付较高份额。Of course, the fact that some degree of redistribution occurs now through the federal income tax and government antipoverty programs does not settle the questions of how much redistribution is appropriate, and whether more redistribution should occur.
::当然,现在通过联邦所得税和政府除贫方案进行某种程度的再分配,并不能解决再分配的适当程度以及是否应该进行更多再分配的问题。The Ladder of Opportunity
::机会之阶梯Economic inequality is perhaps most troubling when it is not the result of effort or talent, but instead is determined by the circumstances under which a child grows up. One child attends a well-run grade school and high school and heads on to college, while parents help out by supporting education and other interests, paying for college, a first car, and a first house, and offering work connections that lead to internships and jobs. Another child attends a poorly run grade school, barely makes it through a low-quality high school, does not go to college, and lacks family and peer support. These two children may be similar in their underlying talents and in the effort they put forth, but their economic outcomes are likely to be quite different.
::如果经济不平等不是努力或才智的结果,而是由儿童成长的环境决定的,那么,经济不平等也许最令人不安。 一名儿童就读于经营良好的小学和高中,并上大学,而父母则通过支持教育和其他利益、支付大学、第一辆车和第一栋房子的费用以及提供导致实习和工作的劳动联系来提供帮助。 另一名儿童就读于经营不良的小学,几乎无法通过低质量的高中完成学业,没有上大学,没有家庭和同龄人的支持。 这两名儿童在他们的基本才智和他们的努力方面可能相似,但他们的经济结果可能大相径庭。Public policy can attempt to build a ladder of opportunities so that, even though all children will never come from identical families and attend identical schools, each child has a reasonable opportunity to attain an economic niche in society based on their interests, desires, talents, and efforts. Some of those initiatives include those shown in 7.
::公共政策可以试图建立一个机会的阶梯,以便即使所有儿童永远不会来自完全相同的家庭并上同样的学校,每个儿童都有合理的机会,根据自己的利益、愿望、才智和努力,在社会中获得经济优势。Children
::儿 儿 儿 儿College Level
::学院一级Adults
::成年人• Improved day care
::• 改善日托• Widespread loans and grants for those in financial need
::• 向有财政需要的人广泛提供贷款和赠款• Opportunities for retraining and acquiring new skills
::• 获得再培训和新技能的机会• Enrichment programs for preschoolers
::• 为学龄前人员提供强化方案• Public support for a range of institutions from two-year community colleges to large research universities
::• 公众支持一系列机构,从两年制社区学院到大型研究大学• Prohibiting discrimination in job markets and housing on the basis of race, gender, age, and disability
::• 禁止就业市场和住房中基于种族、性别、年龄和残疾的歧视• Improved public schools
::• 改善公立学校-
-
• After school and community activities
::• 课后和社区活动-
-
• Internships and apprenticeships
::• 实习和学徒培训-
-
Public Policy Initiatives
::公共政策倡议The United States has often been called a land of opportunity. Although the general idea of a ladder of opportunity for all citizens continues to exert a powerful attraction, specifics are often quite controversial. Society can experiment with a wide variety of proposals for building a ladder of opportunity, especially for those who otherwise seem likely to start their lives in a disadvantaged position. Such policy experiments need to be carried out in a spirit of open-mindedness, because some will succeed while others will not show positive results or will cost too much to enact on a widespread basis.
::美国常常被称为“机遇之地 ” 。 虽然为所有公民创造机会之梯子的普遍理念依然具有强大的吸引力,但具体细节往往颇具争议性。 社会可以尝试各种建立机会梯子的建议,特别是那些在其他方面似乎有可能开始生活处于弱势地位的人。 这些政策实验需要以开放的态度进行,因为有些人将取得成功,而其他人则不会产生积极的结果,或者将花费太多的代价无法在广泛的基础上实施。Inheritance Taxes
::遗产税There is always a debate about inheritance taxes. It goes like this: On the one hand, why should people who have worked hard all their lives and saved up a substantial nest egg not be able to give their money and possessions to their children and grandchildren? In particular, it would seem un-American if children were unable to inherit a family business or a family home. On the other hand, many Americans are far more comfortable with inequality resulting from high-income people who earned their money by starting innovative new companies than they are with inequality resulting from high-income people who have inherited money from rich parents.
::总是有关于继承税的争论。 是这样的:一方面,那些辛勤工作并拯救了一个大巢蛋的人为什么不能把钱和财物交给他们的子女和孙孙孙? 特别是,如果儿童不能继承家庭企业或家庭住宅,那么就显得非美国人了。 另一方面,许多美国人对高收入者通过创办创新的新公司挣钱而带来的不平等感到更舒服得多。 高收入者从富人父母那里继承了钱,而高收入者从富人父母那里继承了钱,因此他们与高收入者相比,他们与不平等。The United States does have an estate tax—that is, a tax imposed on the value of an inheritance—which suggests a willingness to limit how much wealth can be passed on as an inheritance. However, according to the Center on Budget and Policy Priorities, in 2013 the estate tax applied only to those leaving inheritances of more than $5.25 million and thus applies to only a tiny percentage of those with high levels of wealth.
::美国确实有遗产税 — — 即对遗产价值征收的税 — — 这表明美国愿意限制多少财富可以作为遗产传递。 但是,根据预算和政策优先事项中心,2013年,遗产税只适用于遗产超过525万美元的人,因此只适用于财富高的一小部分人。The Tradeoff between Incentives and Income Equality
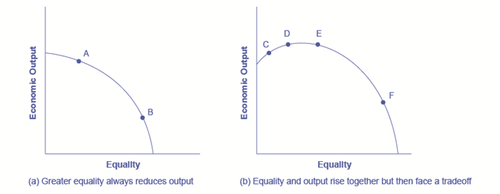
::奖励与收入平等之间的取舍Government policies to reduce poverty or to encourage economic equality, if carried to extremes, can injure incentives for economic output. The poverty trap, for example, defines a situation where guaranteeing a certain level of income can eliminate or reduce the incentive to work. An extremely high degree of redistribution, with very high taxes on the rich, would be likely to discourage work and entrepreneurship. Thus, it is common to draw the tradeoff between economic output and equality, as shown in 10 (a). In this formulation, if society wishes a high level of economic output, like point A, it must also accept a high degree of inequality. Conversely, if society wants a high level of equality, like point B, it must accept a lower level of economic output because of reduced incentives for production.
::政府减贫政策或鼓励经济平等政策如果发展到极端,可能会损害经济产出的激励因素,例如,贫困陷阱界定了一种保障一定水平的收入可以消除或减少工作激励因素的情况,如果对富人征收极高的税赋,高度的再分配可能会抑制工作和创业,因此,如10(a)所示,在经济产出与平等之间取舍是常见的。 在这一表述中,如果社会希望高水平的经济产出,如A点,它也必须接受高度的不平等。相反,如果社会希望高水平的平等,如B点,它必须接受较低的经济产出水平,因为生产激励减少。This view of the tradeoff between economic output and equality may be too pessimistic, and 10 (b) presents an alternate vision. Here, the tradeoff between economic output and equality first slopes up, in the vicinity of choice C, suggesting that certain programs might increase both output and economic equality. For example, the policy of providing free public education has an element of redistribution, since the value of the public schooling received by children of low-income families is clearly higher than what low-income families pay in taxes. A well-educated population, however, is also an enormously powerful factor in providing the skilled workers of tomorrow and helping the economy to grow and expand. In this case, equality and economic growth may complement each other.
::经济产出与平等之间的这种权衡观点可能过于悲观,而10(b)则提出了另一种观点。在这里,经济产出与平等之间的权衡首先在选择C附近有所上升,表明某些方案可能提高产出和经济平等,例如,提供免费公共教育的政策具有重新分配的内容,因为低收入家庭子女接受的公立学校教育的价值显然高于低收入家庭纳税的价值。然而,受过良好教育的人口也是提供明天熟练工人并帮助经济成长和扩大的巨大强大因素,在这种情况下,平等和经济增长可以相互补充。Furthermore, policies to diminish inequality and soften the hardship of poverty may sustain political support for a market economy. After all, if society does not make some effort toward reducing inequality and poverty, the alternative might be that people would rebel against market forces. Citizens might seek economic security by demanding that their legislators pass laws forbidding employers from ever laying off workers or reducing wages, or laws that would impose price floors and price ceilings and shut off international trade. From this viewpoint, policies to reduce inequality may help economic output by building social support for allowing markets to operate.
::此外,减少不平等和缓解贫困困苦的政策可能会维持对市场经济的政治支持。 毕竟,如果社会不为减少不平等和贫困做出一些努力,替代方案可能是人们会反抗市场力量。 公民可能会要求立法者通过法律,禁止雇主解雇工人或降低工资,或者实施价格底限和价格上限并关闭国际贸易的法律,从而寻求经济安全。 从这一观点看,减少不平等的政策可以通过建立社会支持来帮助经济产出,从而允许市场运作。The Tradeoff between Incentives and Economic Equality
::奖励措施与经济平等之间的取舍(a) Society faces a trade-off where any attempt to move toward greater equality, like moving from choice A to B, involves a reduction in economic output. (b) Situations can arise like point C, where it is possible both to increase equality and also to increase economic output, to a choice like D. It may also be possible to increase equality with little impact on economic output, like the movement from choice D to E. However, at some point, too aggressive a push for equality will tend to reduce economic output, as in the shift from E to F.
:The tradeoff in 10 (b) then flattens out in the area between points D and E, which reflects the pattern that a number of countries that provide similar levels of income to their citizens—the United States, Canada, the nations of the European Union, Japan, Australia—have different levels of inequality. The pattern suggests that countries in this range could choose a greater or a lesser degree of inequality without much impact on economic output. Only if these countries push for a much higher level of equality, like at point F, will they experience the diminished incentives that lead to lower levels of economic output. In this view, while a danger always exists that an agenda to reduce poverty or inequality can be poorly designed or pushed too far, it is also possible to discover and design policies that improve equality and do not injure incentives for economic output by very much—or even improve such incentives.
::在10点(b)和10点之间取舍10点(b),然后在D点和E点之间拉平,这反映了向本国公民提供类似收入水平的一些国家——美国、加拿大、欧洲联盟、日本、澳大利亚——的不平等程度不同,这种模式表明,这一范围的国家可以选择更大或较小程度的不平等,而不会对经济产出产生很大影响,只有这些国家像F点那样推动更高程度的平等,它们才会遇到导致经济产出水平下降的激励减少的情况,这种观点认为,虽然减贫或不平等的议程可能设计不善,或推动得过远,但也有可能发现和制定改善平等的政策,而不会损害经济产出的激励,甚至会大大改善这种激励。Answer the self check questions below to monitor your understanding of the concepts in this section.
::回答下面的自我核对问题,以监测你对本节概念的理解。Self Check Questions
::自查问题1. What are the 5 reasons for income inequality?
::1. 造成收入不平等的5个原因是什么?2. Go online and look up the current poverty guidelines for the United States. What is the current annual dollar amount used to evaluate the money income that families must earn to be above the poverty line?
::2. 上网查查美国目前的贫穷准则:用于评估家庭必须赚取的高于贫穷线的金钱收入的当前年度美元数额是多少?3. Go online and look up current statistics: How many people live in poverty? What are the largest groups of people living in poverty?
::3. 上网查一查目前的统计资料:有多少人生活在贫困之中?什么是最大的贫困人口群体?4. What are the 4 possible reasons for the growing income gap in the poverty level?
::4. 贫穷水平收入差距日益扩大的4个可能原因是什么?5. List any 4 of the anti-poverty programs in the U.S. and give examples of each one.
::5. 列出美国除贫方案中的任何4个方案,并举例说明每个方案。6. Go online and look up the current per capita personal income by state. Which 5 states have the highest per capita personal income? Which 5 states have the lowest per capita income?
::6. 上网查询按州分列的当前人均个人收入情况:哪些5个州的人均个人收入最高?哪些5个州的人均收入最低?7. What other economic assumptions can be made about states with high per capita personal income? Defend your answer.
::7. 对于人均个人收入高的国家,可以作出哪些其他经济假设?8. What other economic assumptions can be made about states with low per capita personal income? Defend your answer.
::8. 对于人均个人收入低的国家,还可以作出哪些其他经济假设? -
There are various reasons for income inequality, including education and discrimination.