11.9 静剂和叶片
章节大纲
-
The city of Northtown tracked the speeds of cars along a street before and after placing a speed limit sign up. The city wants to create a display that illustrates the following data :
::Northtown市在设置车速限制标志之前和之后追踪了沿街的汽车速度。Speeds before: 19, 20, 24, 25, 25, 26, 30, 31, 32, 36, 38, 39, 40, 42, 42, 45, 45, 47, 48, 48, 52, 54, 55, 55, 56, 56, 58, 61, 62, 62, 63, 68, 71
::前速:19、20、24、25、25、26、30、31、32、36、38、39、40、42、42、45、45、47、48、48、52、54、55、55、56、56、58、61、62、62、63、68、71Speeds after: 11, 18, 22, 23, 25, 28, 29, 30, 30, 32, 32, 32, 35, 39, 40, 43, 44, 45, 47, 47, 50, 51, 51, 53, 56, 62, 64, 65, 67, 73.
::11、18、22、23、25、28、29、30、32、32、32、32、35、39、40、43、44、45、47、47、50、51、51、53、56、62、64、65、67、73。How can the city create a data display?
::城市如何创建数据显示 ?In this concept, you will learn how to create and read stem-and-leaf plots.
::在这个概念中,你将学会如何创造和阅读干叶地图。Creating and Reading Stem-and-Leaf Plots
::创建和阅读 Stem-and- Leaf 草图Data is a set of numerical or non-numerical information. Data can be analyzed in many different ways. In this concept you will analyze numerical data using stem-and-leaf plots.
::数据是一组数字信息或非数字信息。数据可以多种不同方式分析。在这个概念中,您将使用干叶图分析数字数据。Mean is a numerical value that measures the spread of a data set . The mean is one way to determine the central or typical value of the set. Mean is also called the average .
::平均值是衡量数据集分布的数值。平均值是确定数据集中心值或典型值的一种方法。平均值也称为平均值。is a numerical value that represents the middle term in a data set. When ordered sequentially, this value that is in the middle is the median.
::是一组数据集中代表中期值的数字值。如果按顺序排列,中间值为中位值。Mode is the numerical value that occurs most frequently in a data set.
::模式是数据集中最常出现的数值。The range of a set of data is the difference between the largest and smallest values. The range identifies how far apart the values in the data set are.
::一组数据的范围是最大值和最小值之间的差别。该范围确定数据集中值的距离。One way to display data is in a stem-and-leaf plot . A stem-and-leaf plot is one way to show the distribution of the data. The data values in a stem-and-leaf plot are split into a stem and leaf.
::显示数据的一种方式是干叶图。干叶图是显示数据分布的一种方式。干叶图中的数据值被分割成干叶。Let's look at an example.
::让我们举个例子。Construct a stem-and-leaf plot for the data below.
::为以下数据构造一个干页图 。Science test scores for third period (out of 100%): 97, 92, 77, 82, 96, 75, 68, 80, 79, 96
::第三次科学考试分数(100%):97、92、77、82、96、75、68、80、79、96First, arrange the data in order from least to greatest.
::首先,按照从最少到最大的顺序排列数据。68, 75, 77, 79, 80, 82, 85, 92, 96, 96
Then, determine how to separate the data values into a stem and leaves. In this case, the stem will be the tens unit and the leaves will be the ones unit.
::然后,确定如何将数据值分离成干叶和叶子。在这种情况下,干叶将是10个单位,叶子将是1个单位。Next, create the stem-and-leaf plot by placing the tens values in one column and the ones values in another column. For 68, the 6 from 60 will go in the stem and the 8 from the ones will go in the leaf. For 75, 77, and 79, the 7 from 70 will go in the stem and the 5, 7, and 9 from the ones will go in the leaf.
::接下来,通过将数十个值放在一列中,而将10个值放在另一列中,来创建干叶图。对于68个,60个的6个值将在干叶中,8个值将在叶中。对于75个、77个和79个,70个的7个值将在干叶中,5个、7个和9个值将在叶中。Lastly, create a key for the stem-and-left plot. The key tells the reader what values are represented in the display. To do this, select one term in the plot and separate the digits by a vertical line, then use the equal sign to show what it is equivalent to. It will look like this,
::最后,为干左绘图创建密钥。 密钥告诉读者显示的值。 要做到这一点, 请在绘图中选择一个词, 用垂直线将数字分开, 然后使用等号来显示它等同于什么 。 它看起来像是 68=68 。The answer is the stem-and-leaf plot will look like the one below.
::答案是,干叶草的图案 将看起来像下面的图案。Examples
::实例Example 1
::例1Earlier, you were given a problem about Northtown and their speed data.
::早些时候,你得到一个问题 关于北城 和他们的速度数据。The city of Northtown tracked the speed of cars driving on a road before and after posting a speed limit. The city wants to display the the following data:
::Northtown市追踪了汽车在车速限制之前和之后在公路上行驶的速度。Speeds before: 19, 20, 24, 25, 25, 26, 30, 31, 32, 36, 38, 39, 40, 42, 42, 45, 45, 47, 48, 48, 52, 54, 55, 55, 56, 56, 58, 61, 62, 62, 63, 68, 71
::前速:19、20、24、25、25、26、30、31、32、36、38、39、40、42、42、45、45、47、48、48、52、54、55、55、56、56、58、61、62、62、63、68、71Speeds after: 11, 18, 22, 23, 25, 28, 29, 30, 30, 32, 32, 32, 35, 39, 40, 43, 44, 45, 47, 47, 50, 51, 51, 53, 56, 62, 64, 65, 67, 73.
::11、18、22、23、25、28、29、30、32、32、32、32、35、39、40、43、44、45、47、47、50、51、51、53、56、62、64、65、67、73。How can the city create a data display?
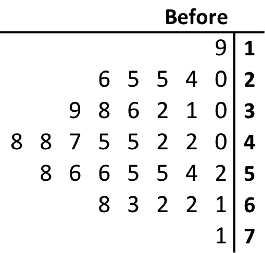
::城市如何创建数据显示 ?To do this, create two stem-and-leaf plots in one display. In this type of display, the stem will have leaves on both sides. To create the plot, start with determining the stem. In this case, the values in both data sets include numbers in the tens to seventies. Therefore, the stem will go from 1 to 7 to represent 10 to 70.
::要做到这一点, 请在一个显示器中创建两个干叶图。 在这种显示器中, 干叶将两侧都留下。 要创建这个图, 首先从确定干叶开始。 在此情况下, 两个数据集中的值包含 几十 至 70 年代的数字 。 因此, 干叶将从 1 到 7 到 10 到 70 。 因此, 干叶将从 1 到 7 到 10 到 70 。Next, list the before speeds on the left side of the stem. These should be listed in order from right to left.
::下一步, 请列出干叶左侧之前的速率。 这些速率应该按左右顺序排列 。Next, list the after speeds on the right side of the stem. These should be listed in order from left to right.
::下一步, 请列出干叶右侧的后面速度。 这些速度应该按照从左到右顺序排列 。Lastly, create a key for the stem-and-left plot. To do this, select terms from both sides of the plot and separate the digits by vertical lines, then use the equal sign to show what the stem-and-leaf is equivalent to.
::最后,为干叶图创建密钥。 要做到这一点, 从绘图两侧选择条件, 按垂直线将数字分开, 然后使用等号来显示干叶等值 。The answer is the stem-and-leaf plot will look like the one below.
::答案是,干叶草的图案 将看起来像下面的图案。Example 2
::例2Create a stem-and-leaf plot for the data set: 8, 12, 17, 18, 19, 22, 23, 31, 35, 40.
::为数据集绘制一个干叶图:8、12、17、18、19、22、23、31、35、40。First, arrange the data from least to greatest. In this case, the data is already ordered from least to greatest.
::首先,将数据从最低到最高排列。在此情况下,数据已经从最低到最高排序。Next, determine how to separate the data values into a stem and leaves. In this case, the stem will be the tens unit and the leaves will be the ones unit.
::下一步, 确定如何将数据值分解为干和叶。 在这种情况下, 干将是 10 个单位, 叶是 单个单位 。Next, create the stem-and-leaf plot by placing the tens values in one column and the ones values in another column. For 8, there is no 10 so the stem will be 0 and the 8 from the ones will go in the leaf. For 12, 17, 18, and 19, the 1 from 10 will go in the stem and the 2, 7, 8 and 9 from the ones will go in the leaf.
::接下来, 创建干叶图, 将 10 个值放入一列, 并将 10 个值放入另一列 。 对于 8 个 , 没有 10 个 , 因此 干叶将是 0 个 , 叶子上的 8 个 。 对于 12 、 17 、 18 和 19 个 , 10 个 的 1 个 、 10 个 的 、 2 、 7 、 8 和 9 个 的 、 叶子上 的 2 、 7 、 8 和 9 个 。Lastly, create a key for the stem-and-left plot. To do this, select one term in the plot and separate the digits by a vertical line, then use the equal sign to show what it is equivalent to. It will look like this, 1
::最后,为干左绘图创建密钥。 要做到这一点, 请在绘图中选择一个词, 用垂直线将数字分开, 然后使用等号来显示它等同于什么 。 它会看起来像这样, 1\\\ 2= 12 。The answer is the stem-and-leaf plot will look like the one below.
::答案是,干叶草的图案 将看起来像下面的图案。Example 3
::例3Create a stem-and-leaf plot for the data set: 14, 16, 17, 18, 18, 20, 22, 24, 29, 31, 33
::为数据集创建一个干叶图:14、16、17、18、18、20、22、24、29、31、33First, arrange the data from least to greatest. In this case, the data is already ordered from least to greatest.
::首先,将数据从最低到最高排列。在此情况下,数据已经从最低到最高排序。Next, determine how to separate the data values into a stem and leaves. In this case, the stem will be the tens unit and the leaves will be the ones unit.
::下一步, 确定如何将数据值分解为干和叶。 在这种情况下, 干将是 10 个单位, 叶是 单个单位 。Next, create the stem-and-leaf plot by placing the tens values in one column and the ones values in another column. For 14, the 1 from the 10 will go in the stem and the 4 from the ones will go in the leaf. For 33, the 3 from 30 will go in the stem and the 3 from the ones will go in the leaf.
::接下来, 创建干叶图, 在一列中放置 10 个值, 在另一列中放置 。 对于 14 个 , 10 个 的 1 个 将进入 干叶, 4 个 将进入 叶子 。 对于 33 个 的 30 个 的 3 个 将进入 干叶, 3 个 将进入 叶子 。Lastly, create a key for the stem-and-left plot. To do this, select one term in the plot and separate the digits by a vertical line, then use the equal sign to show what it is equivalent to. It will look like this, 1
::最后,为干左绘图创建密钥。 要做到这一点, 请在绘图中选择一个词, 用垂直线将数字分开, 然后使用等号来显示它等同于什么 。 它会看起来像这样, 1\\\ 4= 14 。The answer is the stem-and-leaf plot will look like the one below.
::答案是,干叶草的图案 将看起来像下面的图案。Example 4
::例4The stem-and-leaf plot below represent the quiz scores for a history class. The maximum score of the quiz is 20. Calculate the mean, median, mode, and range of the scores.
::下面的干叶图代表历史类的测验分数。 测验的最大分数是 20 , 计算得分的平均值、 中位数、 模式和范围 。First, calculate the mean. To do this, use the key to list the values in the stem-and-leaf plot.
::首先,计算平均值。要做到这一点,请使用密钥来列出干叶图中的值。0, 0, 0, 2, 3, 6, 7, 9, 9, 10, 12, 14, 14, 14, 15, 17, 18, 19, 19, 19, 20, 20, 20
Next, add all the values together.
::下一步,将所有数值加在一起。0 + 0 + 0 + 2 + 3 + 6 + 7 + 9 + 9 + 10 + 12 + 14 + 14 + 14 + 15 + 17 + 18 + 19 + 19 + 19 + 20 + 20 + 20 = 267
Then, divide the sum by the number of terms in the list. In this case there are 23 terms, so divide 267 by 23.
::然后,将总和除以列表中的术语数。 在这种情况下,有23个术语,因此,267除以23。This is the mean of the quiz scores.
::这是测验分数的平均值。Next, calculate the median. Since there are 23 terms, the median is the 12th term, 14.
::接下来计算中位数。 因为有23个条件, 中位数是12个条件, 14个条件 。Next, find the mode. The mode is the number, or numbers, that occurs most often. There are three numbers that occur most often, 14, 19, and 20. So all these are the mode.
::下一步, 找到模式。 模式是最经常发生的数字或数字。 有三个数字最常出现, 14, 19, 和20。 所以所有这些都是模式 。Next, find the range. The range is the difference between the smallest and largest numbers. To do this, subtract 0 from 20, which is 20.
::接下来,请找到范围。范围是最小数字和最大数字之间的差别。要做到这一点,20个,也就是20个,减去0个。The answer is the mean is 11.6, the median is 14, the mode is 14, 19, and 20, and the range is 20. All values are quiz scores.
::答案是平均值是11.6,中位数是14, 中位数是14, 模式是14, 19, 20, 范围是20, 所有数值都是测验分数。Example 5
::例5The stem-and-leaf plot below shows the weight (in pounds) of ten trout caught in a fishing competition. Calculate the mean, median, mode, and range of the data on the stem-and-leaf plot.
::下面的干果和叶片图示了在钓鱼比赛中捕获的10只鳟鱼的重量(磅)。计算干果和叶片图的平均值、中位数、模式和数据范围。First, calculate the mean. To do this, use the key to list the values in the stem-and-leaf plot.
::首先,计算平均值。要做到这一点,请使用密钥来列出干叶图中的值。2.9, 3.1, 4.0, 4.5, 5.2, 6.2, 7.6, 8.3, 9.2, 9.2
Next, add all the values together.
::下一步,将所有数值加在一起。Then, divide the sum by the number of terms in the list. In this case there are ten terms, so divide 60.2 by 10.
::然后,将总和除以列表中的术语数。 在这种情况下,有十个条件, 所以将60.2除以10。This is the mean of the weight (in pounds).
::这是体重的平均值(磅)。Next, calculate the median. The median is the number in the middle. Since there are ten terms, the median is between the fifth and sixth terms, 5.2 and 6.2. To find the value in the middle, add the two numbers together and divide by 2.
::接下来,计算中位数。中位数是中位数。由于有10个条件,中位数介于第五和第六学期之间,即5.2和6.2。要找到中间值,请将两个数字加在一起,再除以2。This is the median of the weight (in pounds).
::这是重量(磅)的中位数。Next, find the mode. The mode is the number that occurs most often. There is only one number that occurs more than once, 9.2, so this is the mode.
::下一步找到模式。 模式是最经常发生的数字。 只有一个数字不止一次出现, 9. 2, 所以这就是模式 。Next, find the range. The range is the difference between the smallest and largest numbers. To do this, subtract 2.9 from 9.2.
::接下来,请找到范围。范围是最小数字和最大数字之间的差别。要做到这一点,请在9.2中减去2.9。This is the range.
::这是范围。The answer is the mean is 6.02, the median is 5.7, the mode is 9.2, and the range is 6.3. All values are weight (in pounds).
::答案是平均值为6.02,中位数为5.7, 中位数为9.2, 范围为6.3。 所有数值均为重量(磅)。Review
::回顾Create stem-and-leaf plots and answer the questions on each.
::创建干叶图, 并回答每个问题 。-
Make a stem-and-leaf plot to display the data: 22, 25, 27, 29, 31, 34, 34, 39, 40, and 44.
::绘制干叶图显示数据:22、25、27、29、31、34、34、39、40和44。 -
Make a stem-and-leaf plot to display the data: 88, 96, 72, 65, 89, 91, 90, 100, 101, and 86.
::绘制干叶图显示数据:88、96、72、65、89、91、90、100、101和86。
The data table below depicts the number of miles ten students commute to school each day.
::下表数据表显示每天上学的10英里学生人数。-
Create a stem-and-leaf plot to display the data.
::创建一个干页图以显示数据 。 -
Use the stem-and-leaf plot to determine the mean.
::使用干叶图来确定平均值。 -
Use the stem-and-leaf plot to determine the median.
::使用干叶图来确定中位数。 -
Use the stem-and-leaf plot to determine the mode.
::使用干叶图来确定模式 。 -
Use the stem-and-leaf plot to determine the range of the data.
::使用干叶图来确定数据范围。
The data table below depicts the final score each basketball game for an entire season.
::以下数据表描述了整个赛季每个篮球比赛的最后分数。-
Use the data to create a stem-and-leaf plot.
::使用数据创建干叶图 。 -
Use the data to determine the mean.
::利用数据确定平均值。 -
Use the data to determine the median.
::利用数据确定中位数。 -
Use the data to determine the mode.
::使用数据确定模式。 -
Use the data to determine the range.
::使用数据来确定范围。
The stem-and-leaf plot depicts the class sizes for two grade levels at Huntington Middle School. Use the information on the stem-and-leaf plot to answer the questions below.
::Huntington中学的干叶图示了两年级的班级规模。 使用关于干叶图的信息回答下面的问题。and Grade Class Size
::第七和八年级Grade: Grade: Leaf Stem Leaf 9 8 1 6 7 7 1 2 4 2 3 4 0 3 2 Key: Key: -
Identify the stems for this set of data.
::识别这组数据的根。 -
Which grade level has a greater mean class size?
::哪个年级的平均班级规模更大? -
Determine the range in class size for
grade and
grade.
::确定七年级和八年级的班级规模范围。 -
Which grade level has a smaller median class size?
::哪个年级的班级中位数较小?
The data on the stem-and-leaf plots below compare the average daily temperature in Austin, Texas and Seattle, Washington for ten days in January.
::下面的干叶地的数据比较了奥斯汀、得克萨斯州和华盛顿州西雅图1月份10天的平均每日温度。Temperature in Two Cities (in Fahrenheit) Temperature in Austin, Texas Temperature in Seattle, Washington Leaf Stem Leaf 9 4 0 0 2 4 5 7 9 6 6 3 1 5 1 2 4 6 7 4 2 1 6 Key: Key: -
What are the stems for the data?
::数据源是什么? -
What is the coolest temperature in Austin, Texas?
::得克萨斯州奥斯汀最酷的温度是多少? -
What is the coolest temperature in Seattle, Washington?
::西雅图华盛顿最酷的温度是多少? -
Which city has the lowest mean temperature?
::哪个城市的平均温度最低? -
What is the range of the temperatures in Austin?
::奥斯汀的气温范围是多少? -
What is the range of the temperatures in Seattle?
::西雅图的气温范围是多少? -
What are the modes in both cities?
::两个城市的模式是什么?
Review (Answers)
::回顾(答复)Click to see the answer key or go to the Table of Contents and click on the Answer Key under the 'Other Versions' option.
::单击可查看答题键, 或转到目录中, 单击“ 其他版本” 选项下的答题键 。Resources
::资源 -
Make a stem-and-leaf plot to display the data: 22, 25, 27, 29, 31, 34, 34, 39, 40, and 44.