10.13 解释数据
章节大纲
-
“Wow! A large donation was made to the school! It says more than half is going to the new track. That’s awesome!” Sam said at breakfast as he read the newspaper over his Dad’s shoulder.
::山姆在早餐时在父亲的肩膀上读报纸时说。“Well, I don’t want to disappoint you Sam, but it’s 53% with a 5% margin of error,” his Dad explained.
::”他父亲解释道, “我不想让你失望Sam, 但它有53%的误差幅度为5%,“What does that have to do with anything?” Sam asked.
::“这有什么关系?” Sam问。“A margin of error can mean that the survey results aren’t completely accurate. You could say that you can’t take them at face value,” his Dad said.
::“误差幅度可能意味着调查结果并不完全准确。 你可以说,你不能以表面价值来看待这些结果。 ”他爸爸说。Sam is perplexed. 53% is 53%, or is it?
::山姆很困惑 53%是53% 还是53%?In this concept, you will learn to interpret data .
::在这个概念中,你会学会解释数据。Data
::数据数据数据数据数据数据数据数据数据数据数据数据数据数据数据数据数据数据数据数据数据数据数据数据数据数据数据数据数据数据数据数据数据数据数据数据数据数据数据数据数据数据数据数据数据数据数据数据数据数据数据数据数据数据数据数据数据数据数据数据数据数据数据数据数据数据数据数据数据数据数据数据数据数据数据数据数据数据数据数据数据数据数据数据数据数据数据数据数据数据数据数据数据数据数据数据数据数据数据数据数据数据数据数据数据数据数据数据数据数据数据数据数据数据数据数据数据数据数据数据数据数据数据数据数据数据数据数据数据数据数据数据数据数据数据数据数据数据数据数据数据数据数据数据数据数据数据数据数据数据数据数据数据数据数据数据数据数据数据数据数据数据数据数据数据数据数据数据数据数据数据数据数据数据数据数据数据数据数据数据数据数据数据数据数据数据数据数据数据数据数据数据数据数据数据数据数据数据数据数据数据数据数据数据数据数据数据数据数据数据数据数据数据数据数据数据数据数据数据数据数据数据数据数据数据数据数据数据数据数据数据数据数据数据数据数据数据数据数据数据数据数据数据数据数据数据数据数据数据数据数据数据数据数据数据数据数据数据数据数据数据数据数据数据数据数据数据数据数据数据数据数据数据数据数据数据数据数据数据数据数据数据数据数据数据数据数据数据数据数据数据数据数据数据数据数据数据数据数据数据数据数据数据数据数据数据数据数据数据数据数据数据数据数据数据数据数据数据数据数据数据数据数据数据数据数据数据数据数据数据数据数据数据数据数据数据数据数据数据数据数据数据数据数据数据数据数据数据数据数据数据数据数据数据数据数据数据数据数据数据数据数据数据数据数据数据数据数据数据数据数据数据数据数据数据数据数据数据数据数据数据数据数据数据数据数据数据数据数据数据数据数据数据数据数据数据数据数据数据数据数据数据数据数据数据数据数据数据数据数据数据数据数据数据数据数据数据数据数据数据数据数据数据数据数据数据数据数据数据数据数据数据数据数据数据数据数据数据数据数据数据数据数据数据数据数据数据数据数据数据数据数据数据数据数据数据数据数据数据数据数据数据数据数据数据数据数据数据数据数据数据数据数据数据数据数据数据数据数据数据数据数据数据数据数据数据数据数据数据数据数据数据数据数据数据数据数据数据数据数据数据数据数据数据数据数据数据数据数据Drawing conclusions based on data is a major goal in . Some data can be misleading and some conclusions can be doubtful. For that reason, it is important to keep an eye open for public information that may not be entirely based on data. You must be critical about where information comes from because biases may occur in the , survey questions, display methods, and conclusions. Nevertheless, good science and math can lead to valuable information.
::以数据为基础得出结论是...的主要目标。有些数据可能会误导人,有些结论可能会令人怀疑。因此,重要的是对可能并非完全以数据为基础的公共信息保持开放。你必须对信息来自何处持批评态度,因为在调查问题、显示方法和结论中可能会出现偏见。然而,好的科学和数学可以带来有价值的信息。Let’s look at how you can make predictions based on survey data.
::让我们看看如何根据调查数据作出预测。A cellular phone company conducts a random survey in their service area regarding the problems encountered with phone service. They surveyed 700 people with cellular phones in a population of 125,000 people. They find the following results.
::一家移动电话公司在其服务领域对电话服务遇到的问题进行随机调查,对125 000人人口中700名拥有移动电话的人进行了调查,结果如下。Too expensive: 39%
::过于昂贵:39%Poor Signal: 33%
::信号差:33%Not enough features: 16%
::没有足够的特征:16%Lack of support: 12%
::缺乏支持:12%Based on their survey, they can extrapolate the data to the entire population. In other words, when the survey was carried out in a proper manner, they can assume that the survey is accurate for the entire population. If there are 125,000 people in the population, they can assume that the same results found in the survey will be true for all of the 125,000 people. So, how many people will find the phones too expensive? Signal quality poor? Too few features?
::根据调查,他们可以向全体人口推断数据,换句话说,当调查以适当方式进行时,他们可以假定调查对全体人口是准确的,如果人口有125 000人,他们可以假定调查中发现的结果对125 000人都是相同的。因此,有多少人会发现电话太贵?信号质量差?特征太少?First, calculate the percent found in the data of the entire population.
::首先,计算在全部人口数据中发现的百分率。Too expensive: 39%
::过于昂贵:39%Therefore, 48,750 people from the entire population would consider the phone service was too expensive.
::因此,来自整个人口的48 750人认为电话服务太昂贵。Poor Signal: 33%
::信号差:33%Therefore, 41,250 people from the entire population would consider the phone service had a poor signal.
::因此,来自整个人口的41 250人认为电话服务信号差。Not enough features: 16%
::没有足够的特征:16%Therefore, 20,000 people from the entire population would consider the phone service had too few features.
::因此,整个人口的20 000人认为电话服务功能太少。Lack of support: 12%
::缺乏支持:12%Therefore, 15,000 people from the entire population would consider the phone service did not provide enough support.
::因此,整个人口的15 000人认为电话服务没有提供足够的支助。Let’s think about margin of error . Margin of error is a range of values above and below a statistic .
::让我们想想误差的幅度。 误差的边际是统计上下的一系列数值。There will always be a margin of error, or a percentage by which the true numbers for the entire population may differ.
::总是有误差幅度,或整个人口的真实数字可能不同的百分比。For example, a survey company may calculate a margin of error of 3%. This means that the measurements for the entire population may vary either up or down by 3%.
::例如,调查公司可以计算出3%的误差幅度,这意味着对全体人口的测量可能上下变化3%。As you know, the method of choosing samples is important to find data you can trust. The better the sampling method is the better the data collected. When data is gathered well, its results will be truer for the entire population. Nevertheless, most research companies and survey takers understand that it is actually quite difficult to find a perfect sample .
::如你所知, 选择样本的方法对于找到您可以信任的数据非常重要。 取样方法越好, 收集的数据就越好。 如果数据收集得当, 其结果对全体人口来说会越正确。 尽管如此, 大部分研究公司和调查采集者都明白, 找到完美的样本实际上很难。Let’s look at an example.
::让我们举个例子。A survey company reports that 51% of people surveyed said they will vote for Candidate X (with a margin of error of 3%). What range of voter percentage does this represent?
::一家调查公司报告说,51%的被调查者表示他们将投票支持X候选人(误差幅度为%-3%)。 这代表了多少选民百分比?First, calculate the lower limit.
::首先,计算下限。The lower limit is 48%.
::下限为48%。Next, calculate the upper limit.
::接下来,计算上限。The upper limit is 54%.
::上限为54%。The answer is that 51% 3% gives a range of 48% to 54% that will vote for Candidate X .
::答案是, 51%的%-3%给予48%至54%的投票率,In modern media, particularly newspapers and magazines, it is common to find reports based on survey results. Often times a margin of error is mentioned.
::在现代媒体,特别是报纸和杂志中,根据调查结果发现报告是常见的,经常提到误差。Let’s look at another example.
::让我们再看看另一个例子。A local newspaper article entitled “More Beets than Meats” discusses more people switching over to vegetarianism. The article says, “In a hundred people surveyed in 1998, 8% reported being a vegetarian. In a similar survey taken in 2000, that number grew by 50% to 12% (margin of error in surveys 3%). It’s a great time to invest in produce companies because that number will just keep on growing!”
::当地报纸一篇题为“比肉类更新鲜”的文章讨论了更多的人改吃素食主义。 文章说 , “ 在1998 年调查的一百人中,8%的人报告说自己是素食主义者。 2000 年的类似调查中,这一数字增长了50%,达到12%(调查误差幅度为 3 % ) 。 这是投资生产企业的好时机,因为这个数字会继续增长! ”First, calculate the lower limit for the years 1998 and 2000.
::首先,计算1998年和2000年的下限。Next, calculate the upper limit for the years 1998 and 2000.
::下面计算1998年和2000年的上限。Then, examine the article itself. This article reports that the number of vegetarians grew by 50%. However, it also reports a margin of error of 3%. This means that the actual results may have been as high as 11% vegetarians in 1998 and as low as 9% vegetarians in 2000. It is possible that the number of vegetarians actually declined.
::本文报告素食者人数增加了50%。然而,也报告误差幅度为+-3%。这意味着实际结果在1998年可能高达11%素食者,2000年可能降至9%素食者。Also, even if the number of vegetarians did increase by 50% during those two years, it does not mean that the number will continue to increase at that rate.
::此外,即使这两年的素食者人数确实增加了50%,但这并不意味着按这个速度,素食者人数将继续增加。Finally, there is no mention of the sampling method. The method they used may not have been representative of the entire population.
::最后,没有提及取样方法,他们使用的方法可能没有代表整个人口。Examples
::实例Example 1
::例1Earlier, you were given a problem about Sam and his Dad talking about the donation made to the school.
::之前,你听到一个问题 关于山姆和他的爸爸 谈到捐给学校。Sam’s Dad had explained that 53% of the donation with a margin of error of 5% was allotted for the new track. Sam does not understand. You need to explain it to him.
::Sam's Dad解释说,53%的捐赠(误差幅度为5%)被分配到新轨道。 Sam不理解。 您需要向他解释。First, calculate the lower limit.
::首先,计算下限。The lower limit is 48%.
::下限为48%。Next, calculate the upper limit.
::接下来,计算上限。The upper limit is 58%.
::上限为58%。The answer is that 53% 5% gives a range of 48% to 58% of the money donated will be allotted for the new track.
::答案是 53% - 5% 给予48%到58%的捐赠款 将分配给新轨道Example 2
::例2A high school conducts a survey for their foreign language program. They need to know how many sections of each class they need. There are 3,400 students in the high school and each class can have a maximum of 35 students in it. Of 200 students surveyed, they find the following number of student responses.
::高中对其外语课程进行调查,他们需要知道每个班需要多少班级,高中有3 400名学生,每个班最多可招收35名学生,在接受调查的200名学生中,他们发现以下学生答复数。Spanish: 85
::西班牙语: 85French: 35
::法文: 35German: 39
::德语:39Chinese: 23
::中文: 23人None: 18
::无:18How many classes for each language should the school offer?
::学校应该为每种语言提供多少个班级?First, find the percentage of the respondents for each language class.
::首先,找到每一语文类别的答复者的百分比。Spanish
::西班牙语 西班牙语 西班牙语French
::法语 法语 法语German
::德语 德语Chinese
::中文 中文 中文None
::无无无无无无无Next, calculate the number of students in the entire student population that will want to take these language courses. Remember there are 3400 students in the school.
::接下来,计算所有学生中想上这些语言课程的学生人数。 记住,学校里有3400名学生。Spanish
::西班牙语 西班牙语 西班牙语French
::法语 法语 法语German
::德语 德语Chinese
::中文 中文 中文None
::无无无无无无无Then, calculate the number of classes for each language. Remember that a class can have a maximum of 35 students.
::然后计算每种语言的班级数量。 记住, 班级最多可以有35名学生 。Spanish
::西班牙语 西班牙语 西班牙语French
::法语 法语 法语German
::德语 德语Chinese
::中文 中文 中文None
::无无无无无无无The answers are 41.3, 17, 18.9, 11.2, and 8.7. Therefore, the answers are the school needs 42 Spanish language classes, 17 French language classes, 19 German language classes, 12 Chinese language classes, and 9 classes remain that do not offer a second language.
::答案是41.3、17、18.9、11.2和8.7. 因此,答案是学校需要42个西班牙语班、17个法语班、19个德语班、12个中文班和9个不提供第二语言班。Because 35 is the maximum number of students, the number of classes must be rounded up to the next whole number. Classes cannot go over 35 and fractional classes cannot be offered.
::因为学生人数最多35人,所以班级数量必须四舍五入,直至下一个整批学生人数。 班级不能超过35人,分班也不能提供。All 450 students in the graduating class at Springstead High School were surveyed about homework. 27% said they wanted more homework, while 73% said they wanted less homework.
::Springstead高中毕业班的所有450名学生都接受了家庭作业调查。 27%的学生说他们想要更多的家庭作业,73%的学生说他们想要的家庭作业较少。Example 3
::例3If the margin of error was 3%, how would this impact the percentages?
::如果误差幅度为3%,这将如何影响百分比?First, calculate the lower limit for those who want more homework and those who do not.
::首先,计算那些想要更多家庭作业的人和那些不想做家庭作业的人的下限。
::想要更多的家庭作业 想要少一点家庭作业 27-3=2473-3=70Next, calculate the upper limit for those who want more homework and those who do not.
::接下来,计算那些想做更多功课的人和那些不想做功课的人的上限。
::想要更多家庭作业 想要少点家庭作业 27+3=3073+3=76The upper limit is 54%.
::上限为54%。The answer is that 51% 3% gives a range of 48% to 54% that will vote for Candidate X .
::答案是513%的投票率在48%至54%之间,The answer is 24% to 30% of the students want more homework and 70% to 76% of the students want less homework.
::答案是24%至30%的学生想要更多家庭作业,70%至76%的学生想要更少家庭作业。Example 4
::例4How many students wanted more homework?
::有多少学生想做更多的功课?First, calculate the number of students for the lower limit. Remember there are 450 students in the school.
::首先,计算下限的学生人数。记住学校里有450名学生。Next, calculate the number of students for the upper limit.
::接下来,计算上限的学生人数。The answers are 108 and 135. Therefore between 108 and 135 of the 450 students want more homework.
::答案是108和135。 因此,在450名学生中,108至135名学生需要更多的家庭作业。Example 5
::例5How many students wanted less homework?
::有多少学生想少做功课?First, calculate the number of students for the lower limit. Remember there are 450 students in the school.
::首先,计算下限的学生人数。记住学校里有450名学生。Next, calculate the number of students for the upper limit.
::接下来,计算上限的学生人数。The answers are 315 and 342. Therefore between 315 and 342 of the 450 students want less homework.
::答案是315和342,因此在450名学生中,有315至342人需要的功课较少。Review
::回顾A job satisfaction survey is taken of 500 people who work in the auto industry. The results are shown in the table below:
::对在汽车业工作的500人进行了工作满意度调查,结果见下表:Job Satisfaction Survey (margin of error +/- 4%) Very Dissatisfied Dissatisfied Satisfied Very Satisfied 16% 21% 41% 22% 1. Based on the margin of error, find the percent range of responses in each category.
::1. 根据误差幅度,在每个类别中找到答复的百分率范围。2. There are 340,000 people in the auto industry. Assuming that the survey is representative of the population, how many people are dissatisfied?
::2. 汽车业有340 000人,假设调查代表人口,有多少人不满意?3. There are 340,000 people in the auto industry. Assuming that the survey is representative of the population, how many people are satisfied?
::3. 汽车业有340 000人,假定调查代表人口,多少人满意?4. There are 340,000 people in the auto industry. Assuming that the survey is representative of the population, how many people are very satisfied?
::4. 汽车业有340 000人,假定调查代表人口,多少人非常满意?5. There are 340,000 people in the auto industry. Assuming that the survey is representative of the population, how many people are very dissatisfied?
::5. 汽车业有340 000人,假设调查代表人口,有多少人感到非常不满意?6. What conclusions can you draw based upon this data?
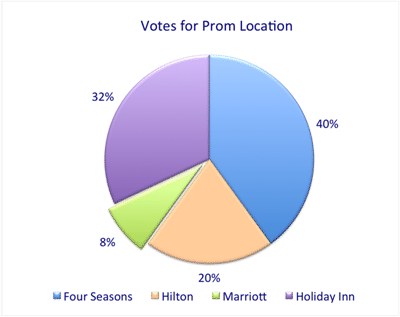
::6. 你能根据这些数据得出什么结论?Look at the chart regarding the Prom Location. Assume a margin of error of 5%.
::看看Prom位置的图表。 假设误差幅度为% 5% 。7. If the school has 420 students planning to attend, what is the percent range of students who will prefer each of the locations?
::7. 如果学校有420名学生计划上学,那么选择每个地点的学生百分比范围是多少?8. How many students want the Holiday Inn?
::8. 有多少学生想要假日旅馆?9. How many students want the Hilton?
::9. 有多少学生想要希尔顿?10. How many students want the Marriott?
::10. 有多少学生想要万豪酒店?11. How many students want the Four Seasons?
::11. 有多少学生想要四季学校?12. What conclusions can you draw from the data A college newspaper reports the following:
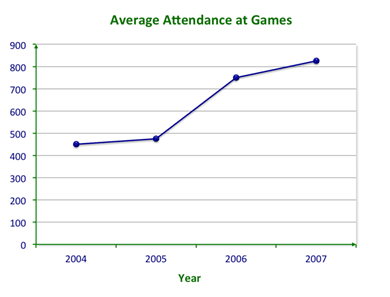
::12. 你能从A大学报纸上的数据中得出以下结论:“Ever since the new volleyball stadium was built at the end of 2005, the interest in the Women’s Volleyball Team has grown. In turn, that has made the team go nearly perfect this year. Their current record is 14 wins and 3 losses. Last year at this time, they were only 13 and 4. Come and see the new stadium and encourage the college to build the new football stadium, too!”
::“自2005年底新排球场建成以来,人们对女子排球队的兴趣已经增加。 反过来,这又使球队今年接近完美。 他们目前的记录是14场赢3场损失。 去年,他们只有13场和4场。 来看看新球场,鼓励学院建造新的足球场! ”13. What conclusions have been drawn by the writer of this article?
::13. 本条作者得出了哪些结论?14. Do you agree with them? Why or why not?
::14. 你同意他们的意见吗?15. What bias might the writer have had?
::15. 作者有什么偏见?Review (Answers)
::回顾(答复)Click to see the answer key or go to the Table of Contents and click on the Answer Key under the 'Other Versions' option.
::单击可查看答题键, 或转到目录中, 单击“ 其他版本” 选项下的答题键 。