12.13 理解Parabolas等同
章节大纲
-
This parabola was created from an equation . What was the equation?
::这个抛物线是方程式创造出来的 方程式是什么?In this concept, you will learn to understand the equation of a parabola.
::在这一概念中,你会学会理解抛物线的方程式。Parabolas
::抛物体A parabola is a U-shaped graph.Equations with the ‘ ’ variable raised to the 2 nd power are called quadratic equations and their graphs are always parabolas.
::抛物线是一个 U 形状的图形。 以 `x ' 变量升至 2 次功率的等式被称为二次方程, 其图形总是 parapolas 。Here is a quadratic equation .
::这里有一个二次方程。
::y=x2-2The graph of a parabola can change position, direction, and width based on the coefficients of and as well as the constant . Because those pieces of the equation are so important, you name them in what is called the standard form .
::抛物线的图形可以根据 x2 和 x 的系数以及常数来改变位置、 方向和宽度。 因为方程式中的这些部分如此重要, 您在标准格式中给它们命名 。Standard form of a quadratic equation: (where ‘ ’ cannot be zero). Notice that ‘ ’ and ‘ ’ are coefficients and can be either positive or negative. The value of ‘ ’ is a constant. All of these values affect the parabola that is graphed.
::二次方程的标准形式 : y= ax2+bx+c (其中`a ' 不能为零 ) 。 请注意, `a ' 和`b ' 是系数,可以是正数,也可以是负数。 `c ' 的价值是一个常数。 所有这些数值都会影响所绘制的抛物线。Once again, the ‘ ’ value can predict two things:
::A值可以预测两件事:1. how wide the graph will be
::1. 图表的宽度Generally speaking, the further the ‘ ’ value is from zero, the narrower the graph; the closer the ‘ ’ value is to zero, the wider the graph.
::一般说来, " a " 值越远来自零,越窄的图形; " a " 值越近于零,该图就越大。2. if the graph opens upward or downward.
::2. 如果图表向上或向下开放。A positive value of ‘ ’ will give a graph that opens upwards while a negative value of ‘ ’ will give a graph that opens downwards.
::“a”的正值将给出一个向上打开的图表,而“a”的负值将给出一个向下打开的图表。What about the ‘ ’ value?
::B 值如何?All of the parabolas are symmetrical—they are the same on both sides, as if they were reflected on a mirror that were right down the middle of the graph. This reflection line is called the axis of . The ‘ ’ value helps us to predict the axis of symmetry.
::所有抛光线都是对称的——两侧都是一样的,好像它们被反射到一面正下方的镜子上。这个反射线被称为 . 轴。 `b ' 值帮助我们预测对称轴。Finally, the value, determines the - intercept of the graph—it tells where the graph will cross the -axis. When the value was 3, the graph crossed the -axis at 3.
::最后, c 值, 确定图形的 y 界面- 它会显示图形要横过 y 轴的位置 。 当 c 值为 3 时, 图形会跨过 y 轴 3 。Let’s look at some graphs.
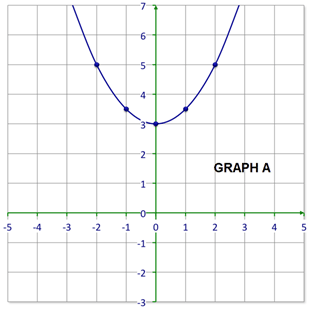
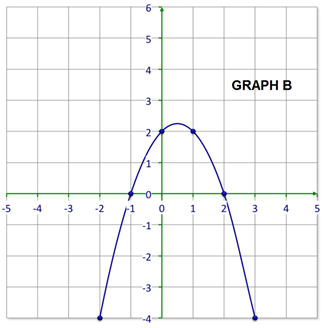
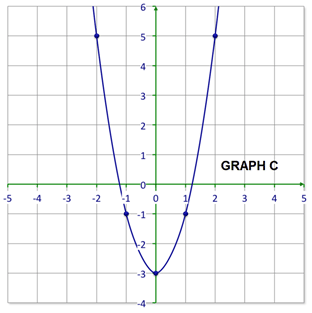
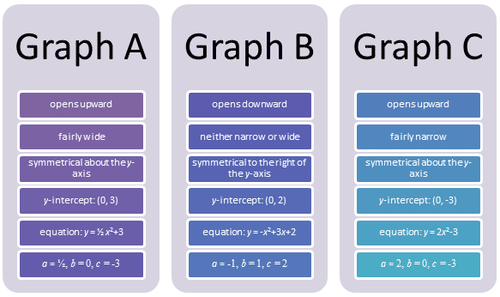
::让我们看看一些图表。Looking at these graphs, and knowing what the and values of the quadratic equation represent, will help to determine the equation of the graph. Here is a chart to help you understand what you can determine by these graphs.
::查看这些图表,并了解四方形的a、b和c值,将有助于确定图形的方程。这里是一张图表,帮助您了解这些图表可以确定什么。Now you can see how the graphs of each equation provide you with information.
::现在你可以看到每个方程式的图形如何为您提供信息。You have learned to write linear equations based on linear graphs, you can also find a quadratic equation by using the parabola.
::您已经学会了根据线性图形撰写线性方程式, 您也可以通过使用 parbola 找到二次方程式 。You know that the ‘ ’ value tells if the graph goes upward or downward. So, if the graph goes downward, the ‘ ’ value must be negative. If the graph opens upward, the ‘ ’ value must be positive.
::你知道“a”值表示图表向上还是向下。因此,如果图表向下,“a”值必须是负值。如果图表向上打开,“a”值必须是正值。You also know that the ‘ ’ value tells you the -intercept on the graph. So, if you know the -intercept, then you know the ‘ ’ value.
::您也知道“ c” 值告诉您图形上的 Y 拦截 。 所以, 如果您知道 y 拦截 , 那么您就会知道 “ c” 值 。If you have a graph, then you can also work backwards. In other words, you can fill in a t-table using the points you see on the graph. Then, by looking for a pattern in the t-table, you can derive the equation.
::如果您有一个图表, 那么您也可以向后工作 。 换句话说, 您可以使用图表上显示的点填入一个t- 表格 。 然后, 通过在t- 表格中查找一个图案, 您可以从中得出公式 。Let’s look at an example.
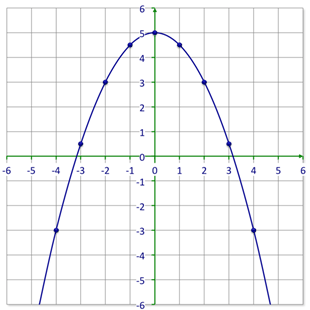
::让我们举个例子。Write the equation for the given graph.
::写入给定图形的方程式 。First, start with what you know about the values of ‘ ’ and ‘ ’.
::首先,首先从你所知道的“a”和“c”的价值观开始。: Graph opens downward so .
::a: 图表向下打开,以 < 0。: The -intercept is (0, 3) so .
::c: Y 界面是 (0, 3) so c=3。Next, construct a table of values from the graph.
::下一步,从图表中构建一个数值表。-2 -1 -1 2 0 3 1 2 2 -1 Then, put what you know into the standard form of the quadratic equation. Since the graph goes over one and down 1, you know that .
::然后,将你所知道的放入二次方程的标准形式。既然图表超过1和1,你知道A+1。
::y=ax2+bx+cyx2+bx+3 y=ax2+bx+3Then, test a point on the graph to find the value of .
::然后,在图形上测试一个点以找到 b 的值 。
::y=x2+bx+3 y=x2+bx+3Point: (-1, 2)
::点数-1,2)
::2(- 1) 2+b(-1)+3211b+32b+2b+2b=0The answer is .
::答案是yx2+3。Examples
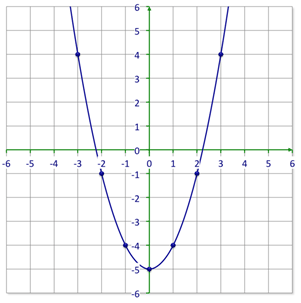
::实例Example 1
::例1Earlier, you were given a problem about the parabola.
::早些时候,有人给了你一个关于抛物线的问题。First, start with what you know about the values of ‘ ’ and ‘ ’.
::首先,首先从你所知道的“a”和“c”的价值观开始。: Graph opens upward so .
::a: 图表向上打开,为 a>0。: The -intercept is (0, 0) so .
::c: Y 界面是 (0, 0) so c=0。Next, construct a table of values from the graph.
::下一步,从图表中构建一个数值表。-2 4 -1 1 0 0 1 1 2 4 Then, put what you know into the standard form of the quadratic equation. Since the graph goes over one and up 1, you know that .
::然后,将你所知道的放入二次方程的标准形式。既然图表超过1和1,你知道A=1。
::y=ax2+bx+cy=x2+bx y=ax2+bxThen, test a point on the graph to find the value of .
::然后,在图形上测试一个点以找到 b 的值 。
::yx2+bx yx2+bxPoint: (-1, 1)
::点数
::1=(- 1) 2+b(- 1) 1=1bb=0The answer is .
::答案是y=x2。Example 2
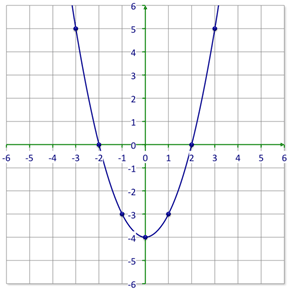
::例2Figure out the equation for the following parabola.
::找出下列抛物线的方程。First, start with what you know about the values of ‘ ’ and ‘ ’.
::首先,首先从你所知道的“a”和“c”的价值观开始。: Graph opens upward so .
::a: 图表向上打开,为 a>0。: The -intercept is (0, -4) so .
::c: Y 界面是 0, 4, so c4。Next, construct a table of values from the graph.
::下一步,从图表中构建一个数值表。-2 0 -1 -3 0 -4 1 -3 2 0 Then, put what you know into the standard form of the quadratic equation. Since the graph goes over one and up 1, you know that .
::然后,将你所知道的放入二次方程的标准形式。既然图表超过1和1,你知道A=1。
::y=ax2+bx+cy=x2+bx-4 y=ax2+bx+cy=x2+bx-4Then, test a point on the graph to find the value of .
::然后,在图形上测试一个点以找到 b 的值 。
::yx2+bx- 4 yx2+bx- 4Point: (-1, -3)
::点数
::- 3=(-1)2+b(-1)-4-3=1b-4-3-3b-3b=0The answer is .
::答案是y=x2 -4。Example 3
::例3If the value is 4, where is the -intercept of the graph?
::如果 c 值是 4 , 图形的 Y 界面在哪里 ?If , the –intercept or the point where the curve crosses the -axis is (0, 4).
::如果 c= 4, y - interview 或曲线通过 y 轴的点 (0, 4) 。Example 4
::例4If the ‘ ’ value is −3, will the parabola open upward or downward?
::如果`a ' 值为-3, 抛物线会向上或向下打开吗?If , then the graph opens downward so when , the graph will open downward.
::如果 a<0,则图形向下打开,当 a\\\\\3 时,图形向下打开。Example 5
::例5If the parabola opens upward, which value is positive or .
::如果抛物线向上打开,该值为正a、b或c。When the graph opens upward or downward, the value of ‘ ’ is affected. Therefore if the graph opens upward you know that ‘ ’ is positive.
::当图表向上或向下打开时,“a”的值就会受到影响。因此,如果向上打开,您就会知道“a”是正数。Review
::回顾Answer the following questions about parabolas.
::回答下列关于parabolas的问题。1. True or false. All parabolas are symmetrical.
::1. 真实的或虚假的,所有抛物线都是对称的。2. True or false. The intercept is the same as the value.
::2. 真实或虚假。拦截y与c值相同。3. A parabola with a positive squared value opens __________.
::3. 具有正正平方值的抛物线打开_____________________________________________________________________________________________________________________________________________________________________________________________________________________________________________________________________________________________________________________________________________________________________________________________________________________________________________________________________________________________________________________________________________________________________________________4. A parabola with a negative squared value opens __________.
::4. 负正方值的抛物线打开____________________________________________________________________________________________________________________________________________5. What is the vertex of the parabola?
::5. 抛物线的顶部是什么?6. True or false. A parabola always forms a U shape.
::6. 真实的或假的,抛物线总是形成U形。7. True or false. The closer the value is to zero the wider the parabola.
::7. 真实或虚假,值越接近零,抛物线越大。8. True or false. The closer the value is to zero the narrower the parabola.
::8. 真实的或虚假的,值越接近零,抛物线越窄。9. True or false. The value determines the axis of symmetry.
::9. 正确或虚假。b值决定对称轴。10. What does the value indicate?
::10. C值表示什么?11. True or false. A linear equation will have a graph that is a parabola.
::11. 真实的或虚假的,线性方程将有一个图示,即抛物线。12. True or false. A quadratic equation and a linear equation will have a similar graph.
::12. 真实或假方程式。二次方程式和线性方程式将有类似的图表。Write the equations of the following graphs. Use the and values and a t-table to help you.
::写入下图的方程式。使用 a 和 c 值和 t 表格来帮助您 。13.
14.
15.
Review (Answers)
::回顾(答复)Click to see the answer key or go to the Table of Contents and click on the Answer Key under the 'Other Versions' option.
::单击可查看答题键, 或转到目录中, 单击“ 其他版本” 选项下的答题键 。Resources
::资源