12.15 评价赤道函数
章节大纲
-
When passing the baseball field, Mr. Travis handed the students the following problem written on a piece of paper that looked like a baseball. This is what it said:
::当通过棒球场时,Travis先生向学生们提出了以下问题,这些问题写在一张像棒球一样的纸上。When an object is thrown into the air with a starting velocity of feet per second, its distance in feet, above its starting point seconds after it is thrown is about . Use a table of values to show the distance of an object from its starting point that has an initial velocity of 80 feet per second. Then graph the velocity of the ball.
::当一个物体以每秒r英尺的起始速度被抛入空气时,其距离(d)英尺,在抛入该物体的起点2秒以上是 d=rt-16t2. 使用数值表显示一个物体与起点的距离,其初始速度为每秒80英尺。然后绘制球的速度图。In this concept, you will learn to evaluate and graph quadratic functions by using tables.
::在此概念中,您将学会使用表格来评估和绘制二次函数图。Quadratic Functions
::二次曲线函数A function is a relation that assigns exactly one value of the domain to each value of the range . When you say quadratic function , you are referring to any function that can be written in the form where and are constants and . When a quadratic function is written as it is said to be written in standard form .
::函数是一个关系,它为范围的每一值指定一个精确的域值。当您说“四方函数”时,您指的是以 y=ax2+bx+c 的形式写成的任何函数,其中 a、b、c 是常数和 a0。当四方函数以 y=ax2+bx+c 的形式写成时,它被称为标准格式。Let’s look at quadratic functions in more detail. The word domain refers to input values and the word range refers to output values. For a function, every value has only one value.
::让我们更详细地查看二次函数。 单词域是指输入值, 单词范围是指输出值。 对于一个函数, 每个 x 值只有一个 Y 值 。The -values are the result of substituting values into the function. You organize the information using a table of values or a t-table. In most cases, the input values could be any numbers. However, for our convenience, you will use negative numbers, zero, and positive numbers for the -values.
::Y 值是将 x 值替换为函数的结果。您使用数值表或t-table来组织信息。在大多数情况下,输入值可以是任意数字。然而,为了方便我们,您会使用负数、零和正数来表示 x 值。Let’s look at an example.
::让我们举个例子。Complete a table of values for the function .
::完成函数 y=x2+3x+2 的值表。Evaluating a quadratic function is always the same. You substitute the -values into the equation and solve for the -values.
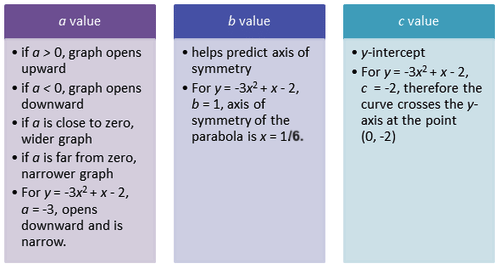
::评估二次函数总是相同的。 您可以在公式中替换 X 值, 并解决 Y 值 。The values of and have an effect on the graph of quadratic equation . Now you are going to use this information when you look at a quadratic function. What you know about the values of and help you to understand the opening of a parabola .
::a, b, 和 c 的值对二次方程图有影响。 现在您将使用此信息查看二次方程函数。 您对a, b 和 c 的值了解多少, 有助于您理解 parbola 的打开 。The graph of a quadratic function will always be a parabola. A parabola is a kind of “U”- shape that is always symmetrical on both sides. It can go either open upwards or downwards. Also, a parabola is not linear.
::二次函数的图形将始终是抛物线。 抛物线是一种“ U”形,在两侧总是对称的,可以向上或向下打开。 另外,抛物线也不是线性。The shape of the parabola can be predicted by the value of ‘ ’. If then the parabola opens upward. If then the parabola opens downward.
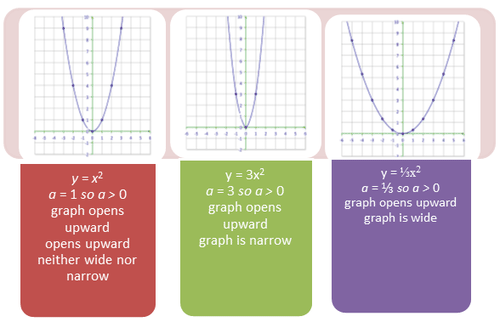
::抛物线的形状可以用 `a' 的值来预测。 如果 a > 0, 抛物线向上打开。 如果 < 0, 抛物线向下打开。Take a look at the image below for some examples.
::以下面的图像为例。Now that you understand how these graphs look and how the equation of the graph affects its appearance, it is time to make some predictions.
::现在你明白这些图表的外观和图形的方程式 如何影响其外观了, 现在是时候做出一些预测了。Let’s look at an example.
::让我们举个例子。What would you predict about the graph of ?
::你对y=7x2的图表有什么预测?Because the ‘ ’ value is 7, it would be very narrow.
::因为“a”值是7, 它会非常狭窄。Also, because , it would open upward.
::而且,因为一个 > 0, 它会向上打开。Examples
::实例Example 1
::例1Earlier, you were given a problem about Mr. Travis and the problem.
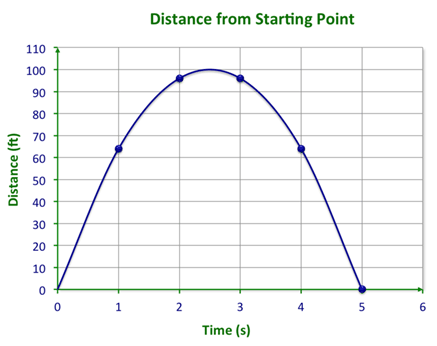
::早些时候,你被问及 Travis先生和问题。First, think about the information given in the problem and write an equation to model it.
::首先,考虑一下问题中所提供的信息,然后写一个方程式来模拟它。Next, make a table of values.
::下一位, 绘制一个数值表 。0 1 2 3 4 5 0 64 96 96 64 0 Finally, enter these values into a graphing calculator to create the following graph.
::最后,将这些数值输入一个图形计算器,以创建下图。Example 2
::例2What would you predict about the graph of ?
::你对y14x2的图表有什么预测?Because the ‘ ’ value is , it would be very wide.
::因为“a”值是-14, 它会非常广泛。Also, because , it would open downward.
::而且,因为一个 <0,它会向下开放。Example 3
::例3Predict the opening of .
::预测 y3x2+4 的打开时间 。It will open downwards because the ‘ ’ value is negative.
::它会向下打开,因为“a”值为负值。Example 4
::例4For the quadratic function in Example 1, where will the vertex be?
::对于例1中的二次函数,顶点在哪里?As you can see from the graph, t he vertex is (2.5, 100).
::从图中可以看出,顶点是(2.5、100)。Example 5
::例5Which graph will have a wider opening one with a vertex at 0 or one with a vertex at 8?
::哪个图形的首页宽一点, 0 点为顶点, 8点为顶点 ?Vertex at 0 is the wider opening.
::0点时的顶点是更宽的开口Review
::回顾Use your tables to graph the following functions.
::使用表格绘制下列函数的图形。-
::y=x2-8 -
::y= 3x2 - x+4 y= 3x2 - x+4 -
::y= 2x2+4 y= 2x2+4 -
::2y=4x2+4 -
::3y=6x2+12 -
::4y=2x2-12 -
::3- 1=6x2+11 -
::2 y+2=2x2+4 -
::y2x2+5x -
::yx2+3x-7 -
::y= 23x2+2x-1 -
::y=x2+8 -
::y2x2+5x-1 -
::yx2+3x- 1 -
::y=3x2+2x+1
Review (Answers)
::回顾(答复)Click to see the answer key or go to the Table of Contents and click on the Answer Key under the 'Other Versions' option.
::单击可查看答题键, 或转到目录中, 单击“ 其他版本” 选项下的答题键 。 -