2.11 切切图和切切图
Section outline
-
What if your instructor gave you a set of graphs like these:
::如果你的教官给你 一套像这样的图表:and asked you to identify which were the graphs of the tangent and cotangent functions?
::并且要求你确定哪些图表 是正切和余切函数的图形?Tangent and Cotangent Graphs
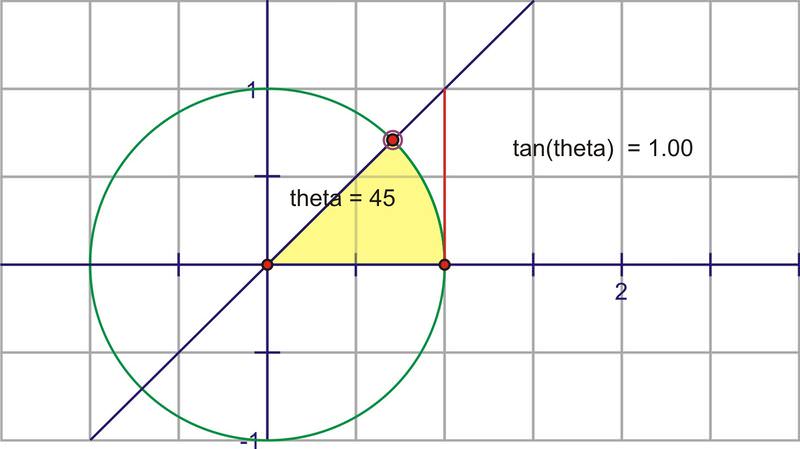
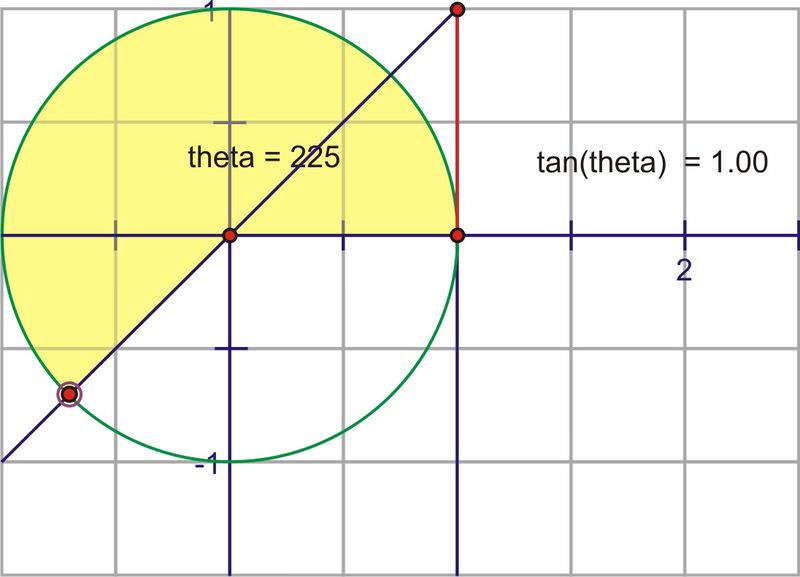
::切切图和切切图The name of the tangent function comes from the tangent line of a circle. This is a line that is perpendicular to the radius at a point on the circle so that the line touches the circle at exactly one point.
::相切函数的名称来自圆的正切线。这是一个与圆上一个点半径垂直的线,这样一线就能将圆触碰到一个点。If we extend angle through the unit circle so that it intersects with the tangent line, will be equal to the length of the red segment. Below, this segment is labeled the "tangent segment".
::如果我们通过单位圆延伸角度 ,使其与正切线交错, tan 将等于红色段的长度。 下面, 这个段标有“ 断断段 ” 的标签 。Why? The dashed segment is 1 because it is the radius of the unit circle. Recall that in general, . So here,
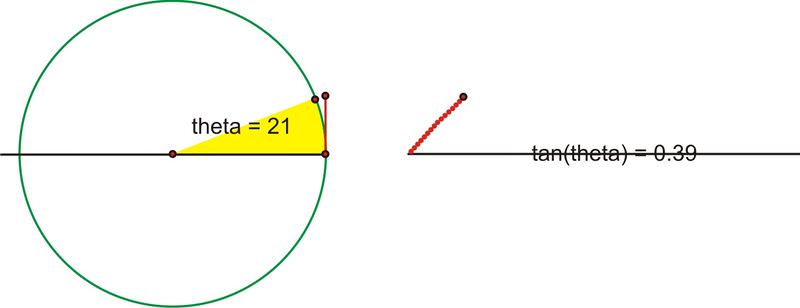
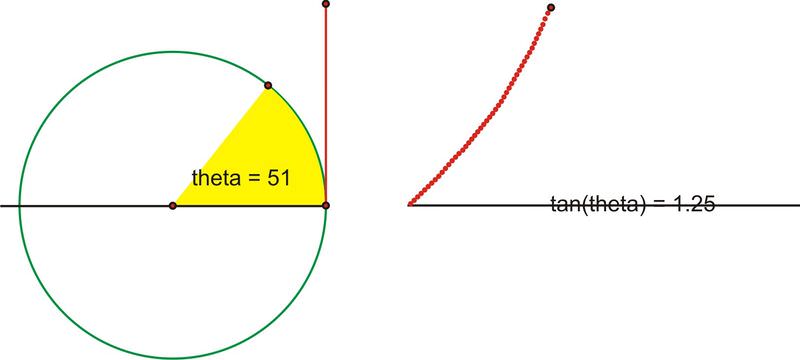
::为什么? 破折线段是 1, 因为它是单位圆的半径。 请回想一下, 普通的 tan yx 。 所以这里, tan 切片段1 = 切断段 。As the value of increases, the value of changes. As we rotate through the first quadrant, the value of will increase very slowly at first and then more rapidly.
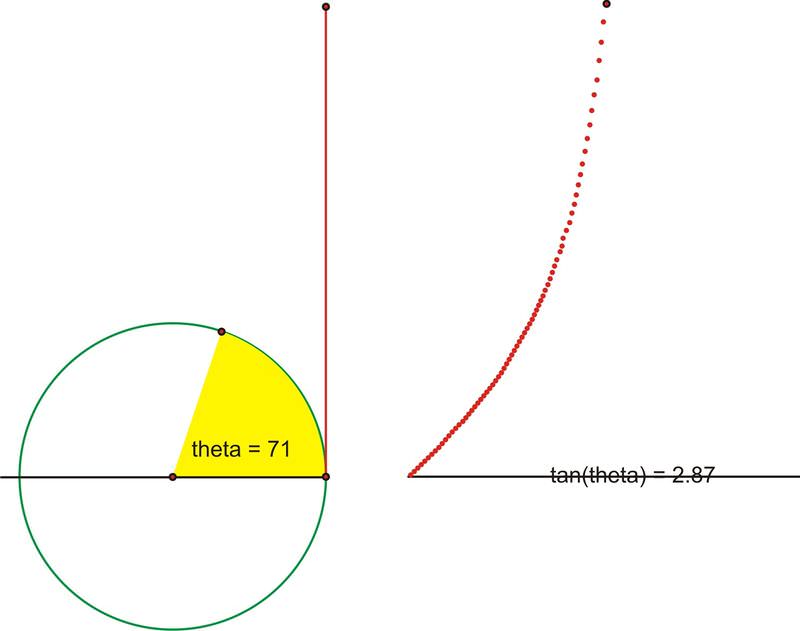
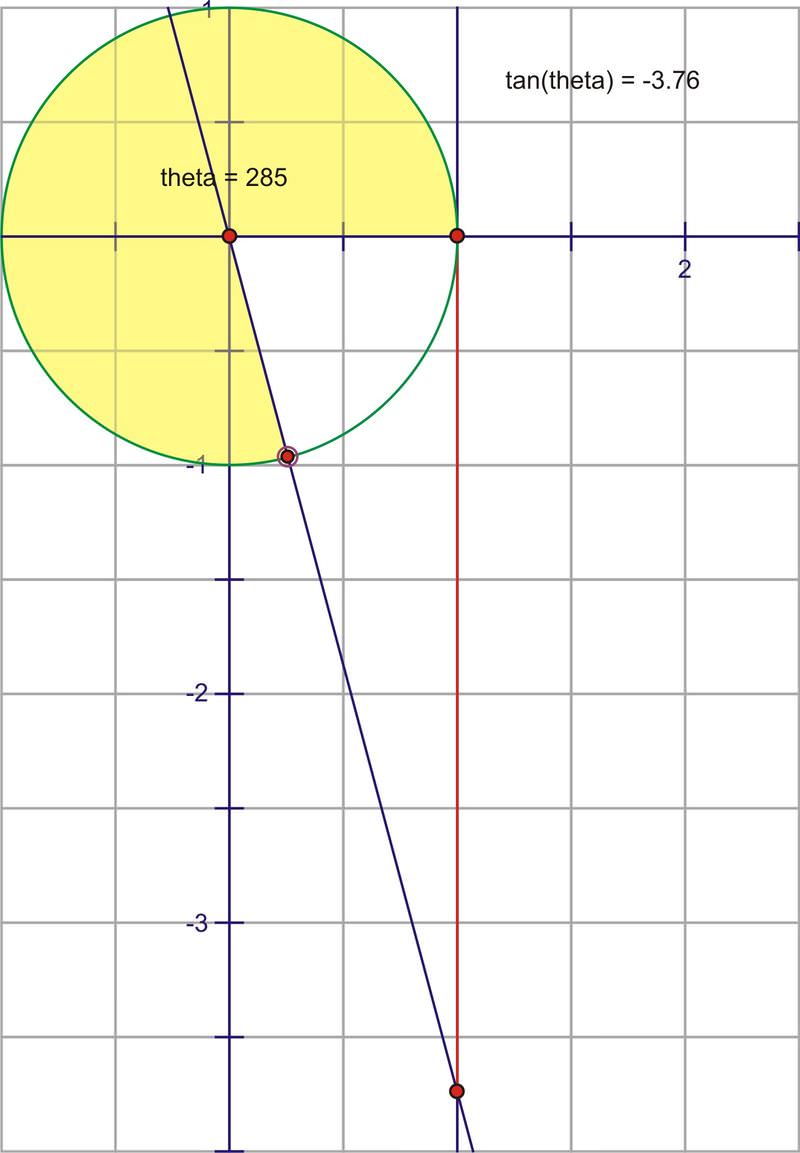
::随着 值的增加, tan 值的变化。 当我们旋转过第一个象限时, tan 值一开始会非常缓慢地增长, 然后更快地增长 。As we get very close to the axis the segment gets infinitely large, until when the angle really hits , at which point the extension of the angle and the tangent line will actually be parallel and therefore never intersect.
::当我们非常接近 y - 轴时, 这部分会变得无限大, 直到当角度真正击中 90 , 此时角的延伸 和正切线 将实际上平行, 因此永远不交叉 。This means there is no finite length of the tangent segment, or the tangent segment is infinitely large .
::这意味着相切部分的长度没有限制,或相切部分的长度无限大。Let’s translate this portion of the graph onto the coordinate plane. Plot as .
::让我们将图表的这一部分翻译到坐标平面上。 plot (,tan) 改为 (x,y) 。In fact as we get infinitely close to , the tangent value increases without bound, until when we actually reach , at which point the tangent is undefined. Recall there are some angles ( and , for example) for which the tangent is not defined. Therefore, at these points, there are going to be vertical asymptotes.
::事实上,当我们无限接近 90 时,正切值会毫无约束地增加,直到我们实际达到 90 , 此时正切值是未定义的。 回顾有些角度( 比如 90 和 270 ) 的正切值没有被定义。 因此,在这些点上, 将会出现垂直的零点 。Rotating past , the intersection of the extension of the angle and the tangent line is actually below the axis. This fits nicely with what we know about the tangent for a quadrant angle being negative. At first, it will have very large negative values, but as the angle rotates, the segment gets shorter, reaches 0, then crosses back into the positive numbers as the angle enters the quadrant. The segment will again get infinitely large as it approaches . After being undefined at , the angle crosses into the quadrant and once again changes from being infinitely negative, to approaching zero as we complete a full rotation.
::过去 90 旋转时, 角的延伸和正切线的交叉点实际上低于 x- 轴。 这与我们所知道的第二个象限角的正切值为负值非常吻合。 首先, 它会有很大的负值, 但当角旋转时, 区段会变短, 达到 0, 然后随着角进入第三个象限, 则会回溯到正数 。 当角进入第三个象限时, 区段会再次变得无限大, 当它接近 270 时。 在未定义 270 时, 角度交叉点会进入第四个象限, 并再次从无限的负值变为零, 当我们完成完全旋转时, 接近零 。The graph over several rotations would look like this:
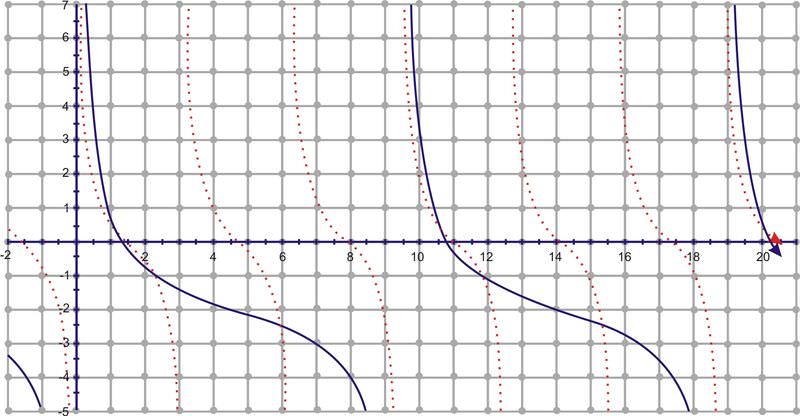
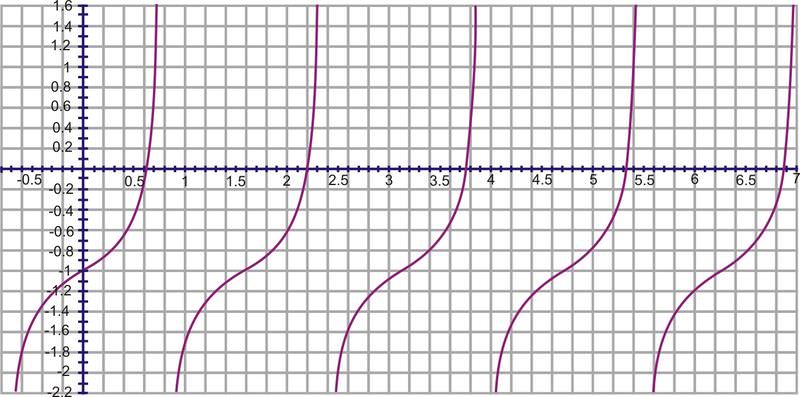
::以 y=tanx 表示数个旋转的图形将看起来如此 :Notice the axis is measured in radians. Our asymptotes occur every radians, starting at . The period of the graph is therefore radians. The domain is all reals except for the asymptotes at and the range is all real numbers.
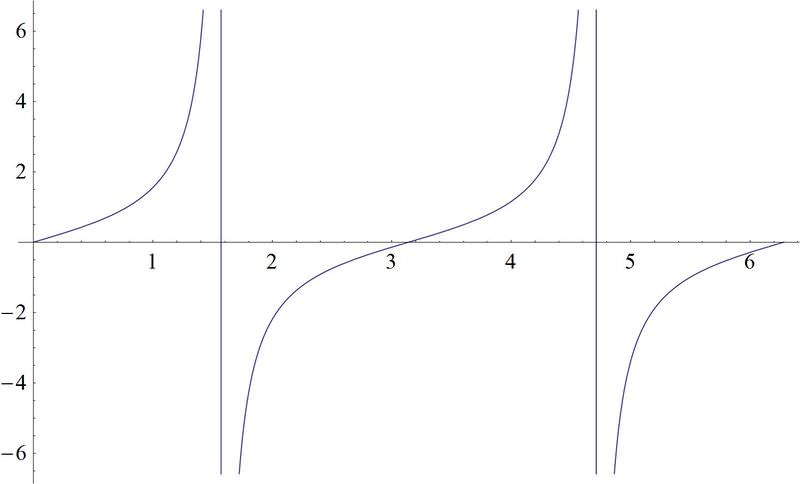
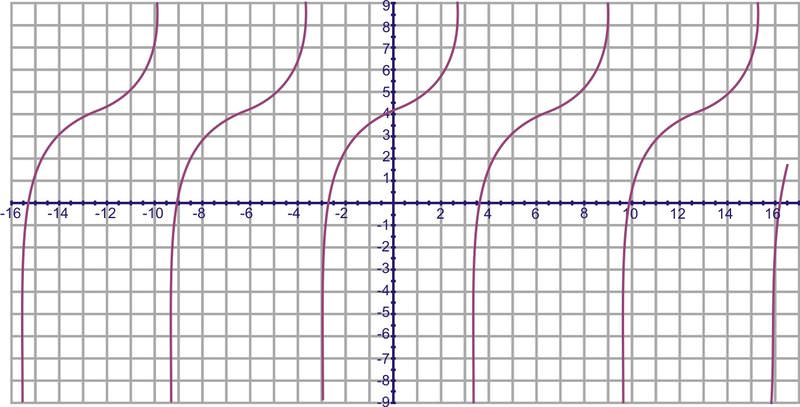
::注意 x - 轴以弧度测量。 我们的微秒从 + 2 开始, 每个弧度都会发生。 因此, 图形的周期是 + 弧度 。 域是除 $ 2, 3°2, 2, 2, etc. 外的所有真数, 范围都是真实数字 。Cotangent is the reciprocal of tangent, , so it would make sense that where ever the tangent had an asymptote, now the cotangent will be zero. The opposite of this is also true. When the tangent is zero, now the cotangent will have an asymptote. The shape of the curve is generally the same, so the graph looks like this:
::共切值是正切值的对等值, xy, 所以它会很有意义, 如果正切值有一个零点, 现在余切值将是零 。 与此相反的是, 当正切值为零时, 余切值将是一个零点。 曲线的形状一般都是一样的, 所以图表是这样的 :When you overlap the two functions, notice that the graphs consistently intersect at 1 and -1. These are the angles that have as reference angles, which always have tangents and cotangents equal to 1 or -1. It makes sense that 1 and -1 are the only values for which a function and it’s reciprocal are the same. Keep this in mind as we look at cosecant and secant compared to their reciprocals of .
::当您将两个函数重叠时, 请注意, 图形在 1 和 - 1 时始终交叉 。 这些是有 45 作为参考角度的角, 始终有正切值和余切值等于 1 或 - 1 。 这说明 1 和 - 1 是函数和对等值相同的唯一值 。 当我们查看 cosecant 和 separant 时, 请记住这一点 。The cotangent function has a domain of all real angles except multiples of The range is all real numbers.
::余切函数包含所有真实角度的域, 除了%...- 2,%,%,%,%,%0,%2...} 范围全部是真实数字 。Sketching Graphs
::切入图1. Sketch the graph of over the interval
::1. 在间距[0,6]间距间距下绘制 g(x) @%2+cot}}13x的图形Starting with , would be shifted down two and frequency is , which means the period would be , instead of . So, in our interval of there would be two complete repetitions. The red graph is
::从y=cotx开始, g(x) 将会向下移动两个频率, 频率为 13, 也就是说这个周期将是 3, 而不是 。 因此, 在 [ 6] 的间隔内, 将会有两个完整的重复。 红图是 y=cotx 。2. Sketch the graph of over the interval
::2. 在间隔期间绘制y3tan(x4)的图 [2]If you compare this graph to , it will be stretched and flipped. It will also have a phase shift of to the right. The red graph is
::如果您将该图与 y=tanx 比较, 它将被拉伸和翻转。 它也会向右移动 4。 红图是 y=tanx 。3. Sketch the graph of over the interval
::3. 在间距[0,2]内平铺 h(x)=4tan(x)2+3的图示The constant in front of the tangent function will cause the graph to be stretched. It will also have a phase shift of to the left. Finally, the graph will be shifted up three. Here you can see both graphs, where the red graph is .
::相切函数前的常数将使图形被拉伸。 它也会向左移动 2 。 最后, 图形会向上移动 3 个。 您可以在这里看到两个图形, 红色图形是 y=tanx 。Examples
::实例Example 1
::例1Earlier, you were asked to identify which graphs are tangent and cotangent.
::早些时候,有人要求你确定哪些图表是正切和正切的。As you can tell after completing this section, when presented with the graphs:
::填写完本节后,当与图表一起展示时,你可以看到:1
2
3
4
5
6
The tangent and cotangent graphs are the third and sixth graphs.
::相切图和相切图是第三图和第六图。Example 2
::例2Graph
::y1+13cot%2xExample 3
::例3Graph
::图f(x)=4+tan(0.5(x))Example 4
::例4Graph
::y2tan2xReview
::回顾Graph each of the following functions
::以下函数的图图 :-
:fx)=tan(x)
-
::h(x) =tan( 2x) -
: -
: -
::g (x) (2x) +3 -
: -
::h(x) = Cot( 2x) -
: -
: -
::g(x) @% 2+3cot}( 2x) @ label -
::h(x) =tan(x2) -
: -
: -
::g(x) = 3tan(x2) - 1 -
::h(x) = Cot(x2) -
: -
: -
::g(x) =2- 3cot(x2+32)
Review (Answers)
::回顾(答复)Click to see the answer key or go to the Table of Contents and click on the Answer Key under the 'Other Versions' option.
::单击可查看答题键, 或转到目录中, 单击“ 其他版本” 选项下的答题键 。 -