2.17 三角特征和等同
章节大纲
-
Your math teacher has decided to give you a quiz to see if you recognize how to combine changes to graphs of functions. You recall that you've learned about shifting graphs, as well as stretching/dilating them. But now your teacher wants to see if you know how to combine both of these effects into one graph. She gives you the equation:
::您的数学老师决定给您一个测验, 检查您是否认识如何将修改与函数图形结合起来。 您记得您已经学会了如何移动图形, 以及拉伸/ 平整这些图形。 但现在您的老师想看看您是否知道如何将这些效果结合到一个图形中。 她给了您一个等式 :
::f(x) = 3+7sin ( 4(x) 2)and asks you to plot the equation, and then identify what each part of the above equation does to change the graph.
::并请求您绘制方程式, 然后确定上述方程式的每个部分 是如何改变图形的 。Trigonometric Identities and Equations
::三角特征和等量T he general equations to translate and dilate sine and cosine waves both horizontally and vertically are: or , where is the , is the frequency, is the horizontal translation, and is the vertical translation .
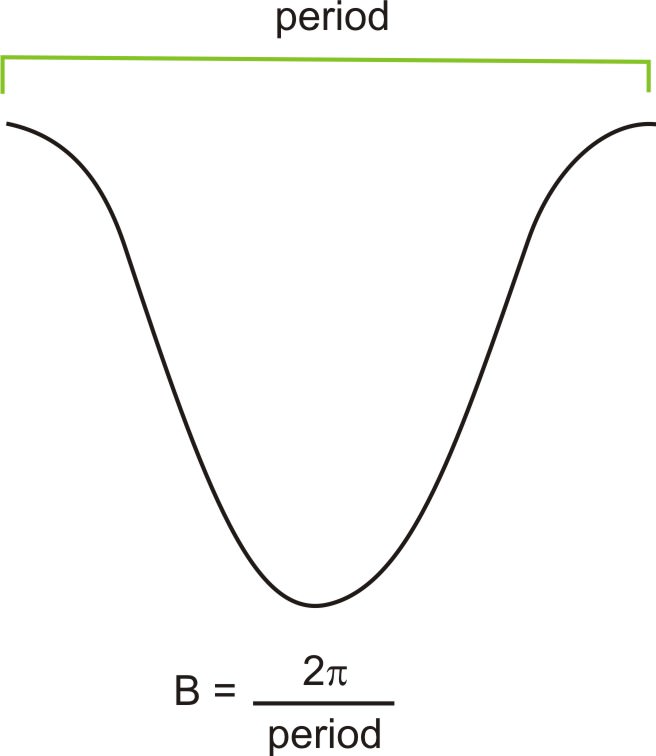
::要横向和纵向翻译和扩展正弦和共弦波的一般方程是:y=DAcos(B(xC))或y=DAsin(B(xC)),其中A为频率,B为频率,C为水平翻译,D为垂直翻译。Recall the relationship between period, , and frequency, .
::回顾期、p和频率之间的关系,B。
::p=2B和B=2pWith this knowledge, we should be able to sketch any sine or cosine function as well as write an equation given its graph.
::有了这种知识,我们就应该能够绘制任何正弦或余弦函数,并根据图表写出一个方程。Let's take a look at some problems involving trigonometric identities and equations.
::让我们来看看一些问题 涉及三角特征和方程。1. Given the function:
::1. 给定函数: f(x)=1+2sin(2(x))a. Identify the period, amplitude, and frequency.
::a. 标明期间、振幅和频率。From the equation, the amplitude is 2 and the frequency is also 2. To find the period we use:
::从方程中,振幅是2,频率也是2,要找到我们所用的时间:
::p=2Bp=222So, there are two complete waves from and each individual wave requires radians to complete.
::因此,[0,2]有两波完整的波,每个波需要 弧度来完成。b. Explain any vertical or horizontal translations present in the equation.
::b. 解释方程中存在的任何纵向或横向翻译。and , so this graph has been translated 1 unit up, and units to the left.
::D=1 和 C, 因此此图已被翻译为 1 个单位向上, 和 单位向左 。c. Sketch the graph from to .
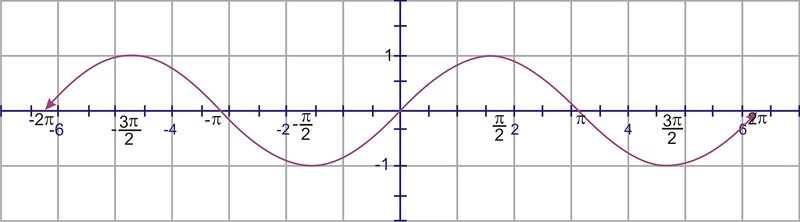
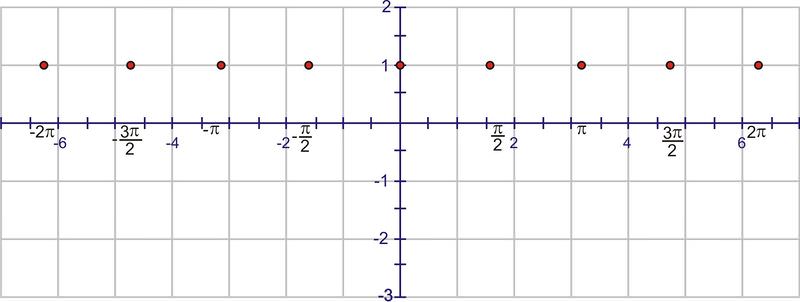
::c. 将图数从-2拖到-2。To sketch the graph, start with the graph of
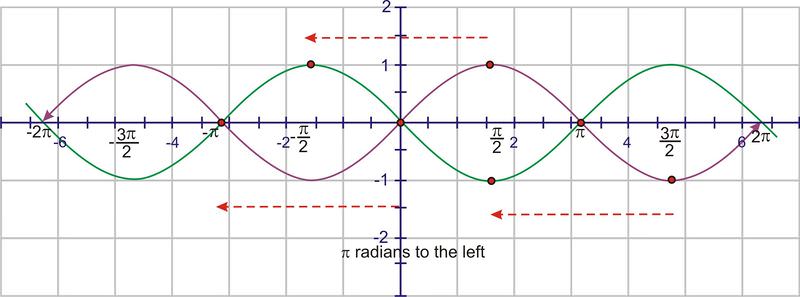
::要绘制图形图,请从 y=sin(x) 的图形开始Translate the graph units to the left (the value).
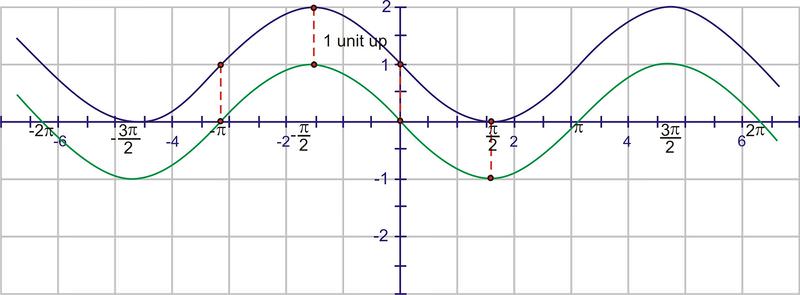
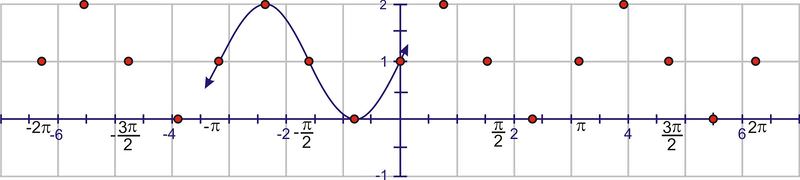
::将图形 ° 单位向左翻转( C 值) 。Next, move the graph 1 unit up ( value)
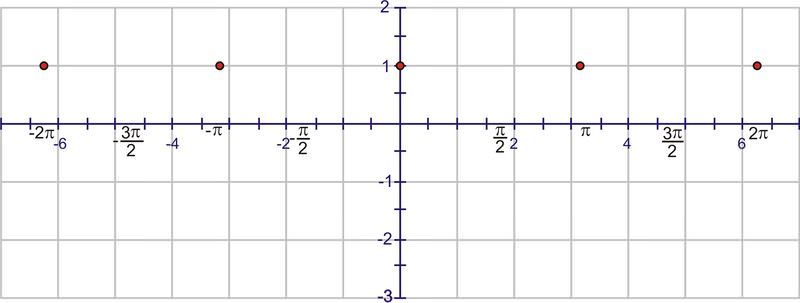
::下一步,将图形 1 单位向上移动( D 值)Now we can add the dilations. Remember that the “starting point” of the wave is because of the horizontal translation. A normal sine wave takes units to complete a cycle, but this wave completes one cycle in units. The first wave will complete at 0, then we will see a second wave from 0 to and a third from to . Start by placing points at these values:
::现在我们可以添加推算。 记住波的“ 起始点” 是因为水平转换 。 一个普通正弦波需要 2 ° 单位来完成一个周期, 但这个波以 ° 单位来完成一个周期 。 第一波将在 0 时完成, 然后我们将看到从 0 到 ° 的第二波, 从 到 2 ° 的第三波。 从这些值点开始 :Using symmetry, each interval needs to cross the line through the center of the wave.
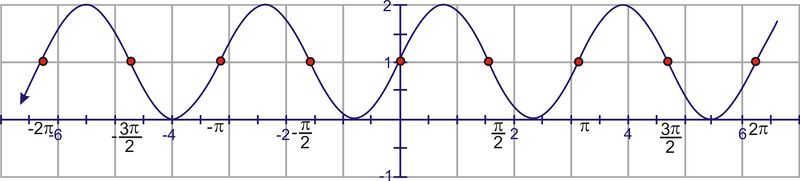
::使用对称,每个间隔需要通过波的中心横跨Y=1线。One sine wave contains a “mountain” and a “valley”. The mountain “peak” and the valley low point must occur halfway between the points above.
::山峰和山谷低点必须在上述两点之间的一半。Extend the curve through the domain.
::将曲线延伸至域域。Finally, extend the minimum and maximum points to match the amplitude of 2.
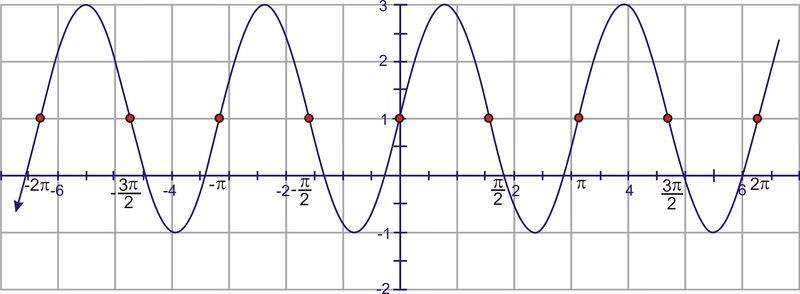
::最后,延长最低点和最高点,以适应2的振幅。2. Given the function:
::2. 给定函数: f( x) =3+3cos( 12( x) 2) 。a. Identify the period, amplitude, and frequency.
::a. 标明期间、振幅和频率。From the equation, the amplitude is 3 and the frequency is . To find the period we use:
::从方程中,振幅是3,频率是12,要找到我们所用的时间:
::=212=4So, there is only one half of a cosine curve from 0 to and each individual wave requires radians to complete.
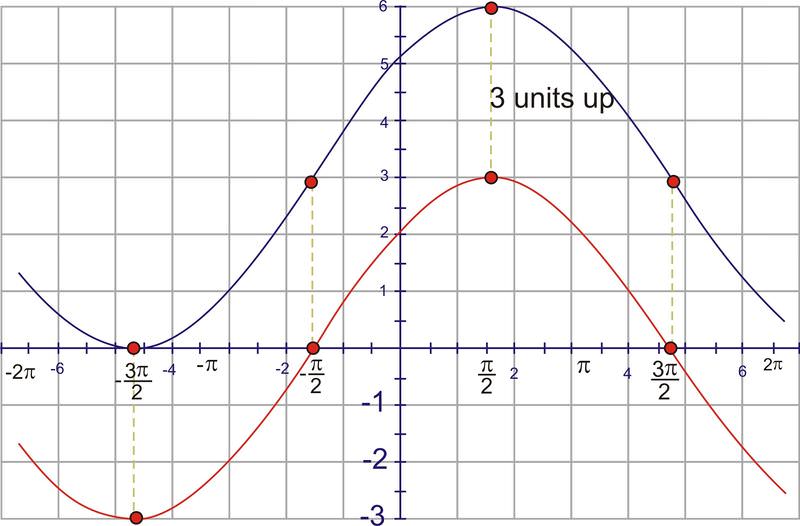
::因此,从0到2的余弦曲线只有一半, 每一波需要4弧度才能完成。b. Explain any vertical or horizontal translations present in the equation.
::b. 解释方程中存在的任何纵向或横向翻译。and , so this graph has been translated 3 units up, and units to the right.
::D=3和C=2,所以这个图将3个单位翻到右边,2个单位转到右边。c. Sketch the graph from to .
::c. 将图数从-2拖到-2。To sketch the graph, start with the graph of
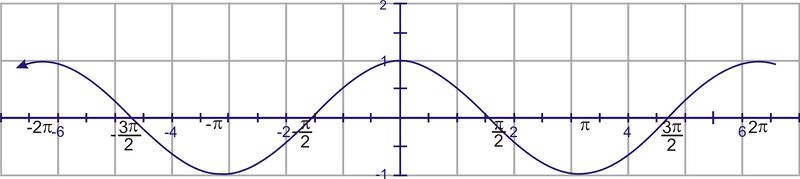
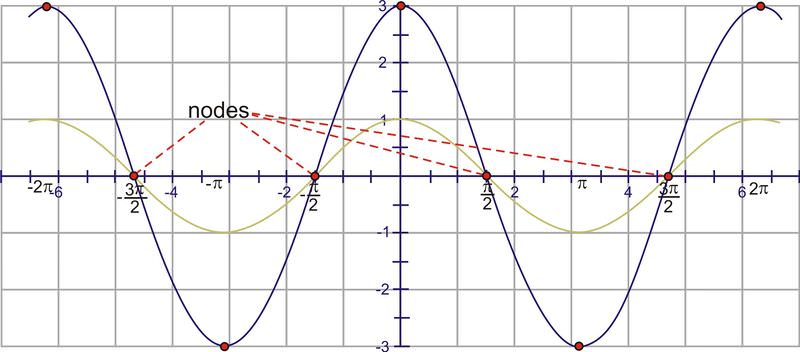
::要绘制图形图,请从 y=cos(x) 的图形开始Adjust the amplitude so the cosine wave reaches up to 3 and down to negative three. This affects the maximum points, but the points on the axis remain the same. These points are sometimes called nodes.
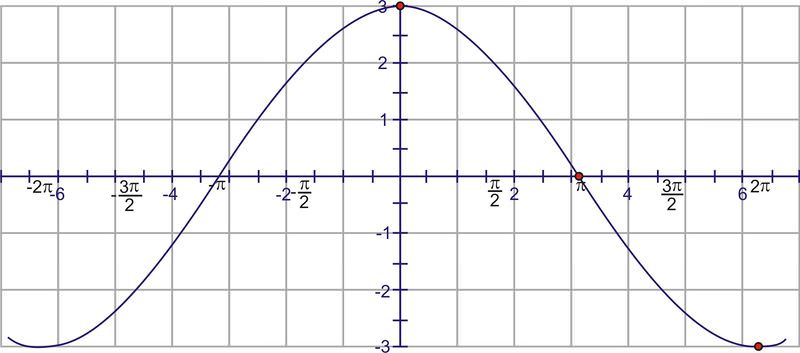
::调整振幅, 使余弦波达到最高 3, 向下为负 3。 这影响到最大点, 但 X - 轴上的点保持不变 。 这些点有时被称为节点 。According to the period, we should see one of these shapes every units. Because the interval specified is and the cosine curve “starts” at the axis, at (0, 3) and at the value is -3. Conversely, at , the function is also -3.
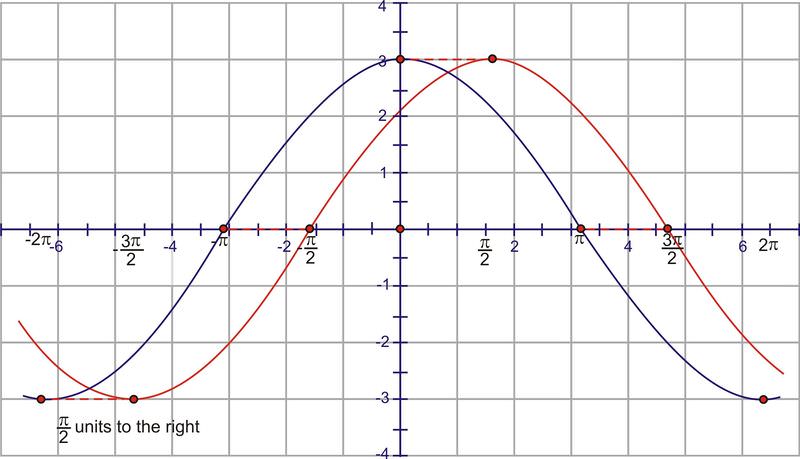
::按照这一时期,我们应该看到其中的形状,每4 个单位。因为指定的间隔是 [-2 , 2 ] ,而正弦曲线“开始”于 y- 轴, 0, 3, 2, 值为 - 3 。 相反, 在-2 , 该函数也是 - 3 。Now, shift the graph units to the right.
::现在,将图表% 2 单位向右移动。Finally, we need to adjust for the vertical shift by moving it up 3 units.
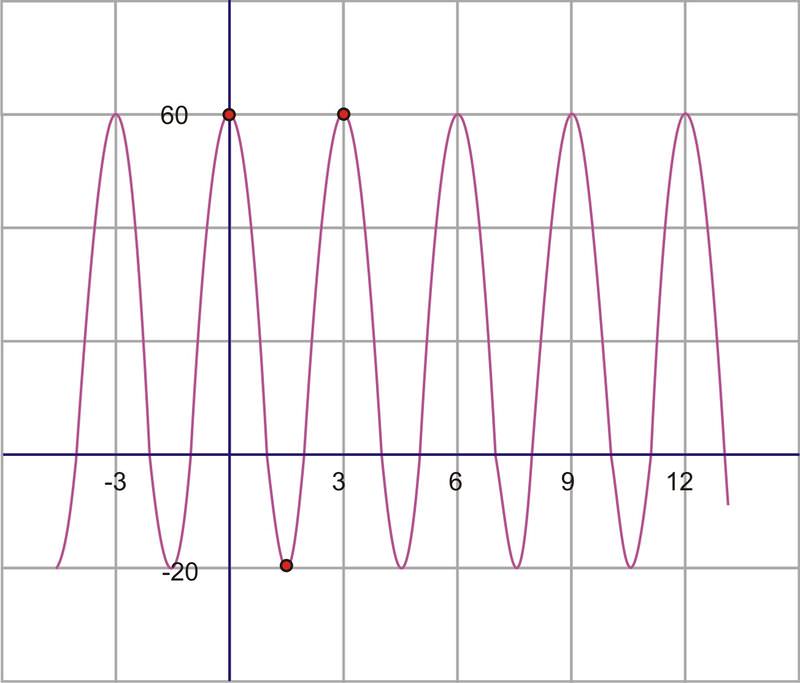
::最后,我们需要调整垂直变化,将其上移到3个单元。3. Find the equation of the sinusoid graphed here.
::3. 查找此处图解的骨髓图的方程。First of all, remember that either sine or cosine could be used to model these graphs. However, it is usually easier to use cosine because the horizontal shift is easier to locate in most cases. Therefore, the model that we will be using is .
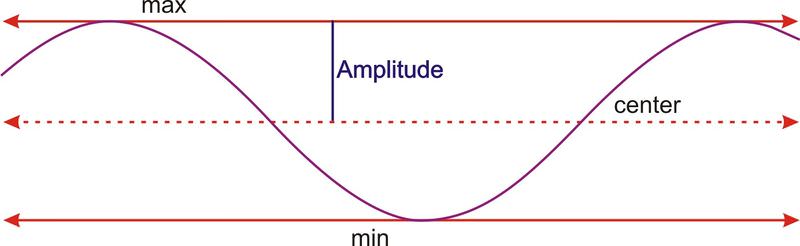
::首先,请记住,可以使用正弦或余弦来模拟这些图形。 但是,通常更容易使用余弦, 因为横向移动在多数情况下更容易定位。 因此, 我们将使用的模型是 y= D = Acos( B( xC) ) 。First, if we think of the graph as a cosine function, it has a horizontal translation of zero. The maximum point is also the intercept of the graph, so there is no need to shift the graph horizontally and therefore, . The amplitude is the height from the center of the wave. If you can’t find the center of the wave by sight, you can calculate it. The center should be halfway between the highest and the lowest points, which is really the average of the maximum and minimum. This value will actually be the vertical shift, or value.
::首先,如果我们把图形看作是一个余弦函数,它就会有一个零的水平转换。 最大点也是图形的y- interinterview, 所以不需要水平移动图形, 因此, C=0 。 振幅是从波的中心高度。 如果您无法通过视觉找到波的中心, 您可以计算它。 中心应该介于最高点和最低点之间, 也就是最大点和最小点的平均值。 这个值实际上是垂直移动, 或者D值 。
::D=中点=60202=402=20The amplitude is the height from the center line, or vertical shift, to either the minimum or the maximum. So, .
::振幅是从中线高度或垂直移动到最小值或最大值的高度。因此,A=60-20=40。The last value to find is the frequency. In order to do so, we must first find the period. The period is the distance required for one complete wave. To find this value, look at the horizontal distance between two consecutive maximum points.
::要找到的最后值是频率。 为了找到频率, 我们首先必须找到时间段。 时间段是整个波所需的距离。 要找到这个值, 请查看两个连续最高点之间的水平距离 。On our graph, from maximum to maximum is 3.
::在我们的图表上,从最大到最大是3。Therefore, the period is 3, so the frequency is .
::因此,周期是3, 所以频率是B=23。We have now calculated each of the four parameters necessary to write the equation. Replacing them in the equation gives:
::我们现在计算了写等式所需的四个参数的每一个参数。
::y=20+40cos=23xIf we had chosen to model this curve with a sine function instead, the amplitude, , as well as the vertical shift would all be the same. The only difference would be the horizontal shift. The sine wave starts in the middle of an upward sloped section of the curve as shown by the red circle.
::如果我们选择用正弦函数来模拟这个曲线, 则振幅和垂直变化都是一样的。 唯一的区别是水平变化。 正弦波从红圆所显示的曲线上斜坡部分开始。This point intersects with the vertical translation line and is a third of the distance back to -3. So, in this case, the sine wave has been translated 1 unit to the left . The equation using a sine function instead would have been:
::此点与垂直翻译线相交, 是返回 - 3 的距离的三分之一。 因此, 在此情况下, 正弦波已经向左翻译了 1 个单位。 使用正弦函数的方程式应该是 y= 20+ 40sin {( 2Q3( x+1) ) 。Examples
::实例Example 1
::例1Earlier, you were asked to plot .
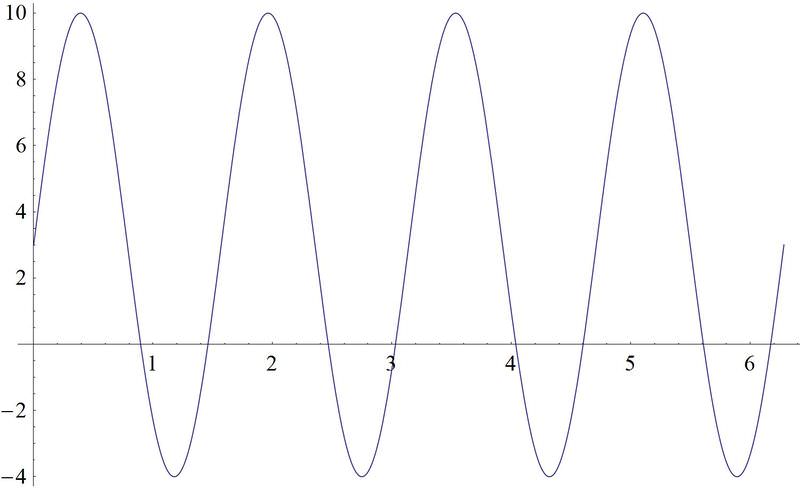
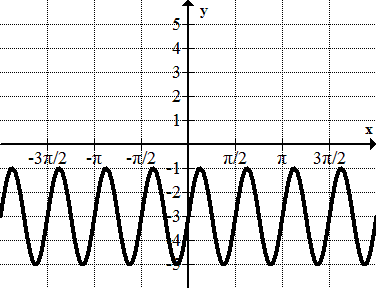
::早些时候,您被要求绘制 f( x) = 3+7sin}( 4 (x) 2) 。With your advanced knowledge of sinusoidal equations, you can identify in the equation:
::以你对正弦方程的先进知识 你可以在方程中辨别出:
::f(x) = 3+7sin ( 4(x) 2)The vertical shift of the graph is 3 units up. The amplitude of the graph is 7. The horizontal shift of the graph is units to the left. The frequency is 4.
::图形的垂直移动向上是 3 个单位。 图的振幅是 7 个单位。 图的横向移动向左是 2 个单位。 频率是 4 个单位。Since the frequency is 4, the period can be calculated:
::由于频率为4,可计算周期如下:
::p=2fp=242This means that the graph takes units to make one complete cycle.
::这意味着,图形需要% 2 个单位来完成一个完整的周期。The graph of this equation looks like this:
::这个方程式的图像是这样的:Example 2
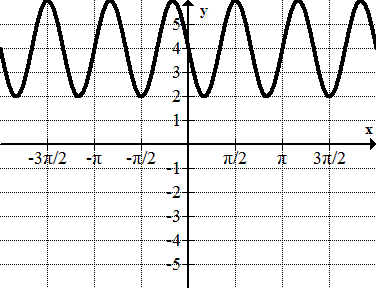
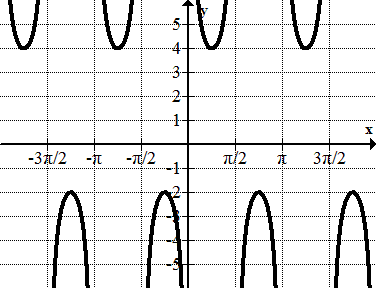
::例2Identify the amplitude, period, frequency, maximum and minimum points, vertical shift, and horizontal shift of
::确定y=2+3sin(2(x-1))的振幅、期间、频率、最大和最低点、垂直移动和水平移动。This is a sine wave that has been translated 1 unit to the right and 2 units up. The amplitude is 3 and the frequency is 2. The period of the graph is . The function reaches a maximum point of 5 and a minimum of -1.
::这是一个正弦波, 向右翻译了 1 个单位, 向上翻译了 2 个单位。 振幅为 3, 频率为 2 。 图形的周期为 * 。 函数达到最高点 5, 最低点为 - 1 。Example 3
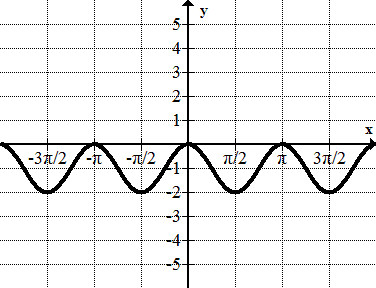
::例3Identify the amplitude, period, frequency, maximum and minimum points, vertical shift, and horizontal shift of
::确定y1+sin((x3)的振幅、周期、频率、最大和最低点、垂直移动和水平移动)。This is a sine wave that has been translated 1 unit down and radians to the left. The amplitude is 1 and the period is 2. The frequency of the graph is . The function reaches a maximum point of 0 and a minimum of -2.
::这是一个正弦波, 向下翻译了 1 个单位, 向左翻译了 + 3 弧度。 振幅为 1, 时段为 2 。 图形的频率为 * 。 函数达到最大点 0, 最低点为 - 2 。Example 4
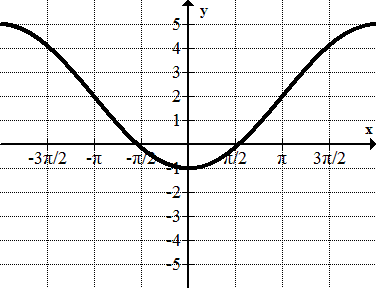
::例4Identify the amplitude, period, frequency, maximum and minimum points, vertical shift, and horizontal shift of
::确定y=cos(40(x-120)+5的振幅、期间、频率、最大和最低点、垂直移动和水平移动。This is a cosine wave that has been translated 5 units up and 120 radians to the right. The amplitude is 1 and the frequency is 40. The period of the graph is . The function reaches a maximum point of 6 and a minimum of 4.
::这是一个将5个单位向上和120个弧度向右翻转的余弦波。振幅为1,频率为40。图形的周期为 20。函数达到最大点为 6, 最低点为 4。Review
::回顾For each equation below, identify the period, amplitude, frequency, and any vertical/horizontal translations.
::对于以下的每一个方程式,请标明时期、振幅、频率和任何纵向/横向翻译。-
::y=2 - 4cos (23(x- 3)) -
::y=3+12sin(12(x)) -
::y=1+5cos( 4(x2)) -
::y=4 - cos( 2( x+1) ) -
::y=3+2sin(x-4)
Graph each of the following equations from to .
::以下方程式中从 -2 至 2 的每个方程图 。-
::y=1-3sin(13(x)) -
::y=5+12sin(12(x-2)) -
::y=2+cos(4(x2)) -
::y= 4+2cos (2( x+3)) -
::y=2-3sin(x-32)
Find the equation of each sinusoid.
::找到每个脊髓瘤的方程Review (Answers)
::回顾(答复)Click to see the answer key or go to the Table of Contents and click on the Answer Key under the 'Other Versions' option.
::单击可查看答题键, 或转到目录中, 单击“ 其他版本” 选项下的答题键 。 -