2.15 寻找利用图表计算计算器最适宜使用的平方
章节大纲
-
You might be familiar with the idea of calorie intake requirements, such as the guidelines shown in the table below. Use your calculator to find the line of best fit for the data .
::您可能熟悉卡路里摄入量要求的概念, 如下表显示的指导方针。 使用您的计算器来找到最适合数据的线 。Calorie Requirements (Male), 1-59 years
::Calorie 需求(男),1-59岁Age Range, 1-3 4-6 7-10 11-14 15-18 19-59 Calorie Needs, 1230 1715 1970 2220 2755 2550 The age is measured in years.
::年龄以岁数衡量。Finding the Equation of a Best Fit Using a Calculator
::查找使用计算器最合适计算公式的方程式We have already learned how to find the linear equation of best fit by hand. This entire process can also be done by your graphing calculator. It is recommended that you use a graphing calculator for two main reasons: accuracy and consistency. The graphing calculator will be more accurate than a calculation by hand and it will also be more consistent between students, or a greater likelihood that everyone will get the same answer.
::我们已经学会了如何用手来找到最合适的线性方程式。 整个过程也可以通过您的图形计算计算器来完成。 推荐您使用图形计算器有两个主要原因: 准确性和一致性。 图形计算器比用手来计算更准确, 学生之间也会更加一致, 或者每个人都更有可能得到相同的答案。Below is a table for the total number of home runs hit from 1990-2000.
::下表列出了1990-2000年全垒打总次数。Let's make a scatterplot using a graphing calculator.
::让我们用图形计算计算器做一个散射图。1990 1991 1992 1993 1994 1995 1996 1997 1998 1999 2000 3317 3383 3038 4030 3306 4081 4962 4640 5064 5528 5693 Recall that an ordered pair is a point, (1990, 3317), for example. In the graphing calculator, you will need to enter each ordered pair as an value and a value. To do this, you need to create lists. The values will be List1, or L1 and the values will be List2, or L2. Instructions below are for the TI 83/84.
::提醒注意定购一对是一个点, 例如( 1990, 3317) 。 在图形计算计算器中, 您需要将每对定购一对输入为 x- 值和 Y- 值。 要这样做, 您需要创建列表 。 x- 值将是 List1 或 L1, y- 值将是 List2 , 或者 L2 。 以下的说明是 TI 83/84 的 说明 。To create a list:
::要创建列表 :Step 1: Press STAT.
::第1步:新闻STAT。Step 2: In EDIT, select 1:Edit…. Press ENTER.
::步骤2:在EDIT中,选择1:编辑.按ENTER键。Step 3: The List table appears. If there are any current lists, you will need to clear them. To do this, arrow up to L1 so that it is highlighted (black). Press CLEAR, then press ENTER. Repeat with L2, if necessary.
::第3步:列表表格出现。如果有任何当前列表,您需要清除这些列表。要清除这些列表,请向L1箭头向上箭头,以便突出显示(黑色)。按 CLEAR 键,然后按 ENTER 键。如果需要,请重复 L2 。Step 4: Now, enter the data into the lists. Enter all the entries into L1 (years) first and press enter between each entry. Then, repeat with L2 and the total home run numbers. Your screen should look something like this when you are done.
::步骤 4 : 现在, 将数据输入列表中。 首先输入所有条目到 L1 (年份) , 然后按每个条目之间的输入。 然后, 重复使用 L2 和总主机运行数字 。 您的屏幕在完成后应该看到类似的东西 。Step 5: Press MODE (QUIT).
::步骤5:新闻第2版MODE(QUIT)。To graph the plot:
::图形图解 :Step 6: Press .
::步骤6:按Y=。Step 7: Clear any equations that are in the . To do this, arrow down to the equation and press CLEAR. Press MODE (QUIT).
::步骤7:清除Y=中的任何方程式。要做到这一点,请向方程式箭头箭头,按 CLEAR 键。按 2 MODE (QUIT) 键。Step 8: Press (STAT PLOT). Turn Plot1 on by highlighting On and pressing ENTER. Then, select the first option for the Type of stat plot. Make sure the list is L1 and the list is L2. To change these, scroll down to list (for example), and press 1 (L1). 2 is L2. Mark should also be on the first option.
::步骤 8 : 按 2ndY = (STAT PLOT) 。 通过突出显示和按 ENTER 来打开 plot1 。 然后, 为状态图类型选择第一个选项 。 请确定 Xlist 是 L1, Ylist 是 L2 。 要更改这些选项, 请滚动到 Xlist (例如) , 按 2nd 1 (L1) , 2nd 2 应该是 L2 。 Mark 也应该在第一个选项上 。Step 9: Press GRAPH. Nothing may show up. If this is the case, press ZOOM and scroll down to 9:ZoomStat . Press ENTER. Your plot should look something like this.
::步骤9:按 GrashPH。 没有什么可能出现。 如果是这样的话, 按 ZOOM 键并滚动到 9: ZomStat 。 按 ENTER 键。 您的图案应该是这样的 。Now you can f ind the equation of best fit for the data , with a graphing calculator.
::现在您可以找到最适合数据方程式, 并使用图形化计算器 。To find the equation of best fit: (In the TI 83/84, it is also called Linear Regression , or LinReg)
::为了找到最合适的等式在TI 83/84中,它也称为线性倒退,或林Reg)
Step 1: After completing steps 1-5 above (to make the list), press STAT and then arrow over to the CALC menu.
::第1步:完成以上步骤1-5(编制清单)后,按STAT键,然后向CALC菜单箭头箭头。Step 2: Select 4:LinReg . Press ENTER.
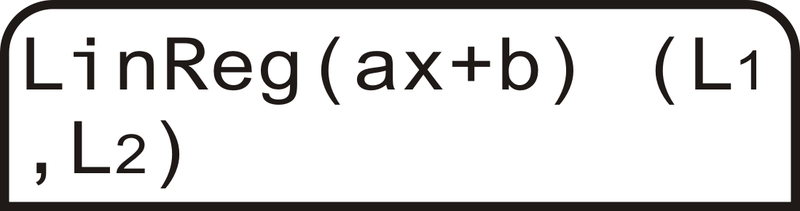
::第2步:选择 4: LinReg( 轴+b) 。 按 ENTER 键 。Step 3: You will be taken back to the main screen. Type (L1,L2) and press ENTER. L1 is 1, L2 is 2 and the comma is the button above the 7.
::步骤 3 : 您将被带回主屏幕 。 类型 (L1, L2) 并按 ENTER 键。 L1 是 2 1, L2 是 2 2 , 逗号是 7 上方的按钮 。Step 4: The following screen shows up. To the calculator, is the slope and is still the intercept. Therefore, the equation of the line is .
::第4步:下面的屏幕显示。 在计算器中, a 是斜度, b 仍然是y- interfict。 因此, 线的方程式是 y= 267. 4x+2939. 55 。Step 5: If you would like to plot the line on the scatterplot, press and enter in the equation from Step 4: . Press GRAPH.
::第5步:如果你想在散射点上绘制线条,请按 Y = 键,并从第4步 y= 267.4x+2939.55 键入方程。按 GRAPH 键。Use the same equation found in Step 4 above ( ) to predict the number of home runs hit in 2015.
::使用上面第4步(y=267.4x+2939.55)中的相同方程式预测2015年全垒打次数。Use because is 1990. Plug into the linear regression equation,
::使用 x=25, 因为 x=0 是1990 。 插入线性回归方程的 y= 267.4x+2939. 55
::y=267.4(25)+2939.55y=9624.55Because we cannot have a fraction of a home run, round up to 9625.
::因为我们不能把全垒打 集中到9625Examples
::实例Example 1
::例1Earlier, you were asked to use your calculator to find the line of best fit for the data given about calorie intake for males.
::早些时候,你被要求使用计算器 找到最适合男性卡路里摄入量数据的方法Following the steps outlined in this concept on your calculator, the line of best fit is .
::按照计算器上这个概念中概述的步骤,最合适的线是y=1076.333333333333+284.85714285714x。Round all answers to the nearest hundredth.
::所有答案的回合 最近的第一百个。Example 2
::例2Use the following data set and find the equation of best fit with the graphing calculator. Also find the equation of best fit by hand. Then, use both equations to find the sales for 2010 and compare your answers.
::使用以下数据集, 并找到最适合图形计算器的方程式 。 同时用手找到最适合的方程式 。 然后, 使用两个方程式来找到2010年的销售量, 并比较您的答案 。Source: CNN
::资料来源:CNN。You do not have a table, so you need to estimate the values from the scatterplot. Here is a sample table for the scatterplot. Remember, this is years vs. money, in billions.
::您没有表格, 因此您需要从撒布图中估算值 。 这是撒布图的样本表格 。 记住, 这是年份对货币的比较, 以亿计 。1999 (0) 2000 (1) 2001 (2) 2002 (3) 2003 (4) 2004 (5) 2005 (6) 2006 (7) 2007 (8) 2008 (9) 2009 (10) 14.8 14.1 13.8 13 12 12.8 13 12.3 11 9 6.2 Now, using the steps illustrated in this concept, determine the equation of best fit using your graphing calculator. If you used the data set above, you should get . Using the calculator’s equation for 2010 (11), we get billion.
::现在,使用这个概念所展示的步骤,使用您的图形计算计算器来确定最适合的方程。 如果您使用上面的数据集, 您应该得到 y. 66x+15.28。 使用2010 (11) 计算器的方程, 我们得到 y. 66 (11)+15.28=80.2亿。To find the equation of best fit by hand, use these steps to help you.
::为了用手来找到最合适的方程式, 用这些步骤来帮助你。Step 1: Draw the scatterplot on a graph.
::步骤 1: 在图表中绘制散射图 。Step 2: Sketch the line that appears to most closely follow the data. Try to have the same number of points above and below the line.
::第2步: 将似乎最密切跟踪数据的线条拉平。 尽量在线上和线下有相同数目的点 。Step 3: Choose two points on the line and estimate their coordinates. These points do not have to be part of the original data set.
::第3步:在线上选择两点并估计其坐标。这些点不一定是原始数据集的一部分。Step 4: Find the equation of the line that passes through the two points from Step 3.
::第4步:找出从第3步经过两点的线的方程式。Let’s use these steps on the graph above. We already have the scatterplot drawn, so let’s sketch a couple lines to find the one that best fits the data.
::让我们在上面的图表上使用这些步骤。 我们已经绘制了散射图, 因此让我们绘制几条线来找到最适合数据的行。From the lines in the graph, it looks like the purple line might be the best choice. The red line looks good from 2006-2009, but in the beginning, all the data is above it. The green line is well below all the early data as well. Only the purple line cuts through the first few data points, and then splits the last few years. Remember, it is very important to have the same number of points above and below the line.
::从图表中的线条看,紫线似乎是最好的选择。 红线从2006-2009年看起来不错, 但一开始, 所有的数据都高于它。 绿线也远远低于所有早期的数据。 只有紫线通过前几个数据点的切分, 然后将过去几年分割开来。 记住, 在线上和线下有相同数量的点非常重要 。Using the purple line, we need to find two points on it. The second point, crosses the grid perfectly at (2000, 14). Be careful! Our graph starts at 1999, so that would be considered zero. Therefore, (2000, 14) is actually (1, 14). The line also crosses perfectly at (2007, 10) or (8, 10). Now, let’s find the slope and intercept.
::使用紫色线, 我们需要找到两点。 第二点, 在(2000, 14) 时完全跨过网格 (2000, 14) 。 请注意 ! 我们的图表从1999年开始, 这样算为零 。 因此, (2000, 14) 实际上是(1, 14) 。 这条线在(2007, 10) 或 (8, 10) 或 (8, 10) 时也完全跨过。 现在, 让我们找到斜坡和 y- intercut 。
::m=14 - 101 - 8 - 8 47
::y+47x+b14+47(1)+b14+0.57+b14.57=bThe equation of best fit is .
::最合适的方程式是y47x+14.57。To predict music sales in 2010, plug in 2010 for in the equation we found solving by hand and solve for .
::为了预测2010年的音乐销售量,2010年我们发现通过人工解答和y解答的方程式中 x 的插件在2010年插入 。
::y47(2010-2019年)+14.57y47(11)+14.57y=8.3Using th is equation , we get billion.
::使用这个方程式,我们得到y0.57(11)+14.57=83亿。As you can see, the answers are pretty close.
::如你所见,答案非常接近Example 3
::例3Use the following data set and find the equation of best fit with the graphing calculator. Also find the equation of best fit by hand. Then, use both equations to find the sleep requirements for 2.5 years (30 months) and compare t he two answers.
::使用以下数据集, 并找到最适合图形计算器的方程式 。 并用手找到最适合的方程式 。 然后, 使用两个方程式来找到2.5 年( 30 个月) 的睡眠要求, 并比较两个答案 。Sleep Requirements, 0-3 years
::0-3年睡眠要求,0-3年Age, 1 3 6 9 12 18 24 36 Sleep, 16 15 14.25 14 13.75 13.5 13 12 The age is measured in months and sleep is measured in hours.
::年龄以月计,睡眠以小时计。Using the steps illustrated in this concept, we get as the line of best fit on our calculator.
::使用这个概念所展示的步骤, 我们得到Y0.096x+15.25 作为我们计算器上最合适的线条。To find the line of best fit by hand, use the steps from Example 2 again.
::为了亲手找到最合适的线条,请再次使用例2中的步骤。Plot the points and then draw a line. Two points that seem to be on the line are (3, 15) and (24, 13).
::绘制点数然后绘制线条。 似乎线条上有两点( 3, 15) 和 (24, 13) 。
::=15-133-2422115221(3)+b150.29+b15.29=bSo the equation of the line by hand is or
::因此,用手对线的方程式是 y221x+15.29 或 y0.095x+15.29。To determine the amount of sleep needed for a 2.5 year old, you need to change the age to months so that it corresponds with the units used in the graph.
::为了确定2.5岁时所需的睡眠量,您需要将年龄改为月数,以便与图表中使用的单位相符。For a 2.5 year-old, or 30 month-old, s/he should sleep hours using the equation we found by hand.
::对于2.5岁或30个月大的人来说,S/他应该用我们手头找到的方程睡觉y221(30)+15.29+12.4小时。If you use the equation from the calculator, you get 12.37 hours. All in all, the answers are quite close.
::如果你使用计算器的方程, 就会得到12.37小时。 总之, 答案是相当接近的 。Review
::回顾Round all decimal answers to the nearest hundredth
::回合所有十进制回答最接近的第一百个答案1. Using the company stock data below:
::1. 使用以下公司存量数据:-
Find the equation of best fit with your calculator. Set Oct. 2009 as
.
::查找最适合您的计算器的方程式。 设置2009年10月为 x=0 。
The price of a company's stock from Oct 2009 - Sept 2011
::2009年10月至2011年9月公司股票价格10/09 11/09 12/09 1/10 2/10 3/10 4/10 5/10 6/10 7/10 8/10 9/10 $181 $189 $198 $214 $195 $208 $236 $249 $266 $248 $261 $258 10/10 11/10 12/10 1/11 2/11 3/11 4/11 5/11 6/11 7/11 8/11 9/11 $282 $309 $316 $331 $345 $352 $344 $349 $346 $349 $389 $379 -
Predict the sales for January 2012.
::预测2012年1月的销售额。
2. Using the following Home Run data:
::2. 使用以下主运行数据:-
Find the equation of best fit with your calculator. Set 2000 as
.
::查找最适合您的计算器的方程式。 设置 2000 为 x=0 。
Total Number of Home Runs Hit in Major League Baseball, 2000-2010 .
::2000-2010年主要联盟棒球击败家庭跑总次数。2000 2001 2002 2003 2004 2005 2006 2007 2008 2009 2010 5693 5458 5059 5207 5451 5017 5386 4957 4878 4655 4613 -
Predict the total number of home runs hit in 2015. Compare this to the answer from the
problem above
on
home run data.
::预计2015年全垒打的全垒打总数将达到2015年,相比之下,在全垒打数据中,答案来自上述问题。
3. The table below shows the temperature for various elevations, taken at the same time of day in roughly the same location.
::3. 下表显示在大致同一地点的每天同时拍摄的各种高地的温度。-
Using your calculator, find the equation of best fit.
::用你的计算器 找到最合适的方程式
Elevation, ft . 0 1000 5000 10,000 15,000 20,000 30,000 Temperature , 60 56 41 27 9 -8 -40 -
What would be the estimated temperature at 50,000 feet?
::5万英尺的估计温度是多少?
4. The table below shows the average life expectancy (in years) of the average male in relation to the year they were born. Source: National Center for Health Statistics
::4. 下表显示了男性与出生年份相比的平均预期寿命(年数),资料来源:国家卫生统计中心。-
Using your calculator, find the equation of best fit. Set 1930 as
.
::使用您的计算器, 找到最适合的方程式 。 设定 1930 的 x= 30 。
Year of birth 1930 1940 1950 1960 1970 1980 1990 2000 2007 Life expectancy, Males 58.1 60.8 65.6 66.6 67.1 70 71.8 74.3 75.4 -
What would you predict the life expectancy of a male born in 2012 to be?
::你会预测2012年出生的男性的预期寿命是多少?
5. The table below shows the average life expectancy (in years) of the average female in relation to the year they were born. Source: National Center for Health Statistics
::5. 下表显示了与出生年份相比,平均女性的平均预期寿命(年数),资料来源:国家卫生统计中心。-
Using your calculator, find the equation of best fit. Set 1930 as
.
::使用您的计算器, 找到最适合的方程式 。 设定 1930 的 x= 30 。
Year of birth 1930 1940 1950 1960 1970 1980 1990 2000 2007 Life expectancy, Males 61.6 65.2 71.1 73.1 74.7 77.4 78.8 79.7 80.4 -
What would you predict the life expectancy of a male born in 2012 to be?
::你会预测2012年出生的男性的预期寿命是多少?
6. Science Connection: Why do you think the life expectancy for both men and women has increased over the last 70 years?
::6. 科学联系:你为什么认为过去70年来男女的预期寿命都增加了?Review (Answers)
::回顾(答复)Click to see the answer key or go to the Table of Contents and click on the Answer Key under the 'Other Versions' option.
::单击可查看答题键, 或转到目录中, 单击“ 其他版本” 选项下的答题键 。 -
Find the equation of best fit with your calculator. Set Oct. 2009 as
.