5.18 建模具有赤道功能
章节大纲
-
On reduced-gravity flights, airplanes fly in large parabolic arcs. Determine the quadratic equation of best fit for the data set below that represents the arc in which the airplane flies.
::在减少重力的飞行中,飞机以大型抛物弧飞行。确定最适合以下数据组的二次方程,即飞机飞行的弧。(Time in Sec.) 0 20 33 45 (Altitude in 1000 feet) 24 29 33 29 Source: NASA ( )
::资料来源:美国航天局(美国航天局)()Modeling with Quadratic Functions
::以二次函数建模When finding the equation of a parabola , you can use any of the three forms. If you are given the vertex and any other point, you only need two points to find the equation. However, if you are not given the vertex you must have at least three points to find the equation of a parabola.
::当找到抛物线的方程时,您可以使用三种形式中的任何一种。如果给定了顶点和其他任何点,您只需要两个点就可以找到这个方程。然而,如果给不到顶点,您必须至少有三个点才能找到抛物线的方程。Let's find the equation of the parabola with vertex (-1, -4) and that passes through (2, 8).
::让我们找到抛物线的等式 与顶部(-1, 4) 和通过(2, 8) 的等式。Use vertex form and substitute -1 for and -4 for .
::使用顶部表单并替换 - 1 表示h 和 - 4 表示k 。
::y=a(x- (- 1)) 2 - 4y=a( x+1) 2- 4Now, take the second point and plug it for and and solve for .
::现在,拿第二个点,插上它的x和y,然后解答一个。
::8=a(2+4)2--412=36a13=aThe equation is .
::方程式是 Y=13(x+1)2-4。We can fit a set of data to a quadratic equation. In this concept, we will be using quadratic regression and a TI-83/84.
::我们可以将一组数据适合四等式。 在这个概念中,我们将使用四等式回归和TI-83/84。Now, let's determine the quadratic equation of best fit for the data set below.
::现在,让我们来决定 最适合以下数据组的二次方程。0 4 7 12 17 7 9 10 8 3 We need to enter the coordinates as a list of data and the coordinates as another list.
::我们需要将x-坐标作为数据列表输入,将y-坐标作为另一个列表输入。Step 1: Press STAT.
::第1步:新闻STAT。Step 2: In EDIT, select 1:Edit…. Press ENTER.
::步骤2:在EDIT中,选择1:编辑.按ENTER键。Step 3: The List table appears. If there are any current lists, you will need to clear them. To do this, arrow up to L1 so that it is highlighted (black). Press CLEAR, then ENTER. Repeat with L2, if necessary.
::第3步:列表表格出现。如果有任何当前列表,您需要清除这些列表。要清除这些列表,请向L1箭头向上箭头,以便突出显示(黑色) 。按 CLEAR, 然后是 ENTER。如果需要,请重复 L2 。Step 4: Now, enter the data into the lists. Enter all the entries into L1 first and press enter between each entry. Then, repeat with L2 and .
::第4步:现在,将数据输入列表中。首先输入所有条目到 L1 (x) 中,然后按每个条目之间的键输入。然后,与 L2 和 y 重复。Step 5: Press MODE (QUIT).
::步骤5:新闻第2版MODE(QUIT)。Now that we have everything in the lists, we can use quadratic regression to determine the equation of best fit.
::现在我们有所有的东西, 我们可以使用二次回归 来决定最合适的方程。Step 6: Press STAT and then arrow over to the CALC menu.
::第6步:按STAT键,然后向CALC菜单箭头箭头。Step 7: Select 5:QuadReg. Press ENTER.
::步骤7: 选择 5 : QuadReg. 按 ENTER 键 。Step 8: You will be taken back to the main screen. Type (L1,L2) and press ENTER. L1 is 1, L2 is 2.
::步骤 8: 您将被带回主屏幕 。 类型 (L1, L2) 并按 ENTER 键。 L1 是 2 1, L2 是 2 2 。Step 9: The following screen appears. The equation of best fit is .
::步骤 9: 显示以下屏幕。 最合适的方程式是 y0. 64x2+0. 86x+6. 90。This technique can be applied to real-life problems, and you can also use it to find the equation of any parabola, given three points.
::这种技术可以适用于实际生活问题,你也可以使用它来找到任何抛物线的方程式,给三点。Let's find the equation of the parabola that passes through (1, 11), (2, 20), (-3, 75).
::让我们找到通过(1、11、2、20、(3、75)的抛物线的方程。You can use the same steps from above to find the equation of the parabola. Doing this, you should get the equation is .
::您可以从上面使用相同的步骤来找到抛物线的方程。 这样做时, 您应该得到的方程是 y=5x2- 6x+12 。This problem can also be done by solving three equations, with three unknowns. If we plug in to , we would get:
::这个问题也可以通过解决三个方程式( 三个未知方程式) 来解决。 如果我们插入 y = ax2+bx+c 的 y (x,y) 到 y = ax2+bx+c, 我们会得到 :
::11=a+b+c20=4a+2b+c75=9a-3b+cUse linear combinations to solve this system of equations . This problem will be finished in the Review section (#13).
::使用线性组合来解决这个方程式系统。 这个问题将在审评部分( #13) 中完成 。Examples
::实例Example 1
::例1Earlier, you were asked to determine the quadratic equation of best fit for the data given.
::早些时候,你被要求确定最适合所提供数据的二次方程。Use your calculator to find the quadratic equation of best fit for the given table.
::使用您的计算器找到最适合给定表格的二次方程 。(Time in Sec.) 0 20 33 45 (Altitude in 1000 feet) 24 29 33 29 is the quadratic equation of best fit for the data.
::y0.0081x2+0.495x+23.6987是最适合数据的二次方程。Example 2
::例2Find the equation of the parabola with intercepts (4, 0) and (-5, 0) that passes through (-3, 8).
::找到通过 x- inter 的( 3, 8) 和 ( 5, 0) x- inter 的 parbola 方程式 。Because we are given the intercepts, use intercept form to find the equation.
::因为我们得到了拦截 使用拦截形式来找到方程式
::y=a(x-4)(x+5)Plug in (-3,8) and solve for
::插插( 3, 8) , 并解决
::8=a(-3-4)(-3+5)814a-47=a)The equation of the parabola is .
::抛物线的方程式是y47(x-4)(x+5)。Example 3
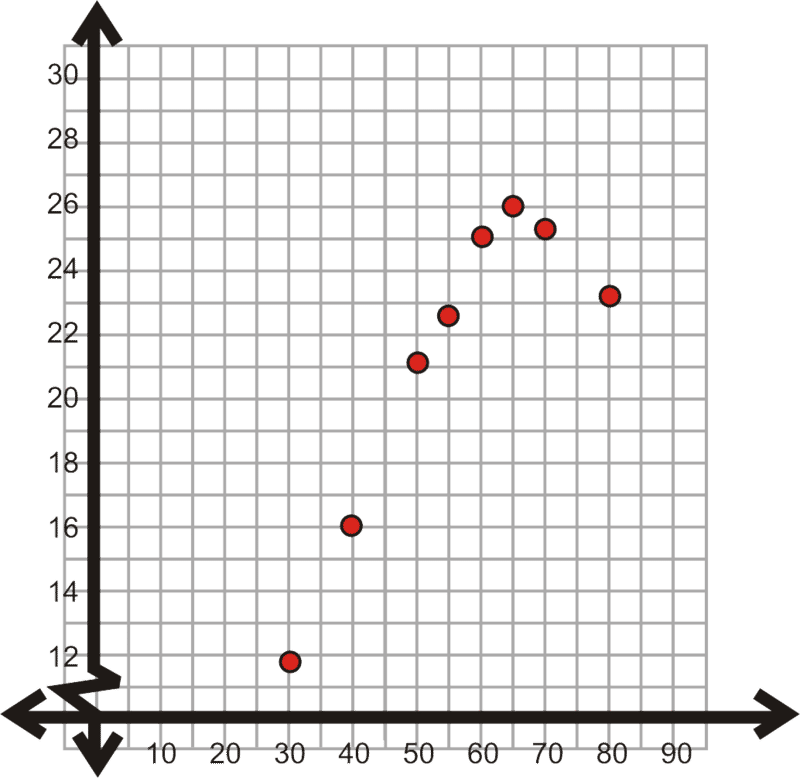
::例3A study compared the speed , (in miles per hour), and the average fuel economy, (in miles per gallon) of a sports car. Here are the results.
::一项研究比较了运动车的速度,x(每小时以英里计)和平均燃料经济,y(每加仑以英里计),结果如下。speed 30 40 50 55 60 65 70 80 fuel economy 11.9 16.1 21.1 22.2 25.0 26.1 25.5 23.2 Plot the scatterplot and use your calculator to find the equation of best fit.
::绘制散射图, 并使用您的计算器找到最适合的方程式 。Plotting the points, we have:
::绘制点数时,我们有:Using the steps from above, the quadratic regression equation is .
::使用上面的阶梯,二次回归方程为 y0.09x2+1.24x-18.23。Review
::回顾Find the equation of the parabola given the following points. No decimal answers.
::根据以下各点查找抛物线的方程。没有小数点回答。-
vertex: (-1, 1) point: (1, -7)
::顶点: (-1, 1) 点:1, 7) -
intercepts: -2, 2 point: (4, 3)
::x- 拦截: - 2, 2点: (4, 3) -
vertex: (9, -4) point: (5, 12)
::顶点: (9, 4) 点: (5, 12) -
intercepts: 8, -5 point: (3, 20)
::x 拦截: 8 - 5 点3, 20)
-
intercepts: -9, -7 point: (-3, 36)
::x- 拦截: - 9, - 7 点 -
vertex: (6, 10) point: (2, -38)
::顶点: (6, 10) 点: (2, - 38) -
vertex: (-4, -15) point: (-10, 1)
::顶点 -
vertex: (0, 2) point: (-4, -12)
::顶点: (0, 2) 点 -
intercepts: 3, 16 point: (7, 24)
::x 拦截: 3, 16点: (7, 24)
Use a graphing calculator to find the quadratic equation (in standard form) that passes through the given three points. No decimal answers.
::使用图形计算器查找通过给定三点的二次方程( 标准形式) 。 没有小数点回答 。- (-4, -51), (-1, -18), (4, -43)
- (-5, 131), (-1, -5), (3, 51)
- (-2, 9), (2, 13), (6, 41)
-
Challenge
Finish computing the equation of the parabola that passes through (1, 11), (2, 20), (-3, 75) using linear combinations.
::完成对使用线性组合通过(1、11、2、20)、(3、75)的抛物线体方程的计算挑战。
For the quadratic modeling questions below, use a graphing calculator. Round any decimal answers to the nearest hundredth.
::对于下面的二次模型问题, 请使用图形计算器。 将小数点后的任何答案四舍五入到最接近的百位 。-
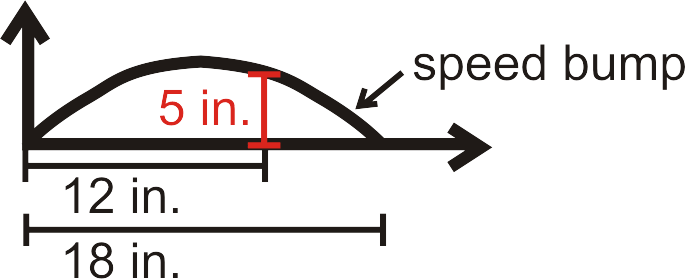
The surface of a speed bump is shaped like a parabola. Write a quadratic model for the surface of the speed bump shown.
::速度峰值的表面形状像抛物线。 为显示速度峰值的表面写一个二次模型 。 -
Physics and Photography Connection
Your physics teacher gives you a project to analyze parabolic motion. You know that when a person throws a football, the path is a parabola. Using your camera, you take an long exposure picture of a friend throwing a football. A sketch of the picture is below.
You put the path of the football over a grid, with the axis as the horizontal distance and the axis as the height, both in 3 feet increments. The release point, or shoulder height, of your friend is 5 ft, 3 in and you estimate that the maximum height is 23 feet. Find the equation of the parabola.
::物理和摄影联系 你物理老师给了你一个分析抛物线运动的项目。 你知道, 当一个人扔足球时, 路径是抛物线。 使用你的相机, 您可以拍摄一个朋友扔足球的长照。 图片的草图在下面。 您将足球的路径放在一个网格上, 以x- 轴作为水平距离, y- 轴作为高度, 以三英尺增量。 你的朋友的释放点或肩高是 5英尺, 3英尺, 你估计最高高度是 23英尺。 找到 parbola 的方程 。 -
An independent study was done linking advertising to the purchase of an object. 400 households were used in the survey and the commercial exposure was over a one week period. See the data set below.
::进行了一项独立研究,将广告与购买物品联系起来。 调查中使用了400户家庭,商业接触时间超过一周。
# of times commercial was shown, 1 7 14 21 28 35 42 49 # of households bought item, 2 25 96 138 88 37 8 6 a) Find the quadratic equation of best fit.
:b) Why do you think the amount of homes that purchased the item went down after more exposure to the commercial?
:Review (Answers)
::回顾(答复)Click to see the answer key or go to the Table of Contents and click on the Answer Key under the 'Other Versions' option.
::单击可查看答题键, 或转到目录中, 单击“ 其他版本” 选项下的答题键 。 -
vertex: (-1, 1) point: (1, -7)