2.2 赤道函数图
Section outline
-
In prior lessons, we have discussed the standard form of a quadratic function : . You may have seen other forms, such as the vertex form, or the factored form . Why are there so many common ways to write the same equations? Why should we learn all these different forms if the standard form is the most common anyway?
::在以往的教训中,我们已经讨论了二次函数的标准形式:f(x)=ax2+bx+c。 您可能已经看到过其它形式, 如顶点形式, 或因子形式 。 为什么有这么多共同的方法来写同样的方程式? 如果标准形式是最常见的形式, 为什么我们要学习所有这些不同的形式呢 ?Graphing Quadratic Functions
::刻度函数Quadratic Functions
::二次曲线函数A function defined by , where and are real numbers and , is called a quadratic function .
::F(x) = ax2+bx+c 定义的函数 f,其中 a、b 和 c 是真实数字, a = 0. 0 被称为二次函数。The defining characteristic of a quadratic function is that it is a polynomial whose highest exponent is 2.
::二次函数的决定性特征是它是一个多元体,其最高出处是2。There are several ways to write quadratic functions:
::有几种方法可以写出二次函数:-
standard form
, the form of the quadratic function above:
::标准窗体,上面的二次函数的形式:f(x)=ax2+bx+c -
vertex form
, commonly used for quick sketching:
::用于快速绘图的顶部窗体: f(x)=a(x-h)2+k -
factored form
, excellent for finding
x
-
intercepts
:
::用于查找 x 界面的极优 : f(x) = a(x-r1)(x-r2)
The intercept of a quadratic function in standard form is and it is found by substituting for in .
::y- 连接标准格式的二次函数是 (0,c) , 代之以 f(x) = ax2+bx+c 中的 x。Summary of Vertex Form
::静脉式表摘要Given a quadratic function in vertex form : :
::给定顶点形式的二次函数 : f( x) =a( x-h) 2+k :-
The vertex is at
::顶点在(h,k) -
The
parabola
opens up if
::如果 a>0 , 抛物线打开 -
The parabola opens down if
::如果 <0 , 抛物线会向下打开 -
The parabola is narrower than
if
::抛物线小于 y=x2, 如果 a1 -
The parabola opens wider than
if
::抛物线打开宽于 y=x2, 如果 {a}} 则宽于 y=x2 。
Vertex of a Parabola
::帕拉波拉的顶点In the standard form of a quadratic function, the coordinate of the vertex of the parabola is given by the equation :
::在二次函数的标准形式中,抛物线顶部的X-坐标由方程式给定:
::xb2a xb2aThe coordinate of the vertex is found with:
::顶端的 y - 坐标为 :
::y=f(-b2a)Axis of Symmetry of a Parabola
::帕拉波拉对称性轴的轴心A parabola has reflective about a vertical line through the vertex.
::抛物线反射到垂直线穿过顶端。The vertical line is also the parabola's axis of symmetry .
::垂直线 xb2a 也是抛物线的对称轴。Examples
::实例Example 1
::例1Graph using transformations .
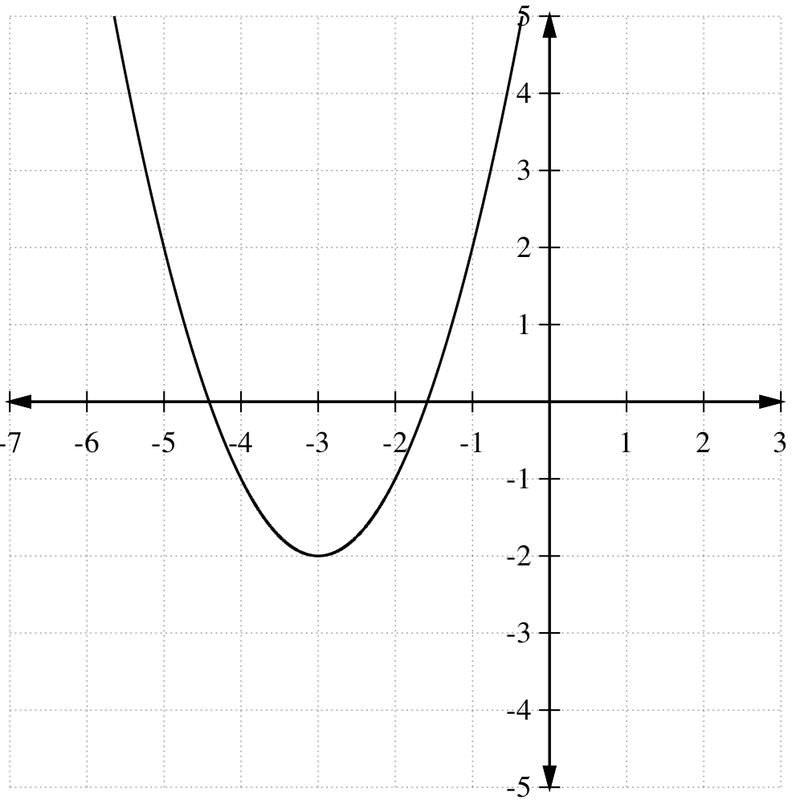
::图g(x)=x2+6x+7 使用变换。First, complete the square to write this function in vertex form. Add and subtract to the right hand side of the equation:
::首先,完成方形以顶点形式写入此函数。在方程式右侧添加并减去(b2)2:
::g(x) =x2+6x+7=x2+6x+9+7-9Now, factor the right hand side:
::现在,考虑右手边:
::g(x) = (x+3) 2-2Thus, and the vertex of this parabola is (-3, -2). We know that the parabola opens up with the same width as and it has a minimum value at the vertex. The graph of the parabola is below.
::因此,a=1和这个抛物线的顶点是(3 - 2), 我们知道抛物线打开时的宽度与y=x2相同, 顶点的最小值也相同。 抛物线的图如下。Example 2
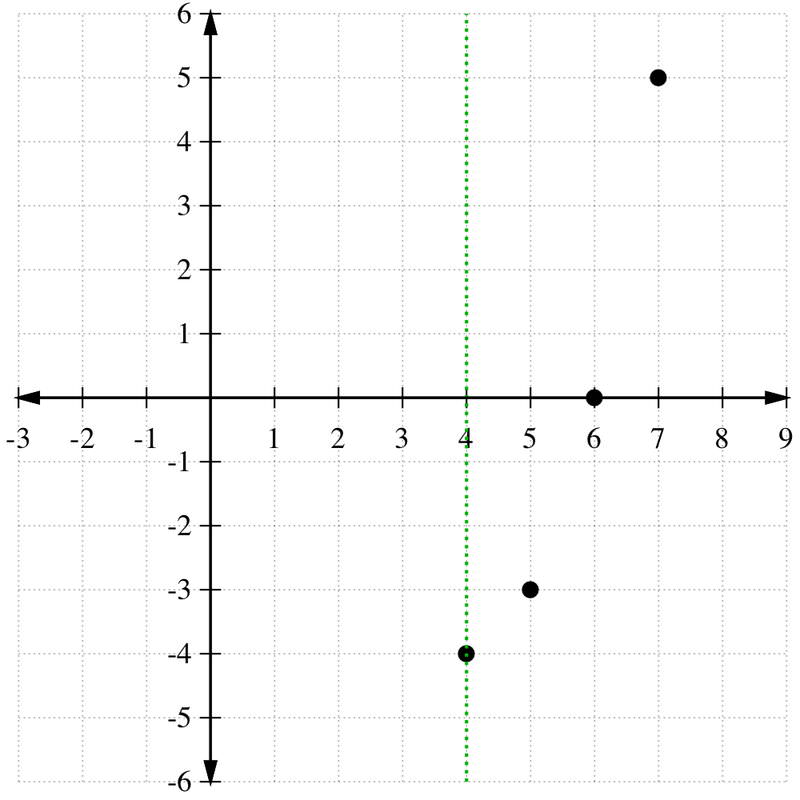
::例2Find the vertex and graph the quadratic function .
::查找顶点并绘制二次函数g( x) =x2- 8x+12的图形。The coordinate of the vertex is .
::顶端的 x - 坐标是 x\\ 82= 4 。The coordinate of the vertex is
::顶端的 Y - 坐标是 g(4) = (4)2 - 8(4)+12= 16 - 32+124Thus the vertex is at (4, -4).
::因此,顶部为(4,4) - 4。To graph the parabola, we will make a table of points staring with the coordinate of 4:
::为了绘制抛物线图,我们将绘制一个点表,用X座标4:4 -4 5 -3 6 0 7 5 Now we can use the symmetry of to fill in this table for . Note that . Likewise, . The final graph is below.
::现在,我们可以使用 g( x) 的对称来填充 g(3) 。 注意 g(3) =g(5) \\\\\\\ 3. 类似, g(2) =g(6) =0。 最后的图表在下面 。Example 3
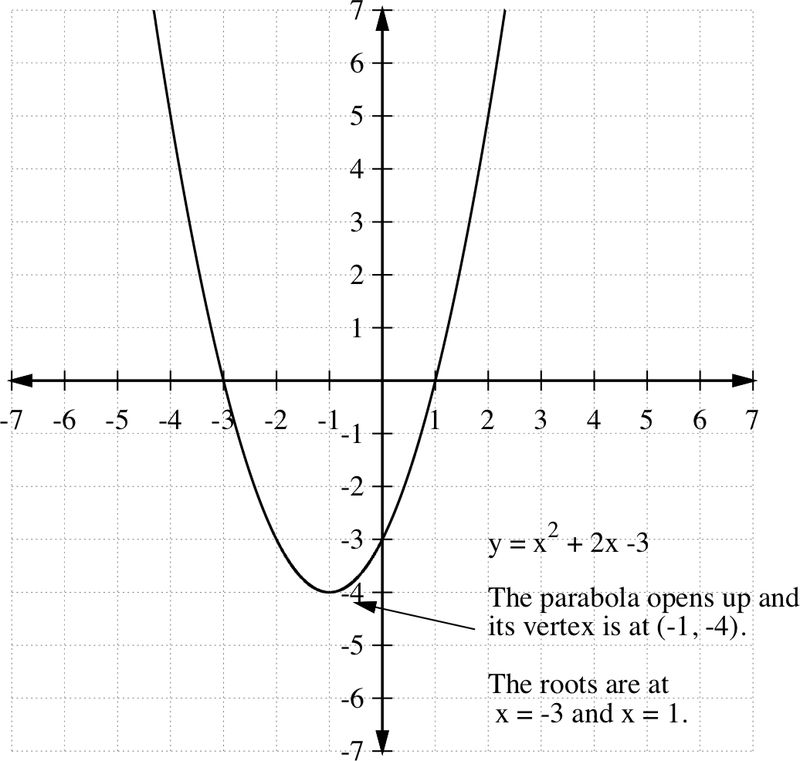
::例3Sketch the graph of the function .
::绘制函数 y=f(x) =x2+2x-3 的图形 。Let's first find the intercepts. For the intercept, if , then , or , so the intercept point is (0, -3).
::首先让我们找到拦截。 对于 y - 拦截, 如果 x=0, 那么 f( 0)\\\ 3 或 y 3, y - 拦截点是 0, - 3 。Now, for the intercepts, if , then , or
::现在,对于 x - 截取, 如果y=f( x)=0, 那么 x2+2x-3=0, 则 x2+2x-3=0, 或
::x2+2x-3=(x+3)(x-1)=0so that and are the intercepts, that is (-3, 0) and (1, 0).
::x% 3 和 x=1 是 x - 界面, 即 (3, 0) 和 1, 0 。The vertex (extreme point) is at
::顶点( 极端点) 值
::#############################################################################################################1#######1#############################1####################################1#####################################################################################################################################################################################################################################################################################################################################Since
::自
::f(-1)=(-1)2+2(-2-1)-34The vertex is (-1, -4).
::顶点是 (-1, - 4) 。Since the coefficient of is positive, , the extreme point is a minimum and the parabola opens up. From this information, we can make a rough sketch of the parabola containing the points determined above. Notice that the range of the function is .
::由于 x2 系数为正数, a>0, 极端点为最小值, 抛物线会打开。 在此信息中, 我们可以对抛物线进行粗略的草图, 包括上面确定的点 。 注意此函数的范围是 y 4 。Example 4
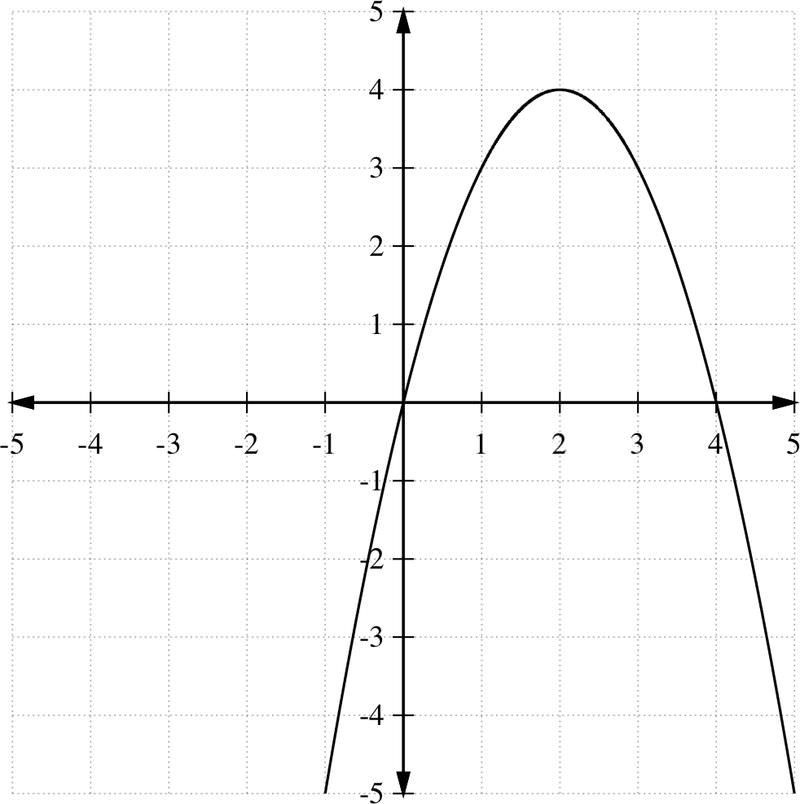
::例4Sketch the graph of the quadratic function .
::绘制二次函数 f( x) x2+4x 的图形 。To find the intercept, set , and
::要找到 y- interception, 设置 x=0 和 f( 0)\\\\\\\\\\\\\\\\\\\\\\\\\\\\\\\\\\\\\\\\\\\\\\\\\\\\\\\\\\\\\\\\\\\\\\\\\\\\\\\\\\\\\\\\\\\\\\\\\\\\\\\\\\\\\\\\\\\\\\\\\\\\\\\\\\\\\\\\\\\\\\\\\\\\\\\\\\\\\\\\\\\\\\\\\\\\\\\\\\\\\\\\\\\\\\\\\\\\\\\\\\\\\\\\\\\\\\\\\\\\\\\\\\\\\\\\\\\\\\\\\\\\\\\\\\\\\\\\\\\\\\\\\\\\\\\\\\\\\\\\\\\\\\\\\\\\\\\\\\\\\\\\\\\\\\\\\\\\\\\\\\\\\\\\\\\\\\\\\\\\\\\\\\\\\\\\\\\\\\\\\\\\\\\\\\\\\\\\\\\\\\\\\\\\\\\\\\\\\\\\\\\\\\\\\\\\\\\\\\\\\\\\\\\\\\\\\\\\\\\\\\\\\\\\\\\\\\\\\\\\\\\\\\\\\\\\\\\\\\\\\\\\\\\\Thus the parabola intercepts the axis at the origin.
::因此,抛物线在原地拦截y-轴。The intercept is obtained by setting . Thus, .
::x- 拦截是通过设置 y=0 获得的。 因此, ~ x2+4x=0 。Factoring,
so that and are the intercepts.
::乘数,-x2+4xx(x-4)=0,因此 x=0和 x=4 是 x- 界面 。We have and , so that the extreme point occurs when
Since , then (2, 4) is the extreme point. It is a maximum point since and the parabola opens down. Finally, the graph can be obtained by sketching a parabola through the points determined above. From graph, the range of the function is .
::我们有一个% 1 和 b= 4, 这样最极端的点会发生在以下时间 : xb2a42 (-1) =2Since f(2) 2+4(2) 4+8=4, 然后是极点 (2, 4) 。 这是自 1 < 0 和 parobola 打开以来的最大点 。 最后, 可以通过绘制上面确定的点的抛物线图来获取 。 从图表中, 函数的范围是 y 4 。Example 5
::例5Sketch the graph of .
::绘制 y3(x-2)2+1 的图形 。The equation is already in vertex form, so graphing is relatively easy:
::y%3( x-2) 2+1 等式已经处于顶点形式, 所以图形化比较容易:Recall the when the equation is written in vertex form like this, the vertex is the point (h,k):
::当方程式以像这样的顶点形式写出时, 顶点是( h, k) :vertex form:
::顶点窗体: y=a(x-h)2+kOur equation:
::我们的方程式: y3(x-2)2+1Examining our equation, we can see the vertex of the parabola is at (2, 1).
::研究我们的方程,我们可以看到 抛物线的顶端是(2,1)To find another point on the parabola solve for an x value.
::找到一个 x 值的抛物线解答的另一点 。Since the vertex is at x = 2, let's try one unit to the right: x = 3.
::由于顶点在 x = 2, 让我们试一下右边的一个单位: x = 3。There is a point on the parabola at (3, -2)
::抛物线上有一个点 (3, 2)Since a parabola has an axis of symmetry that passes through its vertex, we can reflect the point (3, -2) across the axis of symmetry to get another point, (1, -2) also on the parabola.
::由于抛物线有一个对称轴,穿过它的顶部,我们可以反射对称轴(3,2),横跨对称轴,在抛物线上再找到一个点(1,2))。The graph of is shown below, using vertex (2, 1) and points (3, -2) and (1, -2).
::y%3(x-2)2+1图如下所示,使用顶点(2、1)和点(3、2)和点(1、2)。Review
::回顾-
What is the U-Shaped graph of a quadratic function called?
::二次函数的 U shaped 图形叫什么 ? -
Which direction does a parabola open if the leading coefficient (
a
) is positive?
::如果主要系数(a)为正数,抛物线会打开哪个方向? -
For
If the coefficient of
y
is positive, which way does the parabola open?
::对于 y2=x, 如果 y 系数为正数, 抛物线以哪一种方式打开 ? -
What is the name of the lowest point of a parabola that opens up and the highest point of a parabola that opens down.
::开启的抛物线最低点和开启的抛物线最高点的名称是什么。 -
What is the name of the line passing through the vertex that divides the parabola into two symmetric parts?
::穿过将抛物线分为两个对称部分的顶端的线条的名称是什么? -
Sketch the graph of
::绘制 y=x2+3 的图形 -
Sketch the graph of
::绘制 yx2+4x-4 的图形 -
Sketch the graph of
::绘制 y= 2x2+8x 的图形 -
Consider the following quadratic function:
a) Which direction does it open? b) What is the vertex? c) Is it stretched in any way?
::考虑以下二次函数 : yx2-2x+1 a) 它打开哪个方向? b) 顶点是什么? c) 它是否被拉伸过? -
Consider the quadratic functions:
Which quadratic function would you expect to have the narrowest parabola? Explain your answer.
::考虑二次函数 : y= 2x2y= 4x2y= 6x2 您期望哪种二次函数具有最窄的抛物线? 请解释您的回答 。
Sketch the graph of each function:
::绘制每个函数的图形 :-
::yx2 -
::y=3x2+6x+1 -
::y=12x2+2x+4 -
::y=(x-3)2+4 -
::yx2 - 8x - 17
The quadratic function can be used to represent the path of a football kicked 30 yards down the field. The variable x represents the distance, in yards, the ball has traveled down the field. The height, in yards, of the football in the air is represented by the variable
.
::二次函数 y 0.05x2+1.5x 可以用来代表足球在球场下30码处踢球的路径。 变量 x 代表球在球场上的距离。 球在球场上的高度由变量( y) 表示。Use the quadratic function to calculate the height of the ball as it travels down the field. Round your answers to the nearest hundredth of a yard.
::使用二次曲线函数来计算球在田间行走时的高度。 将您的答案绕到最接近的百分百的院子 。-
What is the maximum height of the football during the kick?
::足球踢球时最高身高是多少? -
How far down the field has the football traveled when it reaches its maximum height?
::足球到达最高高度时 球场下方的足迹有多远? -
Use the information in the table to graph the path of the football kick.
::使用表格中的信息来绘制足球踢的路径图。 -
If you were shown only the graph of this quadratic function, how could you determine the maximum height of the football during the kick and how far down the field the football has traveled when it reaches its maximum height?
::如果只显示您这个二次函数的图形, 您如何确定足球在踢球时的最高高度, 以及足球到达最高高度时所走过的路程 ?
Review (Answers)
::回顾(答复)Click to see the answer key or go to the Table of Contents and click on the Answer Key under the 'Other Versions' option.
::单击可查看答题键, 或转到目录中, 单击“ 其他版本” 选项下的答题键 。 -
standard form
, the form of the quadratic function above: