3.4 指数函数图
章节大纲
-
Suppose you were listening to the radio, and heard the DJ announce a call-in giveaway.
::假设你在听收音机 听到DJ宣布放弃通话"The 343rd caller RIGHT NOW will win $15,000!"
::"现在的第343个呼叫者将赢得15,000美元!"You grab your cell phone and call in right away: "Hi, this is me... did I win?"
::你抓住你的手机 立刻打电话说:"嗨,这是我... 我赢了吗?""Congratulations! You are today's big winner on WGAM radio!"
::"恭喜你们,你们是今天在WGAM电台的 最大获奖者!""Umm... Really?"
::"嗯,真的吗?""Just one question for you: 'We Give Away Money' radio listeners want to know, what are you going to do with the money?"
::"只问你一个问题: "我们给了钱"收音机听众想知道 你拿钱要做什么?"What would you do? Spend it? Invest it?
::你会怎么做 花掉它 投资它If you could get a 5% interest rate , and saved it for your 50th birthday, would it really be all that much, even if you left it there for 30 years or so?
::如果你能得到5%的利率, 并保存它给你的50岁生日, 它真的这么多, 即使你离开那里30年左右?Graphing Exponential Functions
::图形指数函数Exponential function graphs are often more useful than specific solutions of . Because exponential functions are commonly used to model things like population growth, stock behavior, and temperature changes, it may well only be necessary to get a good general idea of the behavior of the function . In fact, in such situations you will find that solving the function for specific values is often only done in order to graph them, and it is the overall behavior that is important.
::指数函数图形往往比具体解决方案更有用。 由于指数函数通常用于模拟人口增长、股票行为和温度变化等现象,因此也许只需要对函数的行为有一个良好的总体了解。 事实上,在这种情况下,你会发现,解决特定值的函数往往只是为了图解它们,而总体行为才是重要的。Let’s consider the graph of f ( x ) = 2 x . The graph below shows this function, with several points marked in blue.
::让我们来考虑f(x) = 2x 的图形。 下图显示此函数, 几个点以蓝色标出 。Notice that as x approaches , the function grows without bound . That is, . However, if x approaches , the function values get closer and closer to 0. That is, . Therefore the function is asymptotic to the x- axis. This is the graphical result of the fact that the range of the function is limited to positive y values.
::请注意, 当 x 接近 \\ \ \ \ \ \ \ \ \ \ \ \ \ \ \ \ \ \ \ \ \ \ \ \ \ \ \ \ \ \ \ \ \ \ \ \ \ \ \ \ \ \ \ \ \ \ \ \ \ \ \ \ \ \ \ \ \ \ \ \ \ \ \ \ \ \ \ \ \ \ \ \ \ \ \ \ \ \ \ \ \ \ \ \ \ \ \ \ \ \ \ \ \ \ \ \ \ \ \ \ \ \ \ \ \ \ \ \ \ \ \ \ \ \ \ \ \ \ \ \ \ \ \ \ \ \ \ \ \ \ \ \ \ \ \ \ \ \ \ \ \ \ \ \ \ \ \ \ \ \ \ \ \ \ \ \ \ \ \ \ \ \ \ \ \ \ \ \ \ \ \ \ \ \ \ \ \ \ \ \ \ \ \ \ \ \ \ \ \ \ \ \ \ \ \ \ \ \ \ \ \ \ \ \ \ \ \ \ \ \ \ \ \ \ \ \ \ \ \ \ \ \ \ \ \ \ \ \ \ \ \ \ \ \ \ \ \ \ \ \ \ \ \ \ \ \ \ \ \ \ \Graphing Exponential Functions Using Transformations
::使用变形绘制指数函数图From your prior studies of function transformations , you should recognize the graph of g ( x ) = 2 x + 3 as a vertical shift of the graph of f ( x ) = 2 x . In general, we can produce a graph of an exponential function with base 2 if we analyze the equation of the function in terms of transformations. The table below summarizes the different kinds of transformations of f ( x ) = 2 x .
::从您先前的函数变换研究中, 您应该将 g( x) = 2x + 3 的图形识别为 f( x) = 2x 的图形的垂直转换。 一般而言, 如果我们分析函数变换的方程式, 我们就可以用基数 2 生成指数函数的图形。 下面的表格概述了 f( x) = 2x 的不同变换类型 。Equation Relationship to f ( x )=2 x Range Obtain a graph of g by shifting the graph of f a units to the right. y > 0 Obtain a graph of g by shifting the graph of f a units to the left. y > 0 Obtain a graph of g by shifting the graph of f up a units. y > a Obtain a graph of g by shifting the graph of f down a units. y > a Obtain a graph of g by vertically stretching the graph of f by a factor of a . y > 0 Obtain a graph of g by horizontally compressing the graph of f by a factor of a . y > 0 Obtain a graph of g by reflecting the graph of f over the x- axis. y > 0 Obtain a graph of g by reflecting the graph of f over the y- axis. y > 0 Examples
::实例Example 1
::例1Earlier, you were given a question about investing your prize money.
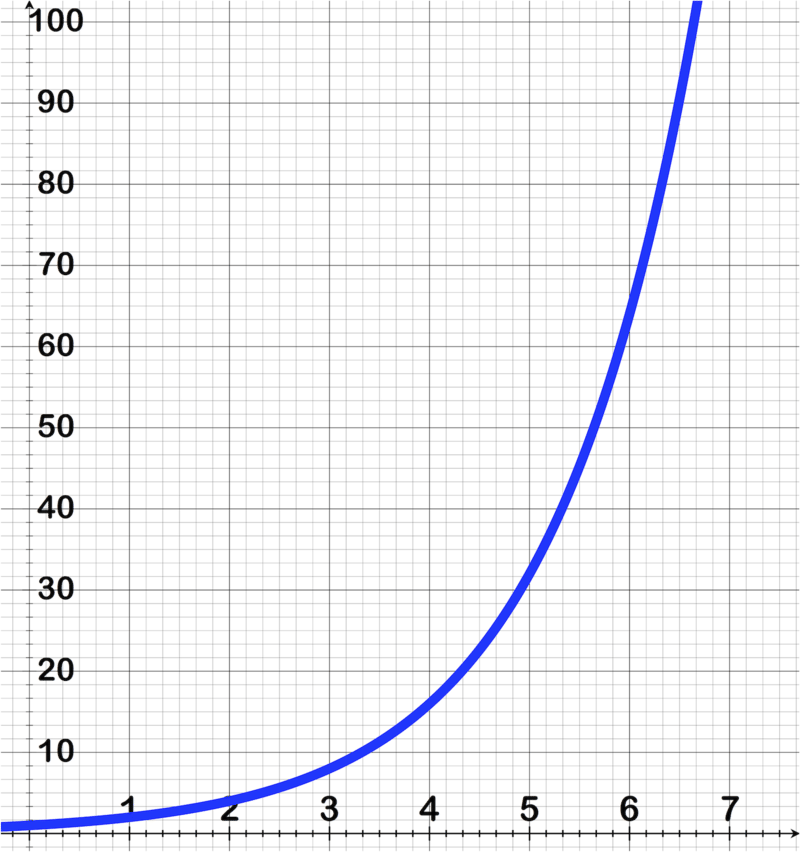
::早些时候,有人问你 投资奖金的问题Is a 5% return on a $15,000 investment really worth all that much over 30 years?
::5美分的回报率是15000美元投资的 真正价值超过30年吗?You bet it is! Look at the graph below:
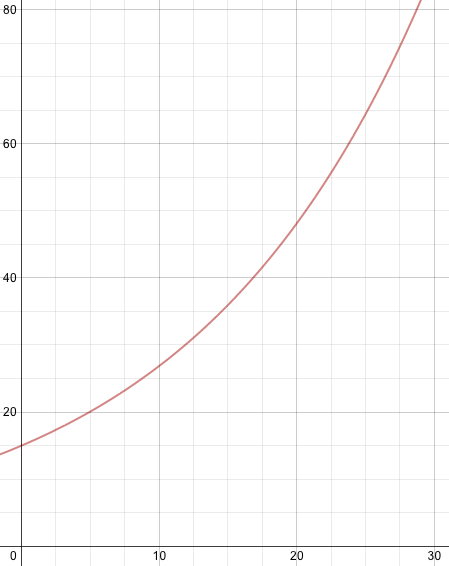
::当然,请看下图:Note that the y axis denotes 'thousands '. After 30 years, the original $15k investment becomes nearly $65,000, not a bad birthday present for yourself!
::注意 y 轴表示“ 千 ” 。 30年后, 最初的 15k 投资 近 $65 000 美元 , 给 自己 不坏 的 生日 礼物 !Example 2
::例2Use a graphing utility to graph f ( x ) = 2 x , g ( x ) = 3 x and h ( x ) = 4 x . How are the graphs the same, and how are they different?
::图形f(x) = 2x, g(x) = 3x 和 h(x) = 4x 使用图形工具。 图形如何相同, 不同?f ( x ) = 2 x , g ( x ) = 3 x and h ( x ) = 4 x are shown together below.
::f(x) = 2x, g(x) = 3x 和 h(x) = 4x 如下所示。The graphs of the three functions have the same overall shape: they have the same end behavior, and they all contain the point (0, 1). The difference lies in their rate of growth. Notice that for positive x values, h ( x ) = 4 x grows the fastest and f ( x ) = 2 x grows the slowest. The function values for h ( x ) = 4 x are highest and the function values for f ( x ) = 2 x are the lowest for any given value of x . For negative x values, the relationship changes: f ( x ) = 2 x has the highest values of the three functions.
::3个函数的图形具有相同的整体形状:它们具有相同的终端行为,它们都包含点(0,1),差别在于它们的增长率。请注意,对于正x值, h(x) = 4x 增长最快,f(x) = 2x 增长最慢。h(x) = 4x 的函数值最高,而f(x) = 2x 的函数值最低,任何给定值为 x。对于负x 值,关系的变化:f(x) = 2x 具有3个函数的最高值。Example 3
::例3Use transformations to graph the function a ( x ) = 3 x + 2 .
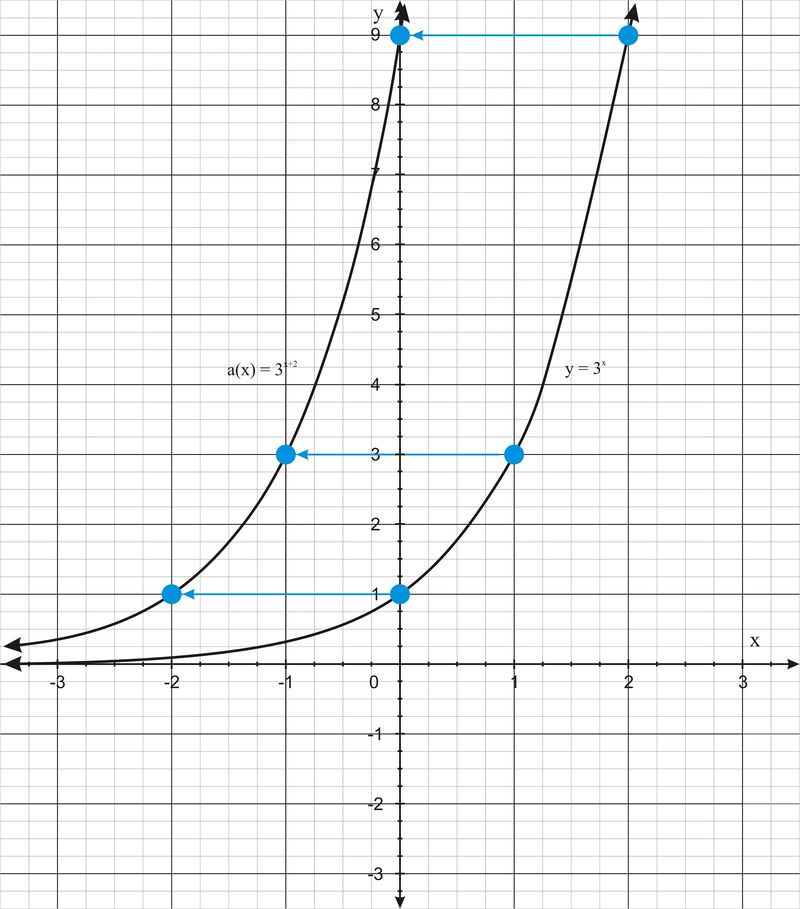
::使用变换来图解函数 a(x) = 3x+ 2。a ( x ) = 3 x + 2
::a(x)=3x+2This graph represents a shift of y = 3 x two units to the left. The graph below shows this relationship between the graphs of these two functions:
::此图表示 Y = 3x 2 单位向左的移动。 下图显示这两个函数的图形之间的关系 :Example 4
::例4Use transformations to graph the function b ( x ) = -3 x + 4.
::使用变换来图形函数 b( x) = - 3x + 4 。b ( x ) = -3 x + 4
::b(xx)=-3x+4This graph represents a reflection over the y- axis and a vertical shift of 4 units. You can produce a graph of b ( x ) using three steps: sketch y = 3 x , reflect the graph over the x- axis, and then shift the graph up 4 units. The graph below shows this process:
::此图代表 Y 轴的反射和 4 个单位的垂直移动。 您可以使用三个步骤生成 b (x) 的图形 : 草图 y = 3x, 在 x 轴上方显示图形, 然后将图形向上移动 4 个单位。 下图显示此进程 :While you can always quickly create a graph using a graphing utility, using transformations will allow you to sketch a graph relatively quickly on your own. If we start with a parent function such as y = 3 x , you can quickly plot several points: (0, 1), (2, 9), (-1, 1/3), etc. Then you can transform the graph, as we did in the previous example.
::虽然您总是可以使用图形工具快速创建图表, 但使用变换将允许您自己比较快地绘制图形。 如果我们以 Y = 3x 等父函数开始, 您可以快速绘制几个点 : (0, 1, 2, 9, (1, 1, 1, 1, 3) 。 这样您就可以像前一个示例一样转换图形 。Notice that when we sketch a graph, we choose x values, and then use the equation to find y values.
::注意当我们绘制图表时, 我们选择 x 值, 然后使用方程式查找 y 值 。Example 5
::例5Sketch the graph of the equation .
::绘制公式 y= (2( 12x+3) 2 - 1 的图形 。Break the parabola equation down piece-by-piece:
::将抛物线方程式逐件拆开:In front of the " data-term="Parentheses" role="term" tabindex="0"> parentheses we have a 2 , so this function is stretched by a factor of 2.
::在括号前,我们有一个 2,所以这个函数被以2的乘数拉开。The co-efficient of the x is horizontal compression , in this case, we'll be stretching by a factor of 2.
::x的共效是水平压缩, 在这种情况下,我们将以2的乘数延伸。The -6 inside the parenthesis is horizontal shift , so this graph moved left 6.
::括号内的 -6 是水平变化, 所以这个图向左移动了 6 。The number outside the parenthesis is vertical shift, so this graph moved down 1.
::括号外的数字是垂直变化,所以这个图向下移动 1。Example 6
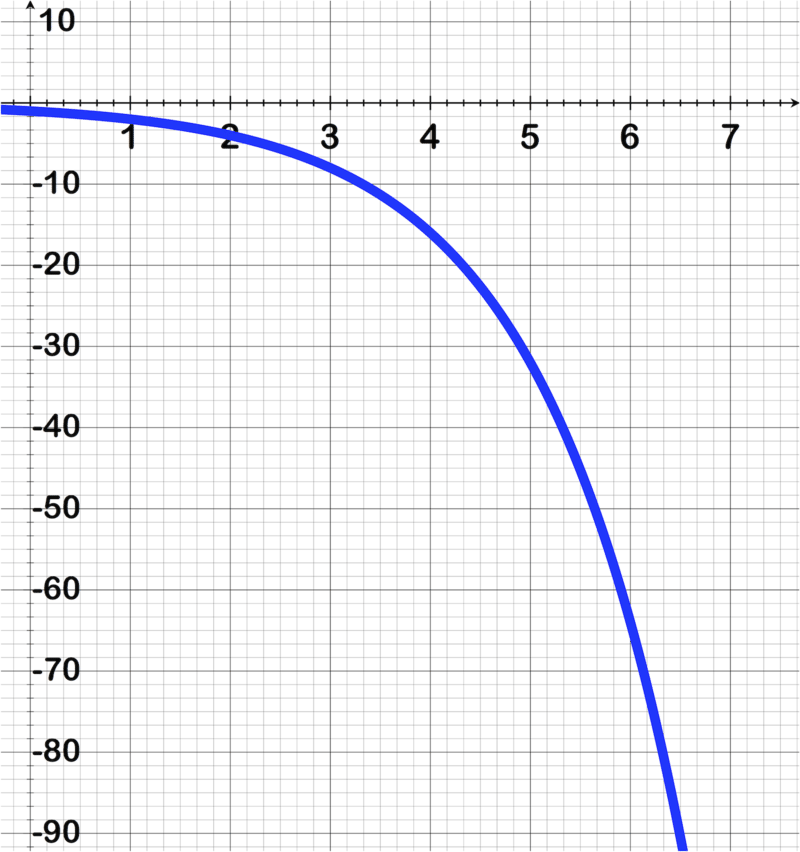
::例6Write an equation for the graph below:
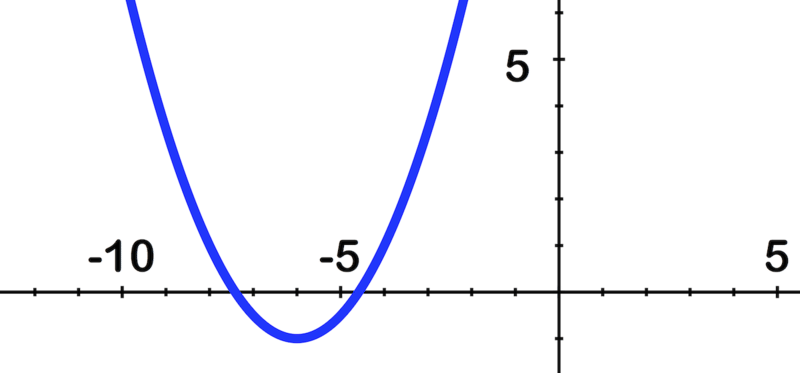
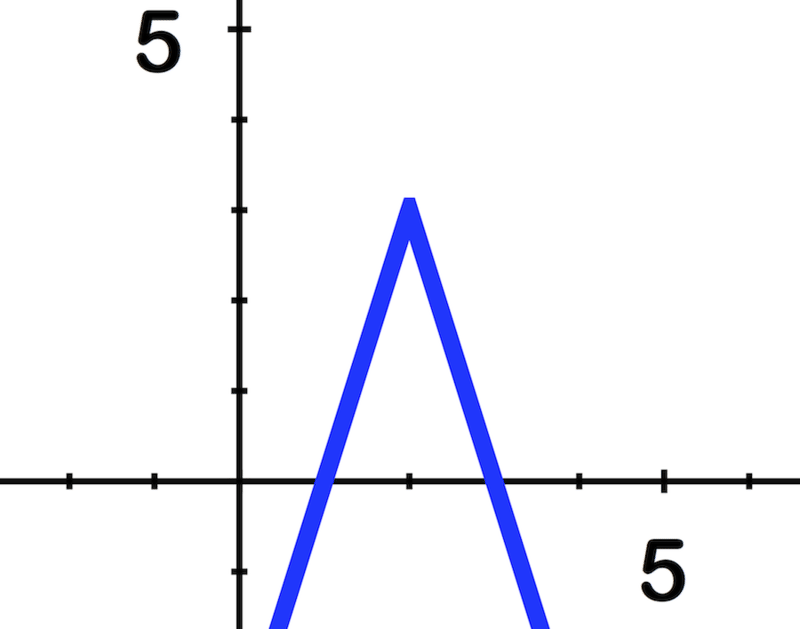
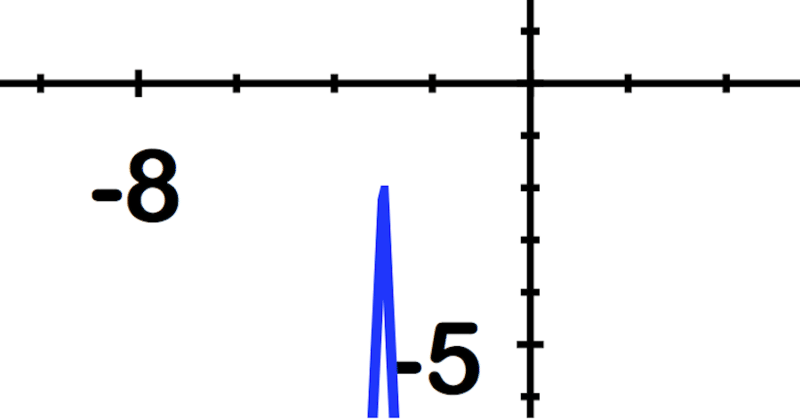
::为下图写一个方程式 :
::~ ~ ~ ~ ~ ~ ~ ~ ~ ~ ~ ~ ~ ~ ~ ~ ~ ~ ~ ~ ~ ~ ~ ~ ~ ~ ~ ~ ~ ~ ~ ~ ~ ~ ~ ~ ~ ~ ~ ~ ~ ~ ~ ~ ~ ~ ~ ~ ~ ~ ~ ~ ~ ~ ~ ~ ~ ~ ~ ~ ~ ~ ~ ~ ~ ~ ~ ~ ~ ~ ~ ~ ~ ~The negative 3 outside of the absolute value means the graph is flipped upside down, and then stretched by a factor of 3.
::绝对值外的负 3 表示图向上翻转,然后拉伸为3 系数。The number inside the absolute value is horizontal shift, so this graph moved right 2.
::绝对值内的数字是水平变化,所以这个图向右移动了2。The number outside the absolute value is vertical shift, so this graph moved up 3.
::绝对值以外的数字是垂直移动,所以这个图向上移动了3。Example 7
::例7Describe the transformation and graph .
::描述转换和图y54(x+3)2。The number in front of the function is negative, so this graph is reflected over the x-axis .
::函数前的数为负,因此此图显示在 X 轴上。The value of the number in front of the function is vertical stretch , so this graph has a vertical stretch of 5.
::函数前面的数字值为垂直伸展,因此此图的垂直伸展为5。The coefficient of the x is negative: the graph is reflected over the y-axis .
::x 的系数为负: 图形在 Y 轴上反射 。The value of the x coefficient, is the horizontal compression. This graph has a horizontal compression of 4.
::x 系数的值是水平压缩。此图的水平压缩为 4 。The number inside the parenthesis is horizontal shift (positive value, so shift left).
::括号内的数字是水平变化(正值,左移) 。The number outside the parenthesis is vertical shift, this graph has a shift DOWN.
::括号外的数是垂直移动, 此图向下移动 。Therefore our answer is: Reflected over the x-axis. Vertical stretch of 5. Reflected over the y-axis. Horizontal stretch of 1/4 . Left 3. Down 2.
::因此,我们的答案是: X 轴反射到 X 轴上。 5 的垂直伸展到 Y 轴上反射到 y 轴上, 1/4 的横向伸展到 。 左 3 的左伸缩到 2 。The graph looks like this:
::图表看起来是这样的:Review
::回顾Sketch the graph of each function.
::绘制每个函数的图形 。-
::y=2=3x y=2=3x -
::y=4( 12) 2 -
::y=2( 12x+1+2)
Write an equation for each graph.
::每个图表都写一个方程。Use graphing transformation rules to make a conjecture about what the graph of each function will look like.
::使用图形转换规则来推测每个函数的图形将是什么样子。-
:xx)=3x-4)
-
: -
: -
: -
:
Graph the following functions.
::如下图所示函数。Describe the transformations applied to the parent graph to obtain the graph of each function.
::描述用于父形图f(x)=nx的转换,以获取每个函数的图形。-
: -
: -
::s(x)=2x-5 -
::t(x)%3(2)x-5-4
Review (Answers)
::回顾(答复)Click to see the answer key or go to the Table of Contents and click on the Answer Key under the 'Other Versions' option.
::单击可查看答题键, 或转到目录中, 单击“ 其他版本” 选项下的答题键 。 -