12.12 集集的结合和交织
章节大纲
-
Freezy's Ice Cream Stand polls its customers on their favorite flavor: chocolate or vanilla? 103 customers said they liked chocolate, 98 customer said they like vanilla, while 27 customers said they liked both chocolate and vanilla. How many customers said they like only chocolate? Use a to help you.
::Freezy的冰淇淋《冰淇淋》调查其客户的口味:巧克力还是香草?103个客户说他们喜欢巧克力,98个客户说他们喜欢香草,27个客户说他们既喜欢巧克力,也喜欢香草。有多少客户说他们只喜欢巧克力?用一个来帮助你。Union and Intersection of Sets
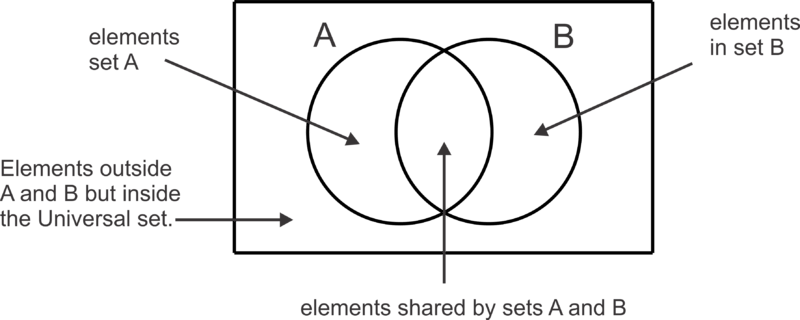
::一组组的结合和交织A Venn diagram is shown below.
::文恩图如下。The diagram illustrates that within some universe of data, there are two subsets, and , which have some elements in common. The following problem relates the use of a Venn diagram to a real world situation.
::该图表表明,在某些数据宇宙中,有两个子集A和B,它们有一些共同的要素,下面的问题是使用Venn图表与现实世界形势有关。Let's solve the following problems.
::让我们解决以下的问题。-
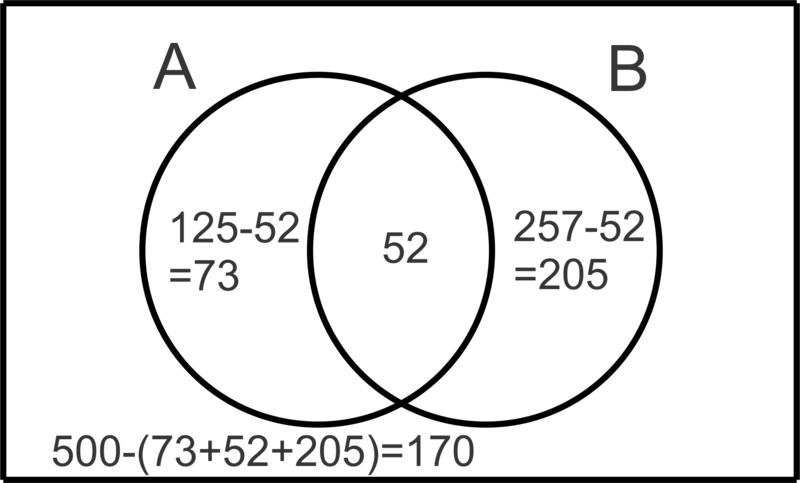
At a school of 500 students, there are 125 students enrolled in Algebra II, 257 students who play sports and 52 students that are enrolled in Algebra II and play sports. Create a Venn diagram to illustrate this information.
::在一所有500名学生的学校里,有125名学生在代数二年级注册,257名学生在体育界注册,52名学生在代数二年级注册,还有52名学生在体育界注册。
First, let’s let set represent the students enrolled in Algebra II and set represent the students who play sports. Generally speaking, it is easiest to start in the center or “intersection” of the Venn diagram. Once we place 52 in the intersection , then we can subtract it from the total number of students who play sports and the total number of student who take Algebra II to determine how many just do one or the other. Finally, we can subtract this total from 500 to figure out how many are outside the circles altogether.
::首先,让我们设定A代表在代数二中注册的学生,而设定B代表在体育运动中注册的学生。 一般来说,从文恩图的中心或“交叉”开始是最容易的。 一旦我们将52人放在交叉点,我们就可以从运动学生总数和取代数二中学生总数中减去52人,以确定有多少人只是做一个或另一个。 最后,我们可以从500人中减去这个总数,以弄清有多少人不在圈子中。There symbols that can be used to describe the number of elements in each region in the diagram as well.
::图表中可以用符号来说明每个区域的元素数量。Symbol Description Value for this Problem The number of elements in set 125 The number of elements in the intersection of sets and (all the elements that are in both sets-the overlap) 52 The number of elements in the union of sets and (all the elements that are in one or both of the sets) 330 The number of elements in the compliment of (the number of elements outside set ) 375 The number of elements in the compliment of (everything outside the union of and ) 170 The number of elements in the compliment of (everything outside the intersection of and ) 448 The number of elements in the intersection of and 's compliment (the number of elements in but not in ) 73 -
Create a Venn diagram to illustrate the following information regarding the subsets
and
in universe
:
::创建 Venn 图表,以说明关于U宇宙中子集M和N的下列信息:
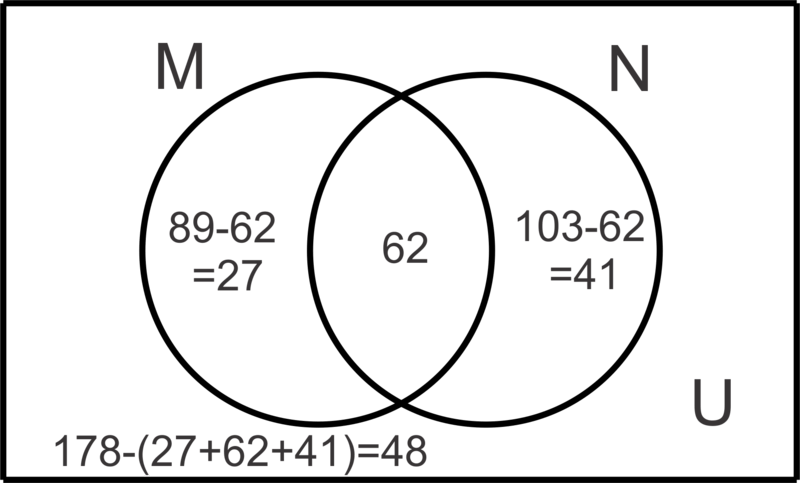
:nM)=89; n(N)=103; n(M)=130; n(U)=178
Again, we will start in the middle or intersection. We must determine how many elements are in the intersection. Let’s consider that when we add the elements in to the elements in , we are adding the elements in the intersection twice. This happens because they are counted in set and counted again in set . Did you notice that while the ? We have double counted the 62 (192-130) elements in . Now we can put this number in the Venn diagram and work our way out as we did in the previous problem.
::我们再次从中间或十字路口开始。 我们必须确定十字路口中有多少元素。 让我们想想当我们将M元素添加到N元素中时, 我们在十字路口中添加了两次元素。 这是因为这些元素在设定M值中被计算, 并在设定N值中再次计算。 您有没有注意到 n( M)+n( N)=89+103=192, 而 n( MN)=130? 我们已经加倍计算了 MN中的62( 192-130)元素。 现在我们可以在 Venn 图中输入这个数字, 并像我们在前一个问题中所做的那样, 解决我们的问题 。In general, for two sets, and , we can use the formula: to represent the relationship between the regions in the Venn diagram and to solve problems. In this case, substituting in the given information we can determine the as shown below:
::一般说来,对于M和N两组,我们可以使用公式:n(M)+n(N)-n(MN)=n(MN),以代表文恩图中各区域之间的关系并解决问题。在这种情况下,在给定的信息中,我们可以替换以下n(MN):
::89+103-n(MN) =130192-n(MN) =130-n(MN) 62n(MN) =62-
Create a Venn diagram to represent the following information and answer the questions that follow.
::创建 Venn 图表以显示以下信息并回答以下问题 。
In a survey of 150 high school students it was found that:
::在对150名高中学生的调查中发现:80 students have laptops
::80名学生有笔记本电脑110 students have cell phones
::110名学生有手机125 students have iPods
::125名学生有iPods62 students have both a laptop and a cell phone
::62名学生有笔记本电脑和手机58 students have both a laptop and iPod
::58名学生有笔记本电脑和iPod98 students have both a cell phone and an iPod
::98名学生有手机和iPod50 students have all three items
::50名学生所有3个科目,50名学生所有3个-
How many students have just a cell phone?
::有多少学生只有手机? -
How many students have none of the mentioned items?
::有多少学生没有上述项目? -
How many students have an iPod and laptop but not a cellphone?
::有多少学生拥有iPod和笔记本电脑,
First, we will use the given information to construct the Venn diagram as shown.
::首先,我们将使用给定的信息构建显示的文恩图。We can start by putting in the center where students have all three items. Next we can find the values in blue by subtracting 50 from each of the “overlapping” values. For example, there are 62 students with both a laptop and a cell phone and 50 of them also have an iPod. To find the number that have a laptop and cell phone but no iPod, subtract . Once the blue values are found we can find the green values by subtracting the blue and red values in each subset from the total in the subset. For example, the number of students with a cell phone but no other technology item is . Finally we can add up all the values in the circles and subtract this from 150, the total number of students surveyed to determine that 3 students have none of the items.
::我们可以首先在学生拥有全部三个项目的中心放置50个。 接下来,我们可以从每个“ 重叠” 值中减去50个, 找到蓝色的值。 例如, 有62个学生同时使用笔记本电脑和手机, 其中50个学生也有一个iPod。 要找到拥有笔记本电脑和手机但没有iPod的号码, 请减去62- 50=12。 一旦找到蓝色值, 我们就可以从子集的总数中减去每个子集中的蓝色和红色值, 找到绿色值。 例如, 有手机但没有其它技术项目的学生人数是110- (50+12+48)=0。 最后, 我们可以把圈里的所有数值加起来, 从150个中减去这个数值, 被调查确定有3个学生没有这些项的学生总数。Now that the Venn diagram is complete, we can use it to answer the questions.
::现在文恩图已经完成了 我们可以用它回答问题-
There are 0 students that just have a cell phone.
::有0名学生只有手机。 -
There are 3 students with none of the mentioned technology.
::有3名学生没有上述技术。 -
There are 8 students with an iPod and laptop but no cell phone.
::有8名学生有iPod和笔记本电脑,但没有手机。
Examples
::实例Example 1
::例1Earlier, you were asked to find the number of customers that said they only like chocolate.
::早些时候,有人要求你找到 有多少顾客说他们只喜欢巧克力。The number of customers who said they liked both chocolate and vanilla is the intersection of the two circles in the Venn diagram that represents this situation. Since a total of 103 people said they liked chocolate, we must subtract the number who like both chocolate and vanilla to find the number who like only chocolate.
::说他们既喜欢巧克力又喜欢香草的顾客数量是Venn图中两个圆圈的交叉点,代表着这种情况。 由于共有103人说他们喜欢巧克力,我们必须减去既喜欢巧克力又喜欢香草的人数,以找到只喜欢巧克力的数字。Therefore, 76 of Freezy's customers said they only like chocolate ice cream.
::因此,Freezy的76个顾客 说他们只喜欢巧克力冰淇淋Use the Venn diagram below to determine the number of elements in each set described in the following examples.
::使用下面的文恩图来确定下列示例中每一组元素的数量。Example 2
::例2
:Example 3
::例3
:Example 4
::例4
:Example 5
::例5
:Example 6
::例6
:Example 7
::例7
:Example 8
::例8
:8
Example 9
::例9
:6
Review
::回顾Use the information below for problems 1-5.
::以下信息用于问题1-5。In a survey of 80 households, it was found that:
::一项对80户家庭的调查发现:30 had at least one dog
::30个有至少一只狗42 had at least one cat
::42个有至少一只猫21 had at least one “other” pet (fish, turtle, reptile, hamster, etc.)
::21只至少有一个“其他”宠物(鱼、海龟、爬行动物、仓鼠等)20 had dog(s) and cat(s)
::20只有狗和猫10 had cat(s) and “other” pet(s)
::10只猫和“其他”宠物8 had dog(s) and “other” pet(s)
::8只有狗和“其他”宠物5 had all three types of pets
::5个有所有三种宠物的宠物-
Make a Venn diagram to illustrate the results of the survey.
::绘制文恩图,说明调查结果。 -
How many have dog(s) and cat(s) but no “other” pet(s)?
::有多少有狗和猫,但没有“其他”宠物? -
How many have only dog(s)?
::有多少只狗? -
How many have no pets at all?
::有多少人根本没有宠物? -
How many “other” pet(s) owners also have dog(s) or cat(s) but not both?
::有多少“其他”宠物拥有者也有狗或猫,但不是两者兼有?
Use the letters in the Venn diagram below to describe the region for each of the sets.
::使用下文文恩图中的字母来描述每组区域。-
::AB -
::A A A -
::AB -
:: -
: -
: -
::A_________________________________________________________________________________________________________________________ -
::BA
Review (Answers)
::回顾(答复)Click to see the answer key or go to the Table of Contents and click on the Answer Key under the 'Other Versions' option.
::单击可查看答题键, 或转到目录中, 单击“ 其他版本” 选项下的答题键 。 -
At a school of 500 students, there are 125 students enrolled in Algebra II, 257 students who play sports and 52 students that are enrolled in Algebra II and play sports. Create a Venn diagram to illustrate this information.