4.9 解释口述箱和口述口述口述口述口述口述口述口述口语笔
Section outline
-
If you were asked to evaluate a box plot to find the , quartiles, extremes and outliers , would you know how? What does it mean if the ‘box’ in a box plot is unusually long or short? Does a long ‘whisker’ on one or both sides mean something important?
::如果你被要求评估一个盒子图案,以找到四分位、极端和外部的图案,你会知道吗?如果盒子图案中的`盒子 ' 异常长或短意味着什么? 一方或双方的长“口哨人”意味着重要的东西吗?Review the lesson below and we’ll return to answer these questions at the end.
::总结一下下面的教训, 我们会在最后再回答这些问题。Interpreting Box-and-Whisker Plots
::解释箱和口述口述口述口语笔Box-and-whisker plots (or “box plots”) are commonly used to compare a single value or range of values for easier, more effective decision-making. Box and whisker plots are very effective and easy to read, and can summarize data from multiple sources and display the results in a single graph.
::框块图(或“框块图 ” ) 通常用于比较单一值或数值范围,以便做出更简单、更有效的决策。 框块图和钩子图非常有效,易于阅读,可以汇总多个来源的数据,并在一个图表中显示结果。Use box and whisker plots when you have multiple data sets from independent sources that are related to each other in some way. Examples include comparing test scores between schools or classrooms, and exploring data from before and after a process change.
::当您从独立来源获得以某种方式相互联系的多个数据集时, 请使用框和刻速图。 例如比较学校或教室之间的测试分数, 并探索过程变化前后的数据 。Remember that the line inside the box represents the middle value when the data points are arranged numerically. Because the median is only identified by location in a series, it can sometimes be very indicative of the trend or average of the data set as a whole, and sometimes is not useful for that purpose at all (see the first example).
::记住, 框内的线条代表数据点按数字排列时的中间值。 由于中位数仅按一系列位置确定, 它有时会非常显示整个数据集的趋势或平均数, 有时甚至完全没有用处( 参见第一个例子 ) 。Recall that skewed data appears as a longer “tail” in one direction on a histogram , it is similar on a box plot. If the box in a box plot is stretched in one direction or the other, then the data is skewed in that direction. Data skewed right indicates a closer concentration of values on the left, since the plot indicates values more “strung out” on the right side.
::请注意,斜形数据在直方图的一个方向上出现更长的“ 尾部 ” , 在框图上类似 。 如果框图中的框被拉伸到一个方向或另一个方向, 则数据会向这个方向倾斜。 数据斜形右侧显示左侧的数值更加集中, 因为图中显示的值在右侧“ 挂出 ” 。A longer box indicates a greater interquartile range since the sides of the box indicate the 1 st and 3 rd quartiles. A greater interquartile range is an indicator of data that may be somewhat unreliable. Since the interquartile range represents the 50% of the data closest to the median, a greater range in this section of the plot suggests that the median may not be a great indicator of central tendency.
::较长的框表示更大的孔径范围, 因为框的两侧表示 1 和 3 个四分位数。 更大的孔径范围表示可能不太可靠的数据指标。 由于间径范围代表了与中位数最接近的数据的50%, 绘图的这一部分中位数范围更大, 表明中位数可能不是中心趋势的大指标 。A plot with long whiskers represents a greater range for the overall sample than simply a longer box itself does. Data covering a greater range is naturally less reliable as an indicator of highly probable values, but given the option, longer whiskers are less of a concern than a long box. A broad range of possibilities but a strong likelihood of central values is more reliable to use for prediction than a moderate overall range with little concentration at the median.
::长长的胡须图比简单的长框本身要大得多。 覆盖大范围的数据作为极有可能值的指标自然不那么可靠,但考虑到这个选项,长的胡须比长框更不值得关注。 与中位值不太集中的中位值相比,有广泛的可能性但中央值的极大可能性更可靠,可用于预测的概率比中位值的中位值大得多。Identifying the Five Number Summary
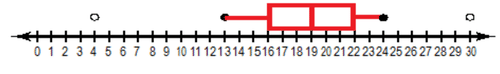
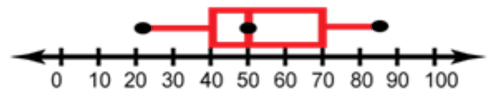
::确定五号数字摘要Identify the 5 number summary and any outliers depicted in the box plot below:
::标明下面方框图中描述的5号摘要和任何外部线:The 5 number summary is depicted by the vertical bars in the box and by the endpoints of the ‘whiskers’:
::5个数字摘要由盒子中的垂直条和 " 告密者 " 的终点所描述:-
Minimum
: 13
::最低:13人 -
1
st
Quartile
: 16
::第一次量度: 16 -
Median: 19
::中中:19 -
3
rd
Quartile: 22
::第三次量度: 22 -
Maximum
: 24
::最大值:24 -
Outliers (depicted by open circles disconnected from the box and whiskers): 4 and 30
::外部线(被与盒子和胡须断开的开放圆圈所吸引):4和30
Understanding the Shape of Box Plots
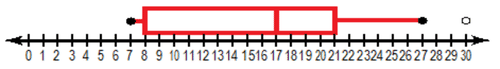
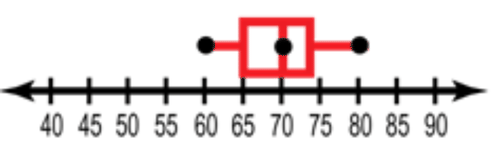
::理解框图的形状What is indicated by the shape of the box plot below?
::下面方块的形状表示什么?The box in the plot extends nearly to the lower extreme, indicating that the data less than the median is likely at least relatively consistent, since there is not a large jump between the lower 25% and the minimum. The longer whisker on the upper side suggests that there may be larger variance among the greater values, since there is a greater distance from the 3 rd quartile to the upper extreme than from the median to the 3 rd quartile.
::绘图中的框几乎延伸至下端,这表明低于中位数的数据可能至少相对一致,因为下端的25%和最低的25%之间没有大跳跃。 上方的长尾须表明,较大值之间可能有较大差异,因为从第3个四分位到上端的距离大于中位数到第3个四分位数之间的距离。Interpreting Box Plots
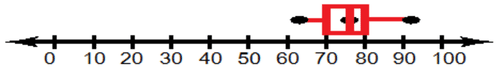
::解释框绘图A percentile box plot compares a particular value or range of values to an averaged reference point. The values on the scale represent the percentage of scores less than the plotted value. For instance, a score of 55% indicates that 55% of other values were less than the indicated score, and 45% were greater.
::百分点框图将某个特定值或数值范围比作一个平均参考点。 比额表中的值表示的分数比绘图中的值少的百分比。 例如, 55%的分数表示其他值中55%的分数低于所示分数,45%的分数更大。Maria recently completed a standardized test, and the box plot below describes her results. The median is her actual calculated percentile, and the rest of the 5 number summary suggests the range of percentiles that her score is expected to lie within once all scores are tabulated. Based on the information in the graph, would you expect Maria to be proud of her score? Why or why not?
::Maria最近完成了一个标准测试,下面的框图描述了她的成绩。中位数是她实际计算的百分位数,其余的5个摘要显示,一旦所有得分都制成表格,她的得分将包含在百分位数范围内。根据图表中的信息,你是否期望Maria为她的得分感到自豪?为什么或为什么不?Maria’s score is expected to lie between the 62 nd and 92 nd percentile, with the most likely comparison being the 76 th percentile. Since the 76 th percentile indicates that her score was higher than that of 76% of all the students who took the test, and only 24% achieved a higher score than hers, yes, I would certainly say she has reason to be proud!
::玛丽亚的得分预计介于62至92百分位数之间,最有可能的比较是76百分位数。 因为76百分位数表明她的得分高于所有参加考试学生的76 % , 只有24 % 得分高于她的得分, 是的,我当然会说她有理由感到自豪!Earlier Problem Revisited
::重审先前的问题If you were asked to evaluate a box plot to find the median, quartiles, extremes and outliers, would you know how? What does it mean if the ‘box’ in a box plot is unusually long or short? Does a long ‘whisker’ on one or both sides mean something important?
::如果你被要求评估一个盒子图以找到中位数、四分位数、极端值和外部值,你会知道吗?如果盒子图中的 " 盒子 " 异常长或短意味着什么?一面或两边一个长的 " 口哨人 " 意味着什么重要?With the practice you have had now, these questions should be easy!
::照你现在的做法,这些问题应该很容易解决!-
Median: the center vertical line in the ‘box’
::中中:“框”中的中心垂直线 -
1
st
and 3
rd
Quartiles: the leftmost and rightmost vertical lines of the ‘box’
::第1和第3批次:“框”最左和最右的垂直直线 -
Lower and Upper Extremes: the endpoints of the ‘whiskers’
::下端和上端极端: " 耳哨 " 的终点
Examples
::实例Example 1
::例1Make a box and whisker plot from the following data sets.
::从下面的数据集中绘制一个盒子和长方形图。1. For all three sets, first organize the data by increasing numerical order and identify the five-number summary (FNS). Once you have the FNS, create the box plot for each just as in the examples above. The three plots should resemble the images below:
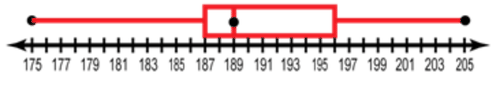
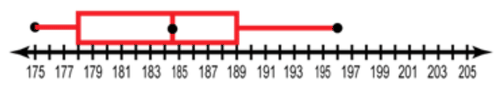
::1. 对于所有这三组数据,首先通过增加数字顺序来组织数据,并确定五个数字摘要(FNS)。一旦有了FNS,就按上述例子为每一组创建框图。这三组图应与以下图象相似:a. Make a box and whisker plot for the Initial weight (December) of 14 women in a weight loss study (pounds) 190, 175, 187, 199, 205, 187, 176, 180, 187, 191, 200, 193, 188, 196
::a. 在一项减重研究(磅)中,为14名妇女的初始体重(12月)绘制一个盒子和插图(12月)190、175、187、199、205、187、176、180、187、187、198、196、187、196、180、187、191、191、200、193、188、196b. Make a box and whisker plot for the weights of the same women one month later (January) 187, 174, 181, 189, 196, 178, 174, 176, 181, 186, 188, 191, 183, 191
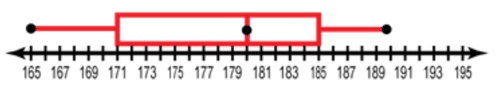
::b. 一个月后(1月)187、174、181、189、196、178、174、176、181、186、186、188、191、183、191c. Make a box and whisker plot for the Weights of the same women in February. 181, 165, 176, 182, 190, 176, 171, 170, 171, 185, 187, 181, 179, 186
::c. 于2月为同一妇女的体重制作一个盒子和插件。 181、165、176、182、190、176、176、171、170、171、185、187、181、179、1862. How do the data in a and c compare?
::2.a和c中的数据如何比较?If we compare the data between a and c, we can see the overall weights of the women in the study did indeed go down. In fact, the median value at the start of the study was greater than the maximum two months later.
::如果我们比较a和c之间的数据,我们可以看到研究中女性的总体重量确实下降了。 事实上,研究开始时的中位值高于两个月后的最大值。3. How did the median change?
::3. 中位数变化如何?The median in December was 189, and in February it was 180.
::12月的中位数为189,2月为180。4. How did the maximum weight change?
::4. 最大重量是如何变化的?The maximum in December was 205, and went down to 190 by February.
::12月的最高值为205人,到2月降至190人。5. How did the minimum weight change?
::5. 最低重量是如何改变的?The minimum weight in December was 187, and it also went down, to 171 by February.
::12月的最低重量为187个,到2月也降至171个。6. How did the range change?
::6. 范围是如何变化的?The range increased notably, from a mere 9 pounds in December, to more than 1.5 times that, 14, in January.
::幅度明显扩大,从12月的9磅增至1月的14磅,是12月的1.5倍以上。7. How would you judge the effectiveness of the weight loss method used in the study?
::7. 你如何判断研究中使用的减重方法的有效性?It would appear that the method was effective, at least in the short term. The increased range would indicate that it was somewhat more effective for some participants than others.
::看来这种方法是有效的,至少在短期内是如此,扩大的范围将表明,对于一些参与者来说,这种方法比其他参与者更为有效。Review
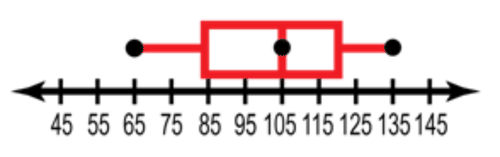
::回顾1. What is the five number summary of the following box and whisker plot?
::1. 以下方框和胡须图案的5个数字摘要是什么?2. The box plot shows the heights in inches of boys on a High School Baseball Team. What is the 5 number summary of the plot?
::2. 盒式图示显示高中棒球队男生身高的英寸。3. Listed are the heights in inches of girls on a High School Ski Team. Make a plot of the girls’ heights. 58, 59, 59, 60, 62, 65, 68, 69, 70, 70, 71
::3. 所列为高中滑雪队女生身高的英寸,图示女孩身高。 58、59、59、60、62、65、68、69、70、70、714. Comparing the heights between the two teams, which has the taller players on average? How do you know?
::4. 比较两队之间的高度,两队平均人数较高,你们怎么知道?Use the box and whisker plot below to examine scores received on an English GED Test to answer questions 5-9
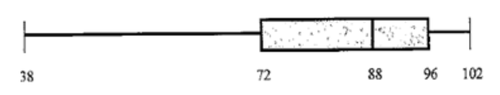
::使用下面的盒子和胡须地块来检查在英语GED测试中收到的分数,以回答问题5-95. What was the high score on the test?
::5. 测试的高分是多少?6. What percent of the class scored above a 72?
::6 %的班级得分超过72分?7. What was the median score on the test?
::7. 测试的中位分数是多少?8. What percent of the class scored between 88 and 96?
::8. 88至96年级的得分比例是多少?9. Would you expect the mean to be above or below the median? Explain
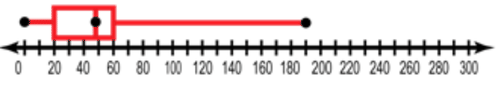
::9. 你是否期望平均值高于或低于中位数?Use the graph below that shows how much girls spent on average per month on clothes during August.
::下图显示8月份女孩每月平均花在衣服上的人数。10. How many girls shop for clothes?
::10. 有多少女孩去买衣服?11. What percent of girls spent less than $85.00 in August on clothes?
::11. 8月,不到85.00美元的女孩在衣服上花在衣服上的比例是多少?12. Would you expect the mean number of dollars spent to be higher or lower than the median? Explain
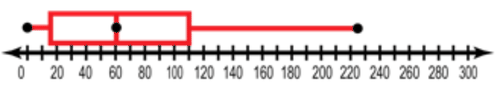
::12. 你是否预期平均花费的美元数额会高于或低于中位数?Use the graphs below to compare the amount of time a teenager spends in the bathroom getting ready for school and the amount of time they spend in the bathroom getting ready to go to a party.
::用下图比较青少年在浴室里准备上学的时间和在浴室里准备去派对的时间。TIME SPENT GETTING READY FOR SCHOOL:
::时间准备 学校:TIME SPENT GETTING READY FOR A PARTY:
::准备参加派对的时间:13. What percent of teenagers spend at least 15 minutes getting ready for a party?
::13 %的青少年至少花15分钟准备参加派对?14. What is the 3 rd Quartile for the time spent getting ready for a party?
::14. 准备参加聚会的时间的第三个问题是什么?15. Is it more common for a teenager to spend more than 1 hour getting ready for school or between 1 and 2 hrs getting ready for a party? Explain
::15. 青少年要花一个多小时准备上学,还是要花1至2小时准备参加聚会,这是否更为常见?Answer True or False for questions 16-24.
::对问题16-24回答真或假。16. ______ Some teenagers do not spend time getting ready for parties.
::16. *一些青少年没有花时间准备参加聚会。17. ______ The graph of time spent getting ready for a party contains more data than the getting ready for school graph.
::17. 用于准备参加一个政党的时间图表中的数据多于用于准备学校图表的数据。18. ______ 25% of teenagers spend between 48 and 60 minutes getting ready for school.
::18. 25%的青少年花费48至60分钟准备上学。19. ______ 15% of the teenagers did not go to parties that month
::19. 15%的青少年没有参加该月的聚会20. ______ In general teenagers spend more time getting ready for a party than getting ready for school.
::20. 一般来说,青少年花更多的时间准备参加一个聚会,而不是准备上学。21. ______ The Party data is more varied than the homework data
::21. □ 缔约方的数据比家庭作业数据差异更大。22. ______ The ratio of teenagers who spend more than 110 minutes getting ready for a party to those who spend less is about 2:1
::22. 花超过110分钟准备参加聚会的青少年与花少的青少年的比例约为2:1。23. ______ 225 Teenagers watch TV.
::23. 225名青少年看电视。24. ______ Twice as many teenagers spend more than 1 hour on getting ready for school, than they do spending an hour getting ready for a party.
::24. 青少年在准备上学方面花费的时间是青少年们花在准备上学上的时间的两倍多,而他们花在准备参加派对上的时间是青少年们花在准备上学上的时间的两倍多。Review (Answers)
::回顾(答复)Click to see the answer key or go to the Table of Contents and click on the Answer Key under the 'Other Versions' option.
::单击可查看答题键, 或转到目录中, 单击“ 其他版本” 选项下的答题键 。 -
Minimum
: 13