5.5 模式 - 概率和统计
Section outline
-
Noela is working on a homework assignment for her social studies class, and needs to find the 10-year historical period between 1900 and 2000 with the greatest number of recorded hurricanes worldwide. If she uses a data sheet listing all recorded hurricanes, what measure of central tendency would she use to identify the decade with the most hurricanes?
::诺拉正在为其社会研究班做家庭作业,需要找到全世界记录到的飓风数量最多的10年历史时期 — — 1900年到2000年。 如果她使用一份数据表列出所有记录到的飓风,她用什么衡量中心趋势来识别飓风最多的十年?
After the lesson below, we’ll return to this question to review the answer.
::在以下的教训之后, 我们将回到这个问题上来审查答案。The Mode
::模式The mode is the value(s) in a set that occurs with the greatest frequency. Of the three common measures of central tendency , the mode is the only one that may actually be one of the extremes in a set with more than one value. In certain circumstances, the mean of a set with differing values may approach one of the extremes, but only the mode may actually be one of them.
::模式是以最大频率出现的一组中的值。 在三种常见的中心趋势中,该模式是唯一一个可能实际是一组中具有不止一个值的极端之一的模式。 在某些情况下,具有不同值的一组的平均值可能接近其中的一个极端,但只有模式可能实际是其中之一。Identification of the mode(s) is simple:
::识别方式简单明了:-
Organize the set in numerical order (to make it easier to count repeating values) and make note of the frequencies of any repeated values (any values with a frequency greater than 1)
::按数字顺序组织集(以便更容易计算重复值),并注意任何重复值的频率(频率大于1的任何值) -
The value(s) occurring with the greatest frequency are the mode(s)
::以最大频率出现的值为模式。
Because the mode is not directly related to the middle position in the organized series of values, if there are multiple values with the same frequency, do not be concerned if there is a large difference between different modes.
::由于该模式与有组织数值系列中的中间位置没有直接关系,如果多数值的频率相同,如果不同模式之间有很大差异,则不关注。A set with only one mode is called a unimodal set. A set with two modes is a bimodal set. Technically, there are also trimodal sets, but generally any more than two modes are simply referred to as multimodal .
::仅使用一种模式的组合称为单一方式的组合。 两种模式的组合是双模式的组合。 从技术上讲,还有三模式的组合,但通常,超过两种模式的组合都被称为多式联运。Identifying the Mode
::确定模式Identify the mode of z .
::识别 z 模式 。z = { 3 , 5 , 13 , 18 , 3 , 7 , 9 , 12 , 11 , 3 , 9 , 5 , 4 , 3 , 13 }
If we put the values in ascending order, we get:
::z3, 13, 18, 3, 7, 9, 12, 11, 3, 9, 9, 5, 4, 3, 13} 如果我们把这些值按上升顺序排列, 我们就会得到:3, 3, 3, 3, 4, 5, 5, 7, 9, 9, 11, 12, 13, 13, 18
Since 3 is the only value that appears four times, and all other values appear 3 or fewer times, 3 is the mode of z .
::由于3是出现4次的唯一值,所有其他值显示3次或少于3次,因此3是z的模式。Identifying the Mode Given a Histogram
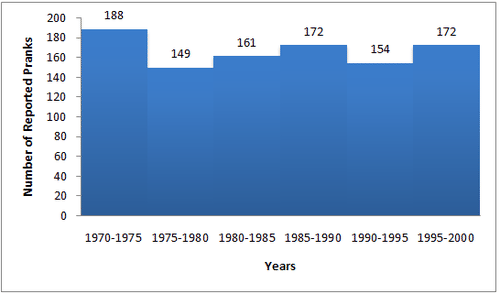
::识别直方图显示模式Identify the mode of the set described by the histogram (the mode of the number of reported pranks):
::识别直方图描述的集模式( 报告的恶作剧数量模式) :The intervals 1985-1990 and 1995-2000 are the only two with matching frequencies: 172 reported pranks.
::1985-1990年和1995-2000年的间隔期是唯一两个频率相匹配的间隔期:172起报告的恶作剧。The mode is 172 reported pranks
::模式是172个举报恶作剧Looking at Frequency Polygons
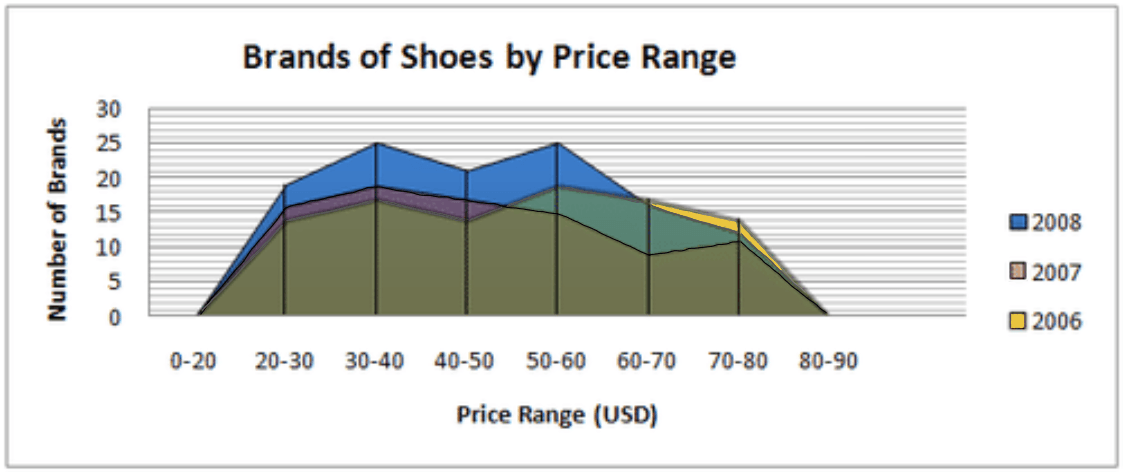
::查看频率多边形Answer the questions using the jointly graphed in the image below.
::使用下图中共同图表解答问题。a. Which years demonstrate unimodal distribution ?
::a. 哪些年份显示单式分布?Which years demonstrate unimodal distribution? 2007 has only one mode: 30-40
::2007年只有一个模式:30-40b. Which years demonstrate bimodal distribution?
::b. 哪些年份显示双式分配?Which years demonstrate bimodal distribution? 2008 has two modes: 30-40 and 50-60
::2008年有两种模式:30-40和50-60。c. Which years demonstrate multimodal distribution OR have no mode?
::c. 哪些年份证明多式联运或无模式?Which years demonstrate multimodal distribution OR have no mode? 2006 has 3 modes: 20-30, 40-50, 70-80
::2006年有三种模式:20-30、40-50、70-80。d. Which year(s) have the mode with the greatest frequency?
::d. 哪种年份的模式频率最大?Which year(s) have the mode with the greatest frequency? Year 2008 has a mode of 25, the greatest on the chart.
::哪个年份的频率最大? 2008年的频率为25,是图表上最高的年份。Earlier Problem Revisited
::重审先前的问题Noela is working on a homework assignment for her social studies class, and needs to find the 10-year historical period between 1900 and 2000 with the greatest number of recorded hurricanes worldwide. If she uses a data sheet listing all recorded hurricanes, what measure of central tendency would she use to identify the decade with the most hurricanes?
::诺拉正在为其社会研究班做家庭作业,需要找到全世界记录到的飓风数量最多的10年历史时期 — — 1900年到2000年。 如果她使用一份数据表列出所有记录到的飓风,她用什么衡量中心趋势来识别飓风最多的十年?Noela needs to organize the data by decade, then identify the mode , this will be the decade with the greatest frequency of hurricanes.
::Noela需要在十年前整理数据,然后确定模式,这将是飓风频率最高的十年。Examples
::实例Find the mode:
::查找模式 :Example 1
::例1{ 12 , 17 , 12 , 63 , 17 , 12 , 54 , 23 , 39 }
Put the values in numerical order (not truly necessary, but makes it easier to identify multiples): 12, 12, 12, 1 7, 17, 23, 39, 54, and 63.
::按数值顺序排列数值(并非真正必要,但易于识别多重):12、12、12、12、17、17、17、23、39、54和63。There are three 12’s (highlighted in red), two 17’s, and only one of each other value. 12 is the mode.
::共有三张12张(红色高亮)、两张17张,Example 2
::例26 7 7 9 7 3 4 4 6 8 9 8 0 1 2 3 3 3 3 4 4 6 7 7 9 0
This stem plot already lists the values in ascending order, so it is easy to see that 83 is the mode , with a frequency of 4.
::此干图已经按向上顺序列出了值, 因此很容易看出83是模式, 频率为4 。Example 3
::例3{ 93 , 91 , 95 , 92 , 92 , 93 , 95 , 94 , 97 , 93 , 86 , 92 , 94 , 89 , 92 , 91 , 92 , 93 , 94 , 100 }
If we put the values in ascending order: 86, 89, 91, 91, 92, 92, 92, 92, 92, 93, 93, 93, 93, 94, 94, 94, 95, 95, 97, and 100, we can see right away that 92 is the mode, with frequency 5.
::如果我们将数值上移顺序:86、89、91、91、91、92、92、92、92、92、92、92、93、93、93、93、94、94、94、94、94、95、95、97和100,我们就可以看到92是模式,频率5。Example 4
::例4{ 275 , 281 , 269 , 280 , 268 , 278 , 279 , 274 , 275 , 281 , 285 , 285 , 278 , 269 , 283 , 263 , 277 , 276 , 269 , 281 , 272 , 275 , 276 }
In numerical order, the set looks like: 263, 268, 269, 269, 269, 272, 274, 275, 275, 275, 276, 276, 277, 278, 278, 279, 280, 281, 281, 281 , 283, 285, and 285. It is apparent now that this is a multimodal set with modes: 269, 275, and 281.
::按数字顺序排列,这套模式看起来如下:263、268、269、269、269、269、272、274、275、275、276、276、277、278、278、278、279、280、281、281、281、281、283、285和285。Review
::回顾Find the mode(s):
::查找模式 :- { 326 , 314 , 325 , 315 , 315 , 307 , 318 , 318 , 320 , 312 , 325 , 321 , 312 , 320 , 312 , 325 , 326 , 325 }
- { 35 , 37 , 28 , 42 , 32 , 42 , 35 , 45 , 28 , 43 , 37 , 43 , 27 , 41 , 27 , 45 , 31 , 42 , 28 , 45 }
- { 123 , 167 , 150 , 167 , 152 , 128 , 129 , 150 , 140 , 121 }
- { 2120 , 3040 , 2180 , 1892 , 923 , 9231 , 8231 }
- { 12 , 23 , 41 , 23 , 61 , 130 , 210 , 130 , 592 , 130 , 12 }
- { 23.43 , 32.52 , 23.92 , 32.25 , 23.43 , 29.55 , 28.30 , 23.34 }
- { 1 2 , 4 9 , 3 7 , 2 5 , 21 23 , 16 27 , 2 4 }
- { .57 , 23 100 , .44 , 17 100 , 52 100 , .23 , .44 , 45 100 }
- { 12 , 1.2 , .012 , 102 , 120 , .012 , .12 , 1.2 }
- { 123 , 12.3 , 12 30 , 123 100 , 120 123 , 30 12 , 1 123 , 1.23 , .123 }
- 2 2 2 3 3 5 5 6 9 9 9 4 1 2 2 3 3 4 4 8 5 2 4 5 5 7 7 7
Review (Answers)
::回顾(答复)Click to see the answer key or go to the Table of Contents and click on the Answer Key under the 'Other Versions' option.
::单击可查看答题键, 或转到目录中, 单击“ 其他版本” 选项下的答题键 。 -
Organize the set in numerical order (to make it easier to count repeating values) and make note of the frequencies of any repeated values (any values with a frequency greater than 1)