7.4 可视化概率分布
Section outline
-
Writing down all of the various probabilities of outcomes of an event is fine, but it can get a little tedious both to create and to read a long list of different probabilities. How else can we display the information from a probability distribution?
::记录事件结果的所有各种概率是好的,但创建和阅读不同概率的长列表可能会有点无聊。 否则我们如何从概率分布中显示信息 ?Visualizing Probability Distributions
::可视化概率分布Probability distributions can convey a fantastic amount of useful information, but there may be so much information to view that the important points get lost in the data. Because of this, it is very common to create a graphical representation of the data to highlight important or interesting values.
::概率分布可以传达大量绝佳的有用信息,但可能有很多信息可以显示重要点在数据中丢失。 因此,为突出重要或有趣的值而创建数据图形表达方式是非常常见的。Tables, histograms and bar charts in particular are excellent means of visualizing the data from discrete probability distributions. If you use a histogram or bar chart, by enumerating the various outcomes along the -axis and the expected probability of occurrence on the -axis, you create a very concise and easily read summary of the distribution of outcome probabilities.
::表格、直方图和条形图是从离散概率分布中可视数据的最佳手段。如果使用直方图或条形图,通过罗列x轴上的各种结果和y轴上的预期发生概率,您将生成一个非常简明易读的结果概率分布摘要。Illustrating Probability Distributions
::免疫概率分布Let be a discrete random variable representing the number of heads that might result from flipping a coin three times. Create a bar chart to illustrate the probability distribution of .
::让 C 变成一个离散随机变量, 代表翻硬币三次后可能产生的头数。 创建条形图表以显示 C 的概率分布 。Start by identifying the possible outcomes of flipping a coin three times:
::首先确定翻硬币三次的可能结果:
::TTT有0个头。TT有1个头。TT有1个头。TH有2个头。HTT有1个头。HT有2个头。HHT有2个头。HHH有3个头。So we have 1 possibility with 0 heads:
::因此,我们有一个使用0头的可能性:P(0)=18=0.125。
::1头3种可能性:P(1)=38=0.3753;2头2种可能性:P(2)=38=0.3751;3头3:P(3)=18=0.125。
Creating Tables
::创建表格Create a table showing the probability distribution of the possible outcomes of rolling two standard dice.
::创建一个表格, 显示滚动两个标准骰子可能结果的概率分布 。Let random variable represent the sum of the pips showing on the roll of both dice. We know then than .
::让随机变量 S 代表两个骰子滚动中显示的管道总和。 我们知道超过 2S12 。Find all of the possible outcomes of rolling two dice, as shown in the image on the below.
::找到滚动两骰子的所有可能结果,如下图所示。Create a table showing the probabilities of each possible outcome of :
::创建一个表格,显示S的每一种可能结果的概率:2 8 3 9 4 10 5 11 6 12 7 Creating Probability Histograms
::创建概率直方图Create a probability histogram of the possible outcomes of rolling two dice. You may use your data from Example B.
::创建滚动两骰子可能结果的概率直方图。 您可以使用示例B中的数据 。In the previous example, we created a table of the probabilities of each outcome of rolling two dice, designated as discrete random variable . Let’s add one more column for each value so we can convert the fractional probability to decimal:
::在上一个例子中,我们创建了一个表格,列出滚动两个骰子的每一种结果的概率,指定为离散随机变量S。让我们为每个值再增加一列,这样我们就可以将分数概率转换为小数:
::S S 级
::P(西)
::P(西)decimal
::小数小数小于
::S S 级
::P(西)
::P(西)decimal
::小数小数小于2 .028 8 .139 3 .056 9 .111 4 .083 10 .083 5 .111 11 .056 6 .139 12 .028 7 .167 We can use this data to create a histogram, setting the -axis to the probability and the -axis to the values of :
::我们可以使用这些数据创建直方图, 将 Y 轴设定为概率, x 轴设定为 S 的值 :Earlier Problem Revisited
::重审先前的问题Writing down all of the various probabilities of outcomes of an event is fine, but it can get a little tedious both to create and to read a long list of different probabilities. How else can we display the information from a probability distribution?
::记录事件结果的所有各种概率是好的,但创建和阅读不同概率的长列表可能会有点无聊。 否则我们如何从概率分布中显示信息 ?Tables, histograms, bar graphs and pie charts are the most common visual representations of probability distributions.
::表格、直方图、条形图和饼图是概率分布最常见的直观表示。Examples
::实例Example 1
::例1Let be a discrete random variable representing the number of red marbles pulled over three trials of pulling and replacing one marble out of a bag containing 4 red, 4 yellow, and 4 green marbles. Create a probability distribution table for .
::让R变成一个离散随机变量,代表红色大理石被拉动三次试验的红色大理石数量,即从装有4个红色、4个黄色和4个绿色大理石的袋子中拉出并更换1个大理石。为 R 创建一个概率分布表。The possible values of are 1, 2, and 3. There is a chance or red on each pull. The probability distribution for would thus be:
::R的可能值为 1, 2 和 3 。 每次拉动时有 13 个机会或红色 。 因此 R 的概率分布为 :Example 2
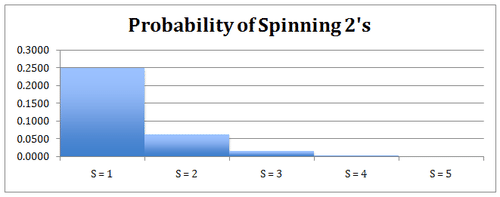
::例2Let be a discrete random variable representing the number of 2's you spin over 5 spins on a spinner with 4 equally-spaced points. Create a histogram showing the probability distribution of .
::S 是一个离散随机变量,代表您在4个平空点的脊柱上旋转5个旋转的 2 的数。创建一个直方图,显示 S 的概率分布 。The possible values of are 1, 2, 3, 4, and 5. There is a chance of a 2 on each spin:
::S的可能值为 1, 2, 3, 4, 5, 14 个机会, 每转一转 2 :Example 3
::例3Create a probability distribution table for the outcomes of the sum of two 5-sided dice.
::为两张五面骰子之和的结果创建概率分布表。Let’s start by creating a grid to show all of the possible combinations:
::让我们首先建立一个网格来显示所有可能的组合:1
2
3
4
5
1
2
3
4
5
6
2
3
4
5
6
7
3
4
5
6
7
8
4
5
6
7
8
9
5
6
7
8
9
10
Now we can create a distribution based on the probability of each possible outcome 2-10, let be a discrete random variable representing the sum of the dice:
::现在,我们可以根据每种可能的结果2-10的概率创建一个分布, 让 R成为代表骰子之和的离散随机变量 :2
3
4
5
6
7
8
9
10
Review
::回顾-
Create a probability distribution table for a single roll of two 7-sided dice.
::为两张七面骰子的单卷创建概率分布表 。 -
Create a histogram to visualize the data from problem 1.
::创建直方图, 将问题 1 的数据直观化 。 -
Create a pie chart showing the same data.
::创建显示相同数据的馅饼图表。 -
There are 12 green, 9 blue, and 4 red candies in an opaque bag. Let
be a discrete random variable representing the number of red candies you get
in a row
by pulling and replacing one candy four times. Create a probability distribution table illustrating the possible outcomes of
.
::有12个绿色、9个蓝色和4个红色糖果在一个不透明的袋子里。让 R 成为一个离散的随机变量, 代表您通过拉和替换一个糖果来排成一行获得的红色糖果的数量 。 创建一个概率分布表, 显示 R 的可能结果 。 -
Create a histogram illustrating the information from problem 4.
::创建直方图, 显示问题4的信息 。 -
Create a pie chart showing the same data.
::创建显示相同数据的馅饼图表。 -
Let discrete random variable
represent the number of 7’s you get when rolling two 5-sided dice three times. Create a probability distribution table for
.
::让离散随机变量 S 代表滚动两张五面骰子三次时得到的 7 位数。 为 S 创建概率分布表 。 -
Create a histogram illustrating the information from problem 7.
::创建直方图, 显示问题 7 的信息 。 -
Create a pie chart with the same information.
::创建含有相同信息的馅饼图表 。 -
Let
be the number of tails you get when you flip a fair coin 4 times, create a probability distribution table for
.
::让 T 成为翻转公平硬币4 次时的尾巴数, 为 T 创建一个概率分布表 。 -
Create a histogram or bar chart for
, from problem 10.
::从问题10创建 T 的直方图或条形图表。 -
Create a pie chart for
from problem 10.
::从问题10为 T 创建一个饼图表。
Review (Answers)
::回顾(答复)Click to see the answer key or go to the Table of Contents and click on the Answer Key under the 'Other Versions' option.
::单击可查看答题键, 或转到目录中, 单击“ 其他版本” 选项下的答题键 。 -
Create a probability distribution table for a single roll of two 7-sided dice.