5.5 儿科功能的频率和时期
章节大纲
-
The transformation rules about horizontal stretching and shrinking directly apply to graphs. If a sine graph is horizontally stretched by a factor of that is the same as a horizontal compression by a factor of 2.
::水平拉伸和缩缩的转换规则直接适用于图形。如果正弦图水平拉伸的系数为12,则正弦图水平拉伸的数值与水平压缩的系数为2相同。How does the equation change when a sine or cosine graph is stretched by a factor of 3?
::当正弦图或正弦图被3乘以时,方程式是如何改变的?Period and Frequency of Sinusoidal Functions
::候类功能的时期和频率The general equation for a sinusoidal function is:
::等离子函数的一般等方程式是:
:xxx)+d)+(b(x+c)+(d)+(xx)+(xx)+
The controls the reflection across the -axis. The coefficient controls the . The constant controls the vertical shift . Here you will see that the coefficient controls the horizontal stretch .
::\ 控制 x 轴反射。 系数 a 控制 。 常数 d 控制垂直移动。 这里您可以看到 系数 b 控制水平拉伸 。Period
::期间Horizontal stretch is measured for sinusoidal functions as their periods. This is why this function family is also called the periodic function family. The period of a sinusoid is the length of a complete cycle. For basic sine and cosine functions, the period is . This length can be measured in multiple ways. In word problems and in other tricky circumstances, it may be most useful to measure from peak to peak.
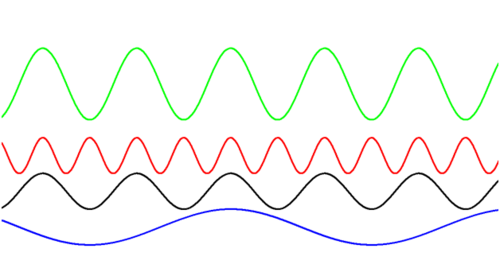
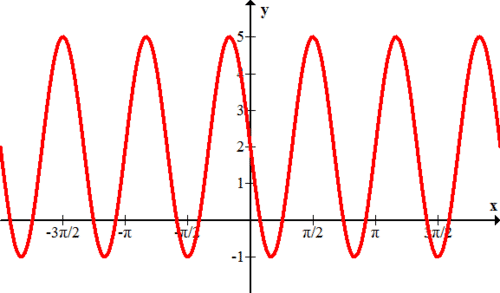
::水平间距是按正弦函数的周期来测量的。 这就是为什么此函数族也被称为周期函数族。 类内线是整个周期的长度。 对于基本正弦函数和正弦函数, 时间段是 2++。 这个长度可以用多种方式来测量。 在文字问题和其他棘手的情况下, 从峰值到峰值, 衡量最有用 。The following three waves have different periods. To rank each wave by period from shortest to longest, look at he distance between each peak.
::以下三波有不同的时段。 将每波排列为从最短到最长的时段, 请看看每波峰之间的距离 。The red wave has the shortest period.
::红波时间最短The green and black waves have equal periods. Even though the green wave has greater amplitude than the black wave, they both have the same period.
::绿色和黑色的海浪有相同的时间段。 尽管绿色海浪比黑浪的振幅更大,但它们都有相同的时间段。The blue wave has the longest period.
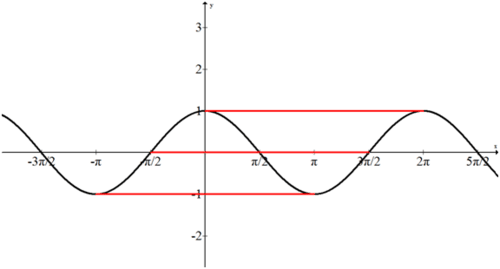
::蓝色波浪的周期最长。The ability to measure the period of a function in multiple ways allows different equations to model an identical graph. In the image above, the top red line would represent a regular cosine wave. The center red line would represent a regular sine wave with a horizontal shift. The bottom red line would represent a negative cosine wave with a horizontal shift. This flexibility in perspective means that many of the examples, guided practice and practice problems may have multiple solutions. For now, try to always choose the function that has a period starting at
::以多种方式测量函数周期的能力允许不同的方程式模拟相同的图形。 在上方的图像中, 上方的红线将代表一个正弦波。 中方的红线将代表一个正正弦波, 带有水平变化 。 下方的红线将代表一个负余弦波, 带有水平变化 。 视野中的这种灵活性意味着许多示例、 引导的做法和实践问题可能具有多个解决方案 。 现在, 尝试总是选择从 x=0 开始一个时期的函数 。Frequency
::频率频率频率Frequency is a different way of measuring horizontal stretch. For sound, frequency is known as pitch. With sinusoidal functions, frequency is the number of cycles that occur in . A shorter period means more cycles can fit in and thus a higher frequency. Period and frequency are inversely related by the equation:
::频率是测量水平伸展的另一种不同方式。 对于声音, 频率被称为斜度。 在等离子函数中, 频率是 2中的周期数 。 较短的周期意味着更多的周期可以适合 2, 因而是更高频率 。 对于音频, 频率被称为斜度 。 使用等式时, 周期和频率是反比的 :
::周期=2+频率The equation of a basic sine function is . In this case , the frequency, is equal to 1 which means one cycle occurs in . If , the period is which means the period is and the graph is stretched.
::基本正弦函数的方程式是 f( x) = sinx。在此情况下b , 频率等于 1, 表示一个周期在 2 中发生。 如果 b= 12, 时段为 2 12, 时段为 4, 图形被拉伸 。Examples
::实例Example 1
::例1Earlier, you were asked how an equation changes when a sine or cosine graph is stretched by a factor of 3. If a sine graph is horizontally stretched by a factor of 3 then the general equation has . This is because is the frequency and counts the number (or fraction) of a period that fits in a normal period of . Graphically, the sine wave will make a complete cycle in . Similarly, a cosine graph will have and will have a period of .
::早些时候,有人询问当正弦或正弦图形被拉长为3系数时,正弦图形如何改变公式。如果正弦图形水平拉长为3系数,那么一般方程式就有b=13。这是因为 b 是频率和计算周期数(或分数),该时间段与正常时间段相符合。图形化说,正弦或正弦图形将在 6-Q 中完成一个完整的周期。同样,正弦图形也会有b=13, 并且有 6-Q 的周期。Example 2
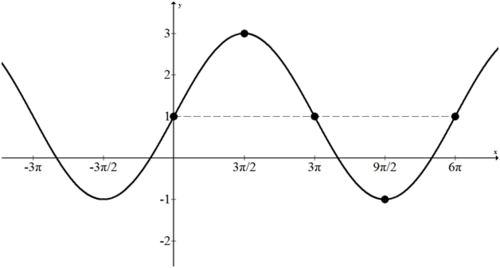
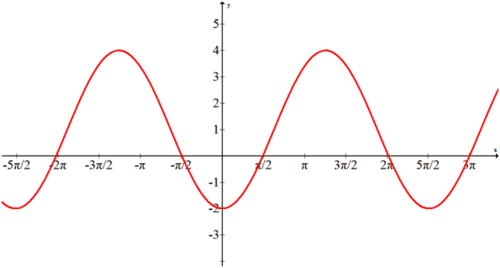
::例2Identify the amplitude, vertical shift, period and frequency of the following function. Then graph the function.
::识别以下函数的振幅、垂直移动、周期和频率。然后绘制函数图。
:
::a=2,b=13,d=1The amplitude is , the vertical shift is , and the frequency is . The period would be , or
::振幅是2, 垂直移动是1, 频率是13, 时段是2, 13, 或6。Often the most challenging part of graphing periodic functions is labeling the axes. Since the period is , start by drawing the sinusoidal axis shifted appropriately. Then divide the into four parts so that the 5 guiding points of the sine graph can be plotted with the amplitude and reflection in mind. The very last thing to do is to draw and extend the curve.
::绘制周期函数图时,通常最具挑战性的部分是标出轴。由于时间段为 6 ° , 首先绘制正弦轴, 然后将 6 ° 分为四个部分, 这样正弦图的 5 个指导点就可以用振幅和反射来绘制。 最后要做的是绘制和扩展曲线 。Example 3
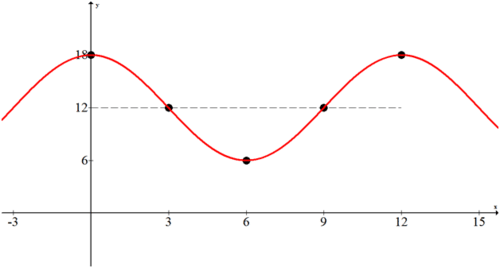
::例3A measuring stick on a dock measures high tide to be 18 feet and low tide to be 6 feet. It takes about 6 hours for the tide to switch between low and high tides. Determine a graphical and algebraic model for the tides knowing that at there is a high tide.
::码头上的测量杆测量高潮为 18 英尺,低潮为 6 英尺。 低潮需要大约 6 小时才能在低潮和高潮之间转换。 确定潮的图形和代数模型,知道在 t= 0 时有高潮。Usually the best course of action for word problems is to identify information, plot points, sketch and then finally come up with an equation.
::通常,文字问题的最佳行动方案是查明信息、绘图点、草图,然后最终提出一个方程式。From the given information you can deduce the following points. Notice how the sinusoidal axis can be assumed to be the average of the high and low tides.
::从给定的信息中可以推断出以下各点。 注意正弦轴如何可以被假定为高潮和低潮的平均值 。Time (hours) Water level (feet) 0 18 6 6 12 18 3 9 12 By plotting those points and filling in the sinusoidal axis you can observe a cosine graph.
::通过绘制这些点和填充等离子轴,您可以观察余弦图。The amplitude is 6 so . There is no vertical reflection. Since the period is 12 you can determine the frequency :
::a=6. 没有垂直反射。 由于周期为12, 您可以确定频率 b:
::12=2bb6The vertical shift is 12 so . Thus you have all the pieces to make an algebraic model:
::垂直移动为 12 so d=12。 因此, 您有全部的元件可以制作代数模型 :
:Example 4
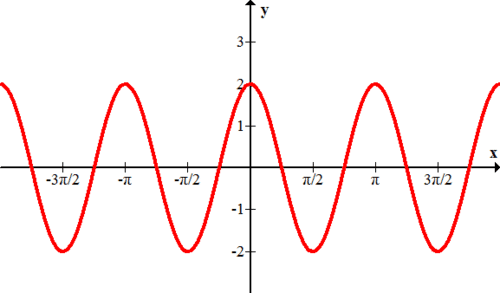
::例4Graph the following function: .
::如下的函数图解 : g( x) ( 8x) +2 。The labeling is the most important and challenging part of this problem. The amplitude is 1. The shape is a negative cosine. The vertical shift is 2. The period is .
::标签是这一问题中最重要和最具挑战性的部分。 振幅是 1 。 形状是负余弦, 垂直变化是 2 。 周期是 2 和 8 + 4 。Example 5
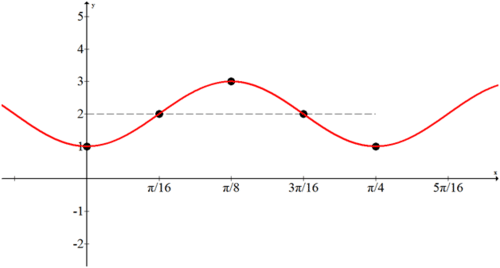
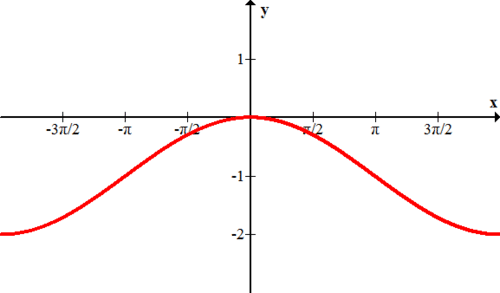
::例5Given the following graph, identify the and create an algebraic model.
::根据下图,确定并创建代数模型。The amplitude is 3. The shape is a negative cosine. The period is which implies that . The vertical shift is 1. .
::振幅为 3 。 形状为负余弦 。 周期为 5°2 , 这意味着 b= 45 。 垂直变化为 1. f( x)\\\\\\\\ 3cos\\\ ( 45x)+ 1 。Summary -
For the general form of the sinusoidal function
the coefficient
represents the horizontal stretch.
::对于正弦函数f(x)asin(b(x+c)+d)的一般形式,系数b代表水平伸展。 -
The period of a sinusoid is the length of a complete cycle, with basic sine and cosine functions having a period of
::胰岛素的周期是整个周期的长度,基本正弦和余弦功能的周期为2。 -
Frequency is the number of cycles that occur in
::频率是 2 周期数 。 -
Period and frequency are inversely related by the equation:
::按方程式:周期=2-频率,周期和频率反比相关。
Review
::回顾Find the frequency and period of each function below.
::查找以下每个函数的频率和时间段。1.
::1. f(x) =sin(4x)+12.
::2. g(x)\\\\\\\\\\\\\\\\\\\\\\\\\\\\\\\\\\\\\\\\\\\\\\\\\\\\\\\\\\\\\\\\\\\\\\\\\\\\\\\\\\\\\\\\\\\\\\\\\\\\\\\\\\\\\\\\\\\\\\\\\\\\\\\\\\\\\\\\\\\\\\\\\\\\\\\\\\\\\\\\\\\\\\\\\\\\\\\\\\\\\\\\\\\\\\\\\\\3.
::3. h(x) =cos( 12x)+24.
::4. k(x) @ @ @%2sin @( 34x)+15.
::5. j(x)=4cos(3x)-1Graph each of the following functions.
::绘制下列函数的每一个图。6.
::6. f(x) = 3sin( 2x)+17.
::7. g(x)=2.5cos(xx)-48.
::8. h(x) sin (4x)- 39.
::9. k( x) = 12cos( 2x)10.
::10. j(x)_____________________________________________________________________________________________________________________________________________________________________________________________________________________________________________________________________________________________________________________________________________________________________________________________________________________________________________________________________________________________________________________________________________________________________________________________________Create an algebraic model for each of the following graphs.
::为下图创建代数模型。
11.12.
13.
14. At time 0 it is high tide and the water at a certain location is 10 feet high. At low tide 6 hours later, the water is 2 feet high. Given that tides can be modeled by sinusoidal functions, find a graph that models this scenario.
::14. 时间0是高潮,某一地点的水位为10英尺高,6小时后低潮时水位为2英尺高,鉴于潮位可以用正弦形功能模拟,请找到一个图来模拟这一情景。15. Find the equation that models the scenario in the previous problem.
::15. 找出在前一个问题中模拟设想情景的方程式。Review (Answers)
::回顾(答复)Click to see the answer key or go to the Table of Contents and click on the Answer Key under the 'Other Versions' option.
::单击可查看答题键, 或转到目录中, 单击“ 其他版本” 选项下的答题键 。 -
For the general form of the sinusoidal function
the coefficient
represents the horizontal stretch.