15.8 以倒退模式建模
章节大纲
-
Linear correlation is the simplest type of relationship between two variables. Your calculator has the power to use a variety of different to find other relationships and create many different types of models. How do you choose which function family is best for a given situation?
::线性关系是两个变量之间最简单的关系类型。您的计算器有能力使用各种不同关系来寻找其他关系并创建多种不同类型的模型。您如何选择哪个函数族最适合特定情况?Modeling with Regression
::以回归模式建模Once you understand how to do linear regression with your calculator, you already know the technical mechanics to perform other regressions in the [STAT] [CALC] menu. The most common regressions correspond to the function families.
::一旦您了解如何使用计算器进行线性回归, 您就已经知道在 [STAT][ CALC] 菜单中进行其他回归的技术机械。 最常见的回归与函数序列相对应 。-
QuadReg - Quadratic function family
::QuadReg - QuadReg - Quadrat 函数族 -
CubicReg - Cubic function family
::CuccReg - Cucc 函数家族 -
QuarticReg - Quartic function family or 4
th
degree polynomial
::倾角区域 - 倾角函数家庭或四度多元度 -
LnReg - Natural Log function family
::LnReg - 自然日志函数家族 -
ExpReg - Exponential function family
::ExpleReg - 指数函数家族 -
PwrReg - Power function family
::PwrReg - 电力功能家庭 -
Logistic - Logistic function family
::后勤 -- -- 后勤职能家庭 -
SinReg - Sinusoidal function family.
::SinReg - Sinusoidal 功能家庭。
When you perform these types of regressions, it will be incredibly important for you to interpret and explain parts of the graph. Here are some points to keep in mind:
::当您进行这些类型的回归时, 解释和解释图中的某些部分非常重要。 这里需要记住一些要点 :-
The
-intercept may have a particular meaning that may or may not be reasonable.
::y 界面可能有特定的含义,可能合理,也可能不合理。 -
When you use your model to make predictions it is important for you to remember the relevant domain of your model. If your
data
is about elementary school students then it might extend to middle and high school students, but it might not.
::当您使用您的模型进行预测时, 您必须记住您的模型的相关领域。 如果您的数据是关于小学生的, 那么它可能会扩大到中、中学生, 但可能不会。 -
The calculator may produce a
correlation coefficient
for each of these non-linear regressions, but you should be very careful. Technically, the correlation coefficient is only supposed to be calculated with linear regression, so the calculator is doing some fancy linearization to produce it. You can learn more about this process in future
statistics
courses.
::计算器可能会为这些非线性回归产生一个相关系数,但您应该非常小心。 从技术上讲,相关系数只应该用线性回归来计算,因此计算器正在做一些花哨的线性化来生成。你可以在未来的统计课程中更多地了解这一过程。
In general, at this point you should use your best judgment when choosing a function family to model a given set of data and deciding how good a fit the model is based on context.
::一般而言,此时此刻,在选择一个功能家庭来模拟特定数据集和决定该模型根据上下文是否适合时,你应使用最佳判断力。Take the following data about SAT scores and number of hours slept the night before.
::以下数据显示沙特德士古卫星的分数和前一天晚上睡觉的时数。# Hours Slept SAT Score 8.5 1840 10.9 1510 9.1 1900 7.5 2070 7.2 1550 6.0 1720 2.3 840 5.5 1230 Let be the number of hours slept and be the SAT score.
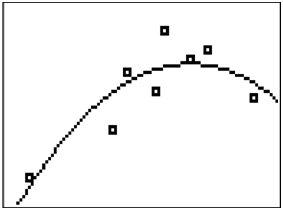
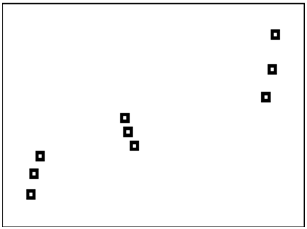
::让x是睡觉时数,y是SAT得分。After plotting the points, you should choose a function family to use as a model. In this case, it would be appropriate to try a quadratic relationship.
::绘制点数后, 您应该选择一个函数家庭作为模型使用。 在这种情况下, 应该尝试二次关系 。A quadratic model makes sense because there seems to be a peak in the model and in the data around 8.5 hours of sleep. It makes sense that someone who does not get enough sleep will do worse and someone who gets too much sleep might also do worse.
::二次模型是有道理的,因为模型和数据在8.5小时的睡眠前后似乎都有一个峰值。 睡眠不足的人会做更糟糕的事情,睡眠过多的人也会做更糟糕的事情。From the regression model, we can answer the following questions:
::从回归模型中,我们可以回答下列问题:-
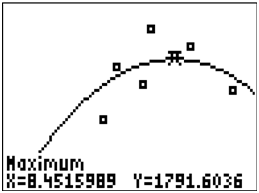
What is the perfect amount of sleep to get before the SATs?
-
Use the calculator to find the maximum of the parabola. The coordinate represents the “perfect” amount of sleep.
::使用计算器找到最大值的抛物线。 x 坐标表示睡眠的“ 完美” 量 。
::使用计算器找到最大值的抛物线。 x 坐标表示睡眠的“ 完美” 量 。
::在SATs之前,最理想的睡眠量是多少?使用计算器找到最大抛物线。x坐标代表“完美”的睡眠量。 -
-
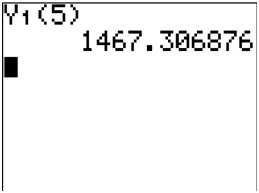
Calculate the score you are predicted to get if you get 5 hours of sleep.
-
You can substitute into the equation, or you can let the function you created and stored in simply act on the 5.
::您可以将 x=5 替换为方程式, 或者让您创建并存储在 y1 中的函数在 5 上运行 。
::您可以将 x=5 替换为方程式, 或者让您创建并存储在 y1 中的函数在 5 上运行 。
::计算在睡眠5小时后预计得到的分数。 您可以在方程中替换 x=5, 或者您可以让您创建和存储在 y1 中的函数在 5 上运行 。 -
-
What is the relevant domain of the model?
-
The relevant domain is between about 2 hours and 10 hours of sleep. Beyond those numbers of sleep, the model will probably not make a whole lot of sense. How could someone get negative hours of sleep?
::相关领域是在大约2小时到10小时的睡眠之间。 除了这些睡眠数量之外,模型可能不会说得通。 怎么会有人得到消极的睡眠时间呢?
::模型的相关领域是什么? 相关领域在大约2小时到10小时的睡眠之间。 除了这些睡眠数量之外,模型可能没有太多意义。 一个人如何得到消极的睡眠时间? -
The relevant domain is between about 2 hours and 10 hours of sleep. Beyond those numbers of sleep, the model will probably not make a whole lot of sense. How could someone get negative hours of sleep?
-
The
average
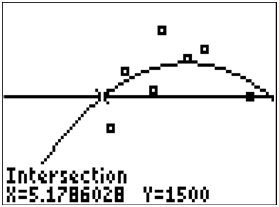
SAT score is about 1500. According to the model, what amount of sleep predicts this score? Does this number represent the average number of hours that people sleep before the SATs?
-
You can substitute into the equation and solve for using the quadratic formula, or you can graph the line and use the calculator to produce the two intersecting points.
::您可以使用四方形公式将 y1500 替换为方程, 并用 x 解析, 或者您可以绘制线线y=1500 , 并使用计算器生成两个交叉点 。5.1786 hours and 11.7246 hours are the number hours of sleep that predict a score of 1500.
::5.1786小时和11.7246小时是睡觉时数,预计得分为15点。When using the model in this direction, the results do not make as much sense and you need to be extremely careful about what you say.
::将模型用于这一方向时,结果没有那么合理,你必须非常小心你说的话。
::您可以用四方形公式将 y1500 替换为方程和解答 x, 或者您可以绘制y=1500 的线条, 并使用计算器生成两个交叉点。 5. 1786 小时和 11. 7246 小时是预测1500分的睡眠时数。 在使用模型朝这个方向前进时,结果不那么合理, 您需要非常谨慎地对待您所说的话 。
::平均 SAT 得分约为 1500 。 根据模型, 平均 SAT 得分是多少睡眠来预测这个得分 ? 这个数字是否代表人们在SAT 之前平均睡觉的小时数 ? 您可以将 y 1500 替换成方程, 用四方形公式解析 x , 或者用 y= 1500 来绘制线, 并使用计算器来生成两个交叉点 。 5. 1786 小时和 11. 7246 小时是预测 1500 得分的睡眠数小时数 。 如果使用这个模型, 结果是不那么合理 , 您需要非常小心地对待您所说的话 。 -
-
Compare the actual and predicted score for someone with 6 hours of sleep.
-
The actual score for someone who got 6 hours of sleep can be found in the original data to be 1720. The model predicts 1627.9970. The difference between the model and what actually happened is
::在原始数据中,睡了6小时的人的实际得分为1720。模型预测为1627.9970。模型与实际发生的情况之间的差别是1720-1627.9970=92.0030。
::对比实际和预测得分 6 小时睡眠的人。 6 小时睡眠的人的实际得分可以在原始数据中找到 1720。 模型预测 1627. 9970。 模型与实际发生的情况的区别是 1720 - 1627. 9970=92. 0030。 -
The actual score for someone who got 6 hours of sleep can be found in the original data to be 1720. The model predicts 1627.9970. The difference between the model and what actually happened is
Examples
::实例Example 1
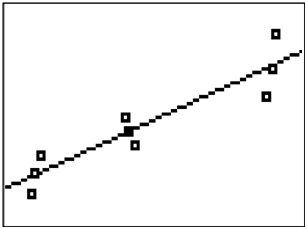
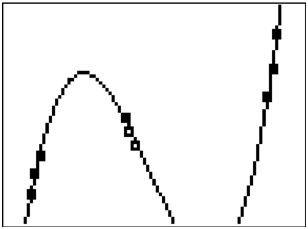
::例1Earlier, you were asked how to decide which function family to use for the a given situation. For some data sets it is possible to use a polynomial or other complicated shape to exactly intersect every data point. The downside is that the model will miss the overall relationship. Consider the following data and modeling a linear relationship or cubic relationship.
::早些时候, 有人询问您如何决定在给定情况下要使用哪种函数家庭。 对于某些数据集, 有可能使用多面形或其他复杂形状将每个数据点完全交叉。 其下端是模型会错失整体关系。 考虑以下数据并建模线性关系或立方关系 。The linear relationship describes the upward positive relationship in the data very well, but some points are slightly off of the line. The cubic relationship is much more accurate at the specific data points; however, there are features of the cubic relationship that differ significantly from reality when interpreted in context. In order to choose the best regression model you need to use context clues and the reasonableness of the various features of the model that fit each situation.
::线性关系很好地描述了数据中向上正关系, 但有些点略微偏离线条。 在具体的数据点, 立方关系要准确得多; 但是, 在上下文解释时, 立方关系的一些特征与现实有很大不同 。 为了选择最佳回归模型, 您需要使用上下文线索和适合每个情况的模型的各种特征的合理性 。Example 2
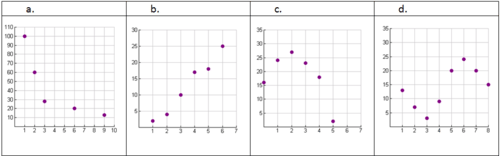
::例2Use your knowledge of function families to predict the best model for each of the following scatterplots.
::使用您对功能家庭的知识来预测以下每个散点的最佳模型。Example 3
::例3The following data represents the height of an elephant over time. Determine the best regression function to use and determine its equation.
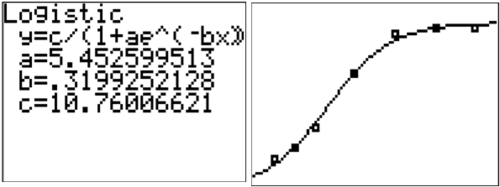
::以下数据代表大象随时间推移的高度。 确定使用和决定其方程的最佳回归函数 。Age(Years) Height (ft) 0 2 2 2.8 4 4 8 7.5 12 10 16 10.4 20 10.45 Logistic is the best function family because it levels off over time indicating that the elephant ceases to grow once it matures.
::后勤是最佳功能家庭,因为它随着时间的流逝而稳定,表明大象一旦成熟就停止生长。
::y10.76011+5.4526-e-0.3199xExample 4
::例4The following data represents the speed that Ben can kick a soccer ball at different ages. Determine the best regression function to use and determine its equation.
::以下数据代表Ben在不同年龄踢足球的速度。 确定使用和决定其方程的最佳回归函数 。Age(Years) Speed (mph) 4 15 10 32 20 65 30 70 50 45 60 35 The best regression to use is a quadratic relationship because when Ben is little he cannot kick the ball very fast and when he is old he also cannot kick the ball very fast. Ben can kick the ball the fastest when he is an adult between the ages of 20 and 40.
::最好的退步是二次关系,因为当本小的时候,他不能非常快地踢球,当他年老的时候,他也不能非常快地踢球。 当Ben是20至40岁的成年人时,他可以最快地踢球。
::y 0.05981x2+4.0679x+0.6191Example 5
::例5What are two weaknesses and two strengths of the model used to predict Ben’s kicking speed from Example 4.
::用来预测Ben从例4中加速速度的模式有两个弱点和两个长处。One strength is that a quadratic model correctly describes the peak of kicking speed occurring in the middle of Ben’s life. A linear regression might forecast Ben’s kicking speed increasing forever and a logistic regression might forecast Ben’s kicking speed always staying fast despite his old age. A second strength of the model could be the -intercept of 0.6191. Even though this number is not really in the relevant domain, it implies that as a newborn baby Ben could kick the ball very slowly which is arguably true.
::其中一个强点是四方模型正确地描述了本人生中叶的踢速峰值。 线性回归可能预示本的踢速将永远加速,而后勤回归则可能预示本的踢速将随年老保持快速。 模型的第二个强点可能是0.61191的Y拦截,尽管这个数字并不在相关领域,但它意味着作为新生婴儿本可以非常缓慢地踢球,这可以说是真实的。One weakness of the model is that it predicts that Ben will kick the ball at 0 miles per hour at age 68.1660. This implies that Ben will not be able to kick the ball at all which isn’t necessarily true.
::模型的一个弱点是它预测Ben在68.1660岁时每小时以0英里的速度踢球。 这意味着Ben根本无法踢球,而这不一定是真的。A second weakness of the model is that it predicts negative speed at either age extreme which doesn’t make sense. A better model would be flat at 0 when Ben is born and also at the end of Ben’s life when he is no longer able to kick the ball.
::模型的第二个弱点是它预测了两个极端的负速,两个极端的负速都是不合情理的。 更好的模型在Ben出生时为零,在Ben无法再踢球时为零,在Ben生命的末日为零,在Ben再也不能踢球时为零。Summary -
Linear correlation is the simplest relationship between two variables, and calculators can perform various regressions to find relationships and create models.
::线性相关性是两个变量之间最简单的关系,计算器可以进行各种回归,以寻找关系并创建模型。 -
When interpreting regression models, consider the meaning of the intercept, the relevant domain of the model, and be cautious with correlation coefficients for non-linear regressions.
::在解释回归模型时,考虑拦截的含义、模型的相关领域,并谨慎对待非线性回归的相关系数。 -
Choosing the appropriate function family for a given set of data is crucial for creating accurate models.
::选择一个特定数据集的适当功能家庭对于建立准确模型至关重要。 -
Regression models can be used to answer questions, make predictions, and compare actual and predicted values, but it is important to consider the context and limitations of the model.
::倒退模型可用于回答问题,作出预测,比较实际和预测值,但必须考虑模型的背景和局限性。
Review
::回顾The table below shows the average height of an American female by age.
::下表显示按年龄分列的美国女性的平均身高。Age (Years) Height (inches) 2 34 8 50 11 57 15 63 23 64 35 64 1. Determine two different equations that model the height over time using two different function families.
::1. 确定两个不同的方程式,用两个不同的函数序列来模拟时间的高度。2. Which function is a better fit for this data? Why?
::2. 哪种功能更适合这一数据?为什么?3. Use both equations to predict the -intercepts. What does the -intercept represent in each case? Are your predictions reasonable for this part of the graph?
::3. 使用两个方程来预测y-截面。Y-截面在每个情况中代表什么?对图的这一部分,你的预测是否合理?4. Use your “better fit” equation to predict the height of a 70 year-old woman. Is your prediction reasonable for this part of the graph? Why or why not? What do you really need your model to do for the domain [16,100]?
::4. 使用“更合适”的方程式预测70岁妇女身高是否高,对图这一部分的预测是否合理?为什么或为什么不?你真正需要你的模型来为域名做什么[16,100]?Alice is in Wonderland and drinks a potion that approximately halves her height for each sip she takes, as shown in the table below.
::爱丽丝在神奇之地 喝着一种药水 大约将她每次喝的一小口的身高 减半 如下表所示# of sips Height (inches) 0 60 1 29 2 16 3 8 4 4.1 5. Do an exponential regression to determine an appropriate model. What is the equation?
::5. 进行指数回归以确定适当的模型。公式是什么?6. Explain why exponential regression is a good choice in this case.
::6. 解释为何指数回归在此情况下是一个好选择。7. How many sips did she take if she is 2 inches tall?
::7. 如果她两英寸高,她喝了多少口?8. How tall will she be if she has 6 sips?
::八、她喝六口她会有多高?A rumor is spreading around your 400 person school. The following table shows the number of people who know the rumor each day.
::下面的表格显示每天了解谣言的人数。Day # of people who know the rumor 1 2 2 8 3 29 5 161 6 372 7 378 8 391 9. Use logistic regression to determine an equation that models the number of people who know the rumor over time.
::9. 利用后勤回归来确定一个等式,该等式以随着时间的推移了解谣言的人数为模型。10. Why is the logistic model appropriate in this case?
::10. 为什么后勤模式适合本案?11. Use your regression equation to predict the time when only one person knew the rumor. Does this make sense?
::11. 利用你的回归方程预测只有一个人知道谣言的时间,这是否合理?The data table below represents how the tide changes the depth of the ocean water at a beach. At a certain place in the water, a scientist measures the depth of the water for ten consecutive hours.
::以下数据表显示了潮汐如何改变海滩海水的深度。在水中某个地方,科学家连续10小时测量水的深度。Hours Depth of Ocean Water (ft) 0 9 1 11.2 2 12.4 3 12.9 4 12.5 5 11 6 8.9 7 7 8 5.5 9 4.9 10 5.4 12. Choose the function family that is the best model for this situation and determine the regression equation.
::12. 选择为这种情况的最佳模式的功能家庭并确定回归方程。13. Use your regression equation to predict the depth of the water at 10 hours. What is the difference between the actual depth from the data and the predicted depth from your equation (residual)?
::13. 利用你的回归方程在10小时时预测水的深度,从数据的实际深度与从你的方程(残余)预测的深度之间有何区别?14. Do a cubic regression on the calculator. What is the cubic regression equation? Is this a better or worse model than the model you originally chose?
::14. 计算器上是否有立方回归?立方回归方程是什么?这是比您最初选择的模型更好还是更差的模型?15. Why might statisticians do modeling with regression for their data?
::15. 统计人员为何要用回归模型模拟其数据?Review (Answers)
::回顾(答复)Click to see the answer key or go to the Table of Contents and click on the Answer Key under the 'Other Versions' option.
::单击可查看答题键, 或转到目录中, 单击“ 其他版本” 选项下的答题键 。 -
QuadReg - Quadratic function family