9.9 速度与时间图
章节大纲
-
The sprinter in this image is just taking off from the starting blocks to run a short race down a straight track. She starts in a burst of and will pick up even more speed during the first few seconds of the race. She’ll keep running at top speed until she crosses the finish line. Only then will she slow down. is a measure of both speed and direction of motion. A change in velocity is called . In the case of the sprinter, she accelerates as she runs down the track because her speed changes even though her direction stays the same.
::此图像中的短跑步器只是从起始区开始, 短跑一个直径。 她从一个爆裂开始, 在比赛的头几秒钟里会加快速度。 她会一直以最高速度运行, 直到她跨过终点线。 只有这样, 她才会放慢速度。 这是运动速度和方向的量度。 速度的变化被称为“ 短跑 ” 。 在短跑中, 她会加速速度, 因为她的速度会变化, 尽管她的方向保持不变 。Plotting Velocity Against Time
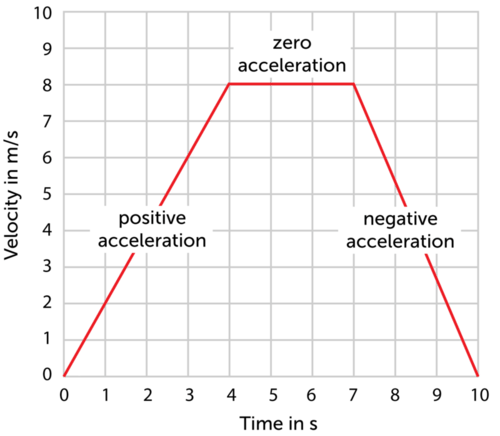
::及时预测速度The changing velocity of the sprinter—or any other moving person or object—can be represented by a velocity-time graph like the one in the Figure for the sprinter. A velocity-time graph shows how velocity changes over time. The sprinter’s velocity increases for the first 4 seconds of the race, remains constant for the next 3 seconds, and decreases during the last 3 seconds after she crosses the finish line.
::冲刺者(或任何其他移动的人或物体)的变化速度可以用像冲刺者图中那样的速时图表示。 速时图显示了时间变化的速度。 冲刺者在比赛头4秒中的速度增长,在接下来3秒中保持恒定,在她越过终点线后最后3秒中下降。Acceleration and Slope
::加速和缩放In a velocity-time graph, acceleration is represented by the slope, or steepness, of the graph line. If the line slopes upward, like the line between 0 and 4 seconds in the Figure , velocity is increasing, so acceleration is positive. If the line is horizontal, as it is between 4 and 7 seconds, velocity is constant and acceleration is zero. If the line slopes downward, like the line between 7 and 10 seconds, velocity is decreasing, and acceleration is negative. Negative acceleration is called deceleration.
::在速度图中,加速度以图形线的斜度或斜度表示。如果线的斜度向上,如图中的0至4秒的线,速度正在上升,加速度是正数。如果线是水平的,则速度是4至7秒的,速度是恒定的,加速度是零。如果线向下,如7至10秒的线,速度正在下降,加速度是负数。负加速度被称为减速。Q: Assume that another sprinter is running the same race. The other runner reaches a top velocity of 9 m/s by 4 seconds after the start of the race. How would the first 4 seconds of the velocity-time graph for this runner be different from the Figure ?
::问题:假设另一个短跑者在同样的赛跑中运行。其他跑者在比赛开始后达到最高速度9米/秒乘以4秒。该跑者速度图的前4秒与图有什么不同?A: The graph line for this runner during seconds 0–4 would be steeper (have a greater slope). This would show that the other sprinter's acceleration is greater during this time period.
::A : 0 - 4 秒中此运行的图形线将更陡峭( 具有更大的斜度 ) 。 这将显示此时段中另一个短径的加速度更大 。Use the following PLIX Interactive to predict what the velocity-time graphs will look like for three baseballs accelerating at different rates:
::使用以下的 PLIX 互动 来预测三个加速速度不同的棒球 速度图将是什么样子 :Summary
::摘要-
A velocity-time graph shows changes in the velocity of a moving object over time.
::速度图显示移动对象随时间变化的速度。 -
The slope of a velocity-time graph represents the acceleration of the moving object.
::速度图的斜度代表移动对象的加速度。
Review
::回顾-
Describe a velocity-time graph. What does the slope of the graph line represent?
::描述速度图。 图形线的斜度代表什么? -
In the
Figure
, the sprinter reaches a velocity of 2 m/s in just 1 second. At a constant rate of acceleration, how long does it take for her to double this velocity? What is her acceleration during this time period?
::在图中,短径在一秒内达到2米/秒的速度。在恒定加速度下,她需要多长时间才能使速度翻倍?在这一时期,她的加速度是多少? -
Create a velocity-time graph by plotting the data in the
Table
.
::通过绘制表格中的数据来创建速度图 。
Velocity (m/s) Time (s) 10 1 30 2 50 3 40 4 40 5 -
A velocity-time graph shows changes in the velocity of a moving object over time.