11.16天气图
Section outline
-
Lesson
::经验教训What can a weather map tell you about the weather?
::天气图能告诉你什么天气?A lot! A map indicates all sorts of things to let you know the forecast. It also may have some cute graphics associated with it.
::很多! 地图显示各种事情, 让你知道预报。 地图还可能包含一些可爱的图形 。Weather Maps
::气象图You may have seen weather maps like the one pictured below ( Figure ). A weather map shows conditions for a certain area. The may show the actual weather on a given day . It may show the predicted weather for some time in the future. Some weather maps show many weather conditions. Others show a single condition.
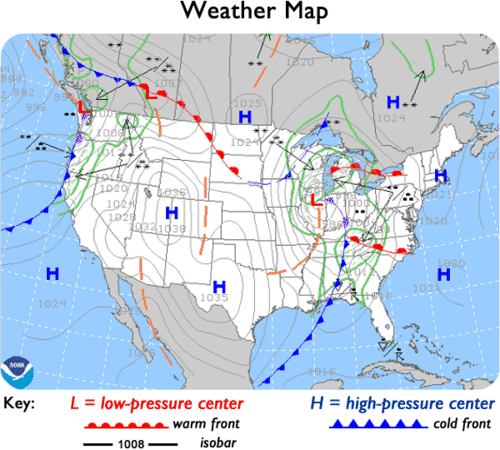
::天气图显示某一区域的条件。 天气图显示某一天的实际天气。 它可能显示未来一段时间的预测天气。 有些天气图显示许多天气条件。 另一些则显示一个单一的条件 。This weather map shows air pressure contours. Which state has the lowest air pressure shown on the map? Air Pressure Maps
::空气压力图The weather map pictured below ( Figure ) shows air pressure . The lines on the map connect places that have the same air pressure. Air pressure is measured in a unit called the millibar. Isobars are the lines that connect the points with the same air pressure. The map also shows low- and high-pressure centers and . Find the cold front on the map. This cold front is likely to move toward the northeast over the next couple of days. How could you use this information to predict what the weather will be on the East Coast?
::绘制在下面的天气图( 图) 显示气压 。 地图上的线条连接有相同气压的地方 。 气压在一个叫做毫巴的单位中测量 。 Isobars 是连接点的线条 。 地图还显示低和高压力中心 。 地图上找到冷面 。 这个冷面可能会在未来几天内向东北移动 。 您如何使用这些信息预测东海岸的天气 ?Other Weather Maps
::其他天气图Instead of air pressure, weather maps may show other weather conditions. For example, a map might show the high and low temperatures of major cities. The map may have isotherms , lines that connect places with the same temperature.
::气象地图可以显示其他天气条件,而不是空气压力。例如,气象地图可以显示大城市的高温和低温。地图可能含有同温连接地点的恒温线。Summary
::摘要- Weather maps graphically depict weather conditions.
::气象地图以图形方式描绘天气状况。
- Isobars are lines of constant pressure.
::Isobars是恒定压力的线条。
- Isobars indicate pressure cells.
::Isobars表示压力细胞。
Review
::回顾- What are the gray lines on the weather map pictured above?
::上面绘制的天气图上的灰色线是什么?
- How are high- and low-pressure centers indicated on a weather map?
::天气图上如何显示高压和低压中心?
- What do the blue and red hatched lines indicate on the map?
::地图上的蓝色和红形线表示什么?
Explore More
::探索更多Use the resources below to answer the questions that follow.
::利用以下资源回答以下问题。- What do weather maps on television usually tell you?
::电视上的天气地图通常告诉你什么?
- What type of weather is associated with high pressure air masses?
::高压空气质量与哪一种天气相关联?
- How do meteorologists determine if the boundary between two air masses is a cold front or a warm front?
::气象学家如何确定两个空气质量之间的边界是冷战线还是温暖战线?
- Why do high-altitude clouds tend to appear before a warm front arrives in a region?
::为什么高空云在温暖的战线到达一个区域之前会出现呢?
- Does rain occur most often in warm air masses, cold air masses, or at warm fronts where the two meet and interact?
::降雨是否最常发生在暖气、冷气、暖气、交汇和互动的温暖前线?
- Weather maps graphically depict weather conditions.