3.8 通过绘制数值表绘制线条图
章节大纲
-
Taxi fares usually cost more the further you travel, and they charge a set fee on top of the per-mile charge. Consider if a taxi charges $3 as a set fee and $0.80 per mile traveled. We can create a picture of all the possible solutions to the equation that models this situation, that is, the possible combinations of distances traveled and charges, by graphing . In this section, we cover how to graph a line by creating a table of values.
Graphing Lines by Making a Table of Values
::通过绘制数值表绘制线条Graphs are pictures of all the solutions to an equation. In this section, our approach to create a graph will be to find three solutions to an equation, or points on the line. While two points determine a line, when graphing by hand three points will make the graph more accurate. Let's see how to make a table of values below.Example 1
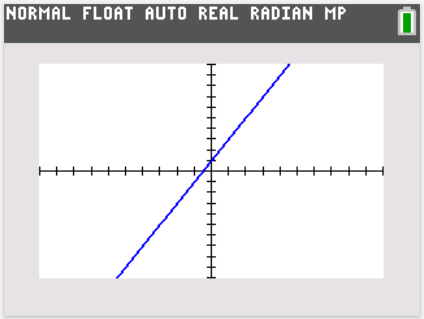
::例1Graph .
::图y=3x+1。Solution: To create a table of values, let's choose three x- values, say . Then, we input each one of these values into the equation to find the corresponding y- value that makes the equation true.
::解答: 要创建数值表, 我们选择三个 x 值, 比如 x\\\\\\\\\\\\\\\\\\\\\2 。 然后, 我们将这些数值中的每一个输入方程式, 以找到相应的 Y 值, 使方程式成为真实 。
::xy-1y=3 (-1)+1=3+1=3+1=20 能够从方程式中识别 。 这是 y- 界面 。 y= 1 y= 1 或 y= 3 (0)+1= 12y=3 (2)+1=6+1=7This give us three points on the line: (-1,-2), (0,1), and (2,7). Plot these three points and draw a line through them to complete your graph.
::这让我们在线上分三点一至二,0至1)和(2至7),绘制这三个点,并通过它们绘制一条线来完成你的图表。
Also, when graphing by hand, make sure to label your axes and indicate how many units are on each axes. When drawing the line, indicate it continues in each direction forever by putting arrows at the end of the line.Example 2
::例2Graph .
::图y=12x-3。Solution: When the is a fraction , it is helpful to pick numbers that the denominator of the slope divides into evenly, that is, multiples of the denominator. Since the denominator is 2, let's choose .
::解答 : 当分数为分数时, 选取数字是有用的, 因为斜坡的分母会平均分隔为分母的倍数。 因为分母是 2, 让我们选择 x+4, 0, 4 。
::xy-4y=12(-4)-3=-2-3=-50y-截取,y=-34y=12(4)--3=2-3=-1This gives us three points: (-4,-5), (0,-3), and (4,-1). Plot the points and draw a line through them.
::这给了我们三点
by Mathispower4u demonstrates how to graph a line with fractions in the equation using a table of values.
::在 Mathispower4u 中演示如何使用数值表绘制公式中带有分数的线条。Example 3
::例3Graph .
::图y-42(x+3)。Solution: Since this is in point-slope form, we can already identify one point on the line: (-3,4). Choose and to find two more.
::解决方案 : 由于这是点窗体, 我们已经可以在线上找到一个点
::xy-340y-4=-2(0+3-3)y-4=-2(3)y-4=-6y=--2y-4=-2y-4(2-1+3-3)y-4=-2(4)y-4=-8y=-4This is three points: (-3,4), (0,-2), and (1,-4). Plot the points and draw a line.
Example 4
::例4Graph .
::图3x+4y=5。Solution: Choose three x- values:
::解答: 选择三个 x 值 :
The three points are (-3,3.5), (0,1.25), and (2,-0.25). Even though some of the coordinates are fractions, they have places on the x- axis and the y- axis since they are number lines and any real number can be represented on a number line.
::xy-33(-3)+4y=5-9+4y=54y=14y=72=3.503(0)+4y=54y=5y=54=1.2523(2)+4y=56+4y=54y=-1y=14=-0.25 这三个点是(3-33.5)、0、1.25和2、0.25),即使有些坐标是分数,它们在x轴和y轴上也有位置,因为它们是数字线,任何实际数字都可以在数字线上表示。
Example 5
::例5A taxi charges $3 as a set fee and $0.80 per mile traveled. Graph the line that describes the charges for the cab by miles driven.
::出租车收费3美元,每英里0.80美元。Solution: Let's choose some distances to create a table of values.
::解决方案:让我们选择一些距离来创建值表 。
The three points are: (1,3.80), (5,7), and (10,11). Plot them and draw a line.
::距离以英里计, 以美元计, c13+0. 80=3. 8053+5(0. 80)= 7103+10(0. 80)= 11。 三个点是
by CK-12 demonstrates how to graph linear functions for applications.
::以 CK-12 显示如何为应用程序绘制线性函数图。How To Graph a Line With Desmos
::如何用 Desmos 绘制一条线1. Solve for the dependent variable , usually y , in the equation.
::1. 在方程中解决依赖变量,通常是y。2. Type in what the dependent variable is equal to and the graph should automatically generate.
If you want to zoom in or out on the graph, select the wrench icon on the upper-right hand part of the graph and change the range of the x- and y- axes.
::2. 键入依附变量与哪个变量相等,而图形应自动生成。如果想要在图形中缩放或调出,请在图形的上右手部分选择扳手图标,并更改 x 和 y 轴的范围。
How to Graph a Line With a TI-83/84
::如何用 TI-83/84 绘制一条线1. Solve for the dependent variable, usually y, in the equation.
::1. 在方程中解决依赖变量,通常是y。2. Press Y= and input the expression using X for the independent variable.
::2. 按 Y = 键并输入用于独立变量的 X 表达式。3. Press GRAPH and the graph will appear in the window.
::3. 按GRAPH键,图将显示在窗口中。If you want to zoom in or out on the graph, enter select ZOOM and choose one of the selections in the menu or select WINDOW and change the values for the - and - axes.
::如果您想要在图形上缩放或剪切,请输入选择 ZOOM,并选择菜单中的一个选择,或者选择 WINDOW,并修改 x 和 y - 轴的值。Summary
::摘要-
To graph a line by making a table of values, choose three
values, find the
values, plot the three points, and then draw a line through those points.
::通过绘制数值表绘制线条图,选择三个 x - 值,找到 y - 值,绘制三个点,然后通过这些点绘制一条线。
Review
::回顾Graph the line that represents the given table of values.
::表示给定数值表格的线条图。1.
::1. Xy-2-40-2422.
::2.xy-351-34-93.
::3. Xy-1121314.
::xy4-34044xy4-34044Graph the following lines by making a table of values.
::绘制一个数值表,以图示下行。5.
::5.y=2x+36.
::6.yx-17.
::7.y=13x+18.
::8. y+212(x+4)9.
::9. 9. 3x+6y=910.
::10. 2x-5y=10Explore More
::探索更多1. At the airport, you can change your money from dollars into euros. The service fee is $5, and for every dollar you exchange you get 0.7 euro.
::1. 在机场,你可以将钱从美元兑换成欧元,服务费为5美元,每兑换一美元,就能得到0.7欧元。a. Make a table for this scenario and plot the function on a graph.
::a. 绘制此情景的表格,并在图表中绘制函数。b. Use your graph to determine how many euros you would get if you give the exchange business $50.
::b. 使用你的图表确定如果提供交易所业务50美元,你能得到多少欧元。c. To get 35 euros, how many dollars would you have to pay?
::c. 要获得35欧元,你需要支付多少美元?2. A small business has a debt of $500,000 incurred from start-up costs. It predicts that it can pay off the debt at a rate of $85,000 per year according to the following equation governing years in business ( ) and debt measured in thousands of dollars ( ).
::2. 小企业从开办费用中产生的债务为50万美元,它预测,它能够按照以下关于营业年数(x)和以千美元计量的债务的等式,以每年85 000美元偿还债务。A table of values that represents this situation is
::代表此状况的数值表格
Graph the above equation and use your graph to predict when the debt will be fully paid.
::x0500141523333032454160 绘制上述方程图,并用您的图来预测何时将全额偿还债务。3. The recommended maximum target heart rate while you exercise can be determined by your age using the equation where is the maximum beats per minute and is your age in years. 1 Graph this equation and determine the maximum target heart rate for a person who is 35 years old.
::3. 锻炼时建议的最高目标心跳率,可使用y=0.85x+187等方程式按年龄确定,y是每分钟的最高节拍,x是年龄。 1 绘制这个方程式,并确定35岁者的最高目标心跳率。4. The price of a math textbook can be modeled by the equation: , where x is time in years and y is the price of the textbook. This equation tells us that the textbook originally cost $91 and each year the cost went up $4. Graph this equation. What does the y -intercept represent? When will the textbook be priced over $110?
::4. 数学教科书的价格可以用下列方程式建模:y=4x+91, 其中x是年中的时间,y是教科书的价格,这个方程式告诉我们,教科书最初的费用为91美元,每年的费用上涨4美元。Answers to Review and Explore More Problems
::对审查和探讨更多问题的答复Please see the Appendix.PLIX
::PLIXTry this interactive that reinforces the concepts explored in this section:
::尝试这一互动,强化本节所探讨的概念:References
::参考参考资料-
“Target Heart Rates,” last reviewed January 2015,
.
::2015年1月审查的「目标心率」。 -
“Does Elevation Affect Temperature? - OnTheSnow,” by Joel Gratz, posted August 8, 2016,
.
::2016年8月8日,
-
To graph a line by making a table of values, choose three
values, find the
values, plot the three points, and then draw a line through those points.