3.9 通过查找截取器绘制线条
章节大纲
-
A certain percentage of a drug is released in a patient's body over a period of hours. The model for this situation is 25 x + 4 y = 400 . We can use a graph to read how much of the drug has been released at a point in time. In this section, we will use important points called the x - intercept and y -intercept to graph a line like the line in this situation.

Graphing a Line by Finding the Intercepts
::通过查找截取线绘制线条Since two points determine a line, another way to find the graph of a line is to find the intercepts , the points where the graph crosses the axes. An x -i ntercept is a point where the graph crosses the x- axis; a y -in tercept is a point where the graph crosses the y- axis.Finding x - and y- intercepts
::查找 x 和 y 界面To find the x- intercept, set y = 0 .
::要找到 X 界面, 请设置 Y= 0 。To find the y- intercept, set x = 0 .
::要找到 Y 界面, 设置 x=0 。Example 1
::例1Graph 4 x − 3 y = 21 .
::图4x-3y=21。Solution: First, we find the intercepts. For the x- intercept, plug in zero for y and for the y- intercept, plug in zero for x .
::解答: 首先, 我们找到拦截器。 对于 X 拦截器, 插入为 y 插入为零, 插入为 y 拦截, 插入为 0 为 x 插入为零 。4 x − 3 ( 0 ) = 21 4 ( 0 ) − 3 y = 21 4 x = 21 − 3 y = 21 x = 21 4 or 5.25 y = − 7 x-intercept ( 5.25 , 0 ) y-intercept ( 0 , − 7 )
::4x-3(0)=214(0)-3y=214x=214x=21-3y=21x=214或5.25y*7x-截取(5.25,0)y-截取(0,-7)Now, we graph the line by plotting the intercepts and drawing a line to connect them.
::现在,我们通过绘制拦截图和绘制连接线来绘制线条。Example 2
::例2Graph 6 x + 5 y = 45 .
::图6x+5y=45。Solution: For the x- intercept, the y- value is zero. Plug in zero for y and solve for x .
::解析度 : 对于 X 界面, Y 值为 0。 y 的插件为 0 , x 的解析值为 。6 x + 5 y = 45 6 x + 5 ( 0 ) = 45 6 x = 45 x = 45 6 or 15 2
::6x+5y=456x+5(0)=456x=455x=456或152The x- intercept is ( 15 2 , 0 ) .
::X 拦截( 152, 0) 。For the y- intercept, the x- value is zero. Plug in zero for x and solve for y .
::y 界面的 X 值为 0。 x 的插件为 0 , y 的解答为 y 。6 x + 5 y = 45 6 ( 0 ) + 5 y = 45 5 y = 45 y = 9
::6x+5y=456(0)+5y=455y=455y=45y=9The y- intercept is ( 0 , 9 ) .
::Y 界面是 (0, 9) 。Now, we plot these two points and draw a line through them.
::现在,我们绘制这两点,并划出一条线通过它们。
by Mathispower4u demonstrates how to graph linear equations using the intercepts.
::由 Mathispower4u 演示如何用截取来绘制线性方程式 。Example 3
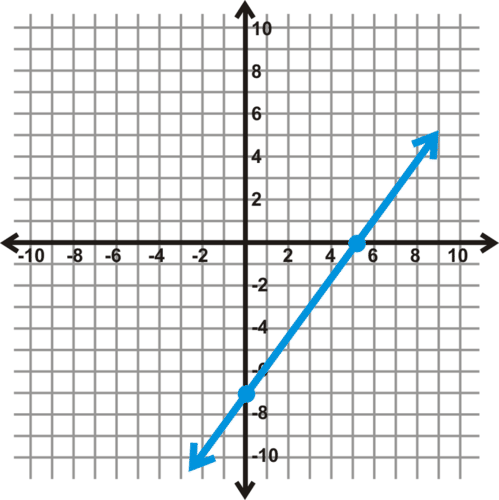
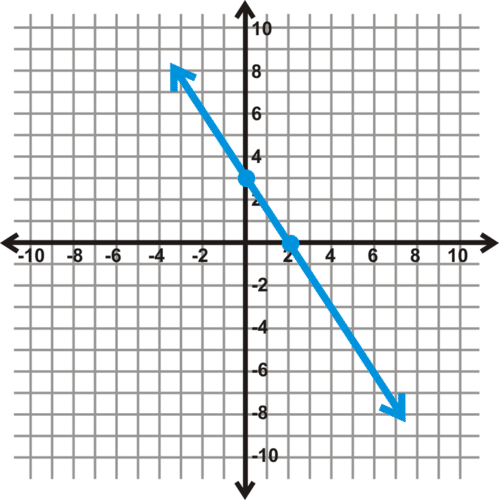
::例3Graph 3 2 x + y = 3
::图32x+y=3Solution: First, we find the intercepts.
::解决办法:首先,我们找到拦截物。3 2 x + ( 0 ) = 3 2 3 ( 3 2 x ) = 2 3 ( 3 ) x = 2 x-intercept ( 2 , 0 )
::32x+(0)=323(32x)=23(3)x=2x接口(2,0)3 2 ( 0 ) + y = 3 y = 3 y-intercept ( 0 , 3 )
::32(0)+y=3y=3y 3y 拦截 (0,3)Now, we graph the line by plotting the intercepts and drawing a line through them.
::现在,我们通过图解截击和通过它们绘制一条线来绘制线条。Example 4
::例4Graph y = 4 x .
::图y=4x。Solution: We start by finding the intercepts.
::解决方案:我们从找到拦截开始。0 = 4 x y = 4 ( 0 ) x = 0 y = 0 x-intercept ( 0 , 0 ) y-intercept ( 0 , 0 )
::0=4xy=4(0)xxx=0y=0x界面(0,0)y-界面(0,0)The intercepts are the same point, the origin. We cannot graph this line by using the intercepts because there is only one point. We will have to use another method.
::拦截是相同的点, 来源。 我们不能使用拦截来绘制此线, 因为只有一个点 。 我们必须使用另一种方法 。WARNING
::警告This method cannot be used to graph lines that go through the origin, horizontal lines, and vertical lines. Most of these lines only have one intercept (exceptions are y = 0 and x = 0 ).Example 5
::例5Graph the line 25 x + 4 y = 400 to see how much drug is in the patient's body over time.
::绘制第25x+4y=400行的图,看病人身体中一段时间内有多少药物。Solution: We find the intercepts.
::我们找到拦截者25 x + 4 ( 0 ) = 400 25 ( 0 ) + 4 y = 400 25 x = 400 4 y = 400 x = 16 y = 100 x-intercept ( 16 , 0 ) y-intercept ( 0 , 100 )
::25x+4(0)=40025(0)+4y=40025x=400004y=40025x=4004y=400x=16y=100x拦截(16,0)y-拦截(0,100)Given the information from the introduction, these values mean that at time 0, there is 100% of the drug in the patient's body, and at time 16 hours, there is 0% of the drug in the patient's body.
::根据介绍中的信息,这些值意味着,在0时,病人体内有100%的药物,在16小时时,病人体内有0%的药物。Now, plotting the points and drawing a line we can see what percentage of the drug is still in a patient's body over time.
::现在,绘制点数和绘制一条线,我们可以看到,随着时间的推移,病人体内的毒品比例是多少。
by CK-12 demonstrates how to graph equations given general form.
::通过 CK-12 演示如何图形化给定一般形式的方程式 。Summary
::摘要-
To find the
x
−
intercept, set
y
=
0
.
::要找到 x - 界面, 设置 Y= 0 。 -
To find the
y
−
intercept, set
x
=
0
.
::要找到 y - 界面, 设置 x=0 。 -
To graph a line by finding the intercepts, find the two intercepts, plot the intercepts, and draw a line through those points.
::通过找到拦截物来绘制一条线, 找到两个拦截物, 绘制拦截物图, 并绘制一条通过这些点的线。
R eview
::回顾Graph the following lines by finding the intercepts.
::通过找到拦截物来绘制下行图。1. y = x + 4
::1. y=x+42. y = 1 3 x − 1
::2.y=13x-13. y = − 2 x − 3
::3. y2x-34. y + 3 = 3 2 ( x + 4 )
::4. y+3=32(x+4)5. y − 2 = − 2 ( x + 2 )
::y- 22(x+2)6. 2 x + 3 y = 12
::6. 2x+3y=127. − 4 x + 5 y = 30
::7.-4x+5y=308. x − 2 y = 8
::8. x-2y=89. 7 x + y = − 7
::9. 7x+y+710. 6 x + 10 y = 15
::10. 6x+10y=15Explore More
::探索更多1. A company car is valued at $35,000 and will be depreciated linearly over 5 years. Graph the line that models this situation. According to your graph, what is the value of the car after 3 years? Approximately, when will the car be worth $17,500?
::1. 公司车辆价值为35 000美元,在5年内将按线性折旧,并用线性法计算这种情况的模型,根据你的图表,3年后的车辆价值是多少?大约,该车何时价值为17 500美元?2. Emma wants to invest money in two mutual funds. One fund claims to earn 4% interest and the other mutual fund claims to earn 5.5%. In total, Emma would like to earn $162.50 in interest. What do the intercepts represent? Graph the line that represents this situation.
::2. Emma希望将资金投资于两个共同基金:一个基金要求赚取4%的利息,另一个基金要求赚取5.5 %的利息;Emma希望总共赚取162.50美元的利息;拦截代表什么?by Mathispower4u explains how to write a linear equation in general form to represent an application.
::Mathispower4u 解释如何以一般形式写成直线方程式以代表应用程序。3. A drug releases linearly over time in a patient's body. If it takes 10 hours for there to be no drug left in the body, find the intercepts for a graph of hours versus percentage of the drug in the body and graph the line.
::3. 药物在患者身体中随时间线性释放,如果身体中没有毒品需要10小时,则查找截取的时数图和体内药物的百分比图,并绘制线条图。by Mathispower4u demonstrates how to make predictions using linear equations.
::Mathispower4u 演示如何使用线性方程式作出预测。4. If the weather is sunny, the temperature will decrease by 5.4ºF for every 1,000 feet increase in elevation. If the weather is cloudy, the temperature decreases by 3.3ºF for every 1,000 feet increase in elevation. 1 Write a linear equation for each weather condition and determine at which elevation the temperature will be 0ºF.
::4. 如果天气晴朗,高海拔每增加1 000英尺,温度将减少5.4oF;如果天气多云,高海拔每1 000英尺,温度将减少3.3oF。Answers to Review and Explore More Problems
::对审查和探讨更多问题的答复Please see the Appendix.
::请参看附录。PLIX
::PLIXTry this interactive that reinforces the concepts explored in this section:
::尝试这一互动,强化本节所探讨的概念:References
::参考参考资料1. “Does Elevation Affect Temperature? - OnTheSnow,” by Joel Gratz, posted August 8, 2016, .
::由Joel Gratz撰写, 2016年8月8日张贴。 -
To find the
x
−
intercept, set
y
=
0
.