3.14 绝对值函数图
Section outline
-
A passing rain shower initially brings a small amount of rain per hour and then the rain steadily increases and then decreases. We can model this with the equation . In this section, we discuss how to graph equations that involve absolute value .
Graphing Absolute Value Functions
::绝对值函数Recall that in the Solving section , we learned how to solve absolute value equations for a particular value. Now, we will take this idea one step further and graph all possible solutions for any particular value. We start with the basic function , .First, we create a table of values for and , with the x- values ranging from -3 to 3.
::首先,我们为 x 和 y 创建一个数值表,x 值从 - 3 到 3 不等。We now have 7 points. Plot each one and graph the function.
::我们现在有7个点, 绘制每个点, 绘制函数图示 。All linear absolute value functions will have this “V” shape. We will focus our attempts at graphing on finding the point where the V-shape comes together. This point is called the vertex . By finding the vertex, we will be able to make a table of values for our graphs. Let's see how this works in the next example.
::所有线性绝对值函数都将具有此“ V” 形状。 我们将集中努力绘制图表, 寻找 V 形状聚集点。 这个点被称为顶点 。 通过找到顶点, 我们就可以为图形绘制一个值表。 让我们在下一个示例中查看这个图是如何工作的 。Example 1
::例1Use a table to graph .
::使用表格绘制 yx-3。Solution: First, we need to find our vertex, so we can make a table with points that will be on both sides of the V-shape. Use the equation to help you determine which x- values to pick. Setting what is inside the absolute value equal to zero, we get that . This is the x- coordinate of the vertex. Pick three values on either side of and then graph.
::解答 : 首先, 我们需要找到我们的顶点, 这样我们可以在 V- shape 的两侧绘制一个带有点的表格。 使用方程式来帮助您确定要选择的 x 值。 设置绝对值内等于 零的值, 我们得到的是 x= 3 。 这是顶点的 X 坐标 。 在 x= 3 的两侧选择三个值, 然后图形 。0 3 1 2 2 1 3 0 4 1 5 2 6 3 Next, we plot the points and draw the graph.
::接下来,我们绘制点和图。
Notice that this graph shifts to the right 3 when compared to the graph . (We will discuss this property in the Transformations section in Chapter 5).
::请注意, 此图与 yx 相比, 向右移到右移 3 。 (我们将在第 5 章的变换部分讨论此属性 ) 。by CK-12 explains how to graph absolute value equations.
::在 CK-12 中解释如何绘制绝对值方程式 。
Example 2
::例2Use a table to graph .
::使用表格绘制 yx5。Solution: Be careful! Here, the minus 5 is not inside the absolute value. So, first take the absolute value of the x- value and then subtract 5. Treat the absolute value bars like " data-term="Parentheses" role="term" tabindex="0"> parentheses in the . To determine where to start, we set x = 0. That is the x- coordinate of the vertex. We choose three values on each side of 0.
::解决方案: 小心点! 这里, 负 5 不在绝对值之内 。 因此, 首先选择 x 值的绝对值, 然后减去 5 。 将绝对值条当做括号处理 。 要确定起始位置, 我们设置 x = 0 。 这是顶点的 x 坐标 。 我们选择 0 的每侧三个值 。Plotting the points from the table above, we get
::从上表绘制点数时,我们得到的是Here, the graph shifts down 5 when compared to the graph . (General rules will be covered in the Transformations section in Chapter 5).
::在此, 图表与 y x 等相比向下移动 5 。 (一般规则将在第 5 章的变换部分中涵盖) 。Next, we look at an equation that is a combination of the two changes in Examples 1 and 2.
::接下来,我们审视一个方程式,它结合了例1和例2中的两种变化。Example 3
::例3Use a table to graph .
::使用表格绘制 yx - 1\\\ 2 。Solution: Determine what makes the inside of the absolute value equation zero, . Then, to make a table of values, pick a couple values on either side of . Note the -1 outside the absolute value bars is multiplication by -1, so first take the absolute value (like parentheses), then multiply by -1.
::解析度: 确定绝对值方程零的内值, x=1 。 然后, 要绘制一个数值表, 请在 x=1 的两面中选择几个数值。 注意绝对值栏外的 - 1 乘以 - 1, 所以首先选择绝对值( 如括号) , 然后乘以 - 1 。-2 -1 -1 0 0 1 1 2 2 1 3 0 4 -1 Plotting the points above and connecting them in a V-shape, we have
::将上述各点绘制成V形形状,The vertex is (1, 2). Even though this graph seems upside down, it still has a V-shape, so it is a linear absolute value graph.
::顶点是(1, 2) 尽管这个图似乎颠倒了, 但它仍然有一个V形状, 所以它是一个线性绝对值图 。We can generalize the changes we have seen in the previous examples.
::我们可以概括一下我们在前几个例子中看到的变化。General Form of an Absolute Value Function
::绝对值函数的一般形式For any absolute value function, the general form is:
::对于任何绝对值函数,一般形式为:
::~ ~~~~~~~~~~~~~~~~~~~~~~~~~~~~~~~~~~~~~~~~~~~~~~~~~~~~~~~~~~~~~~~~~~~~~~~~~~~~~~~~~~~~~~~~~~~~~~~~~~~~~~~~~~~~~~~~~~~~~~~~~~~~~~~~~~~~~~~~~~~~~~~~~~~~~~~~~~~~~~~~~~~~~~~~~where controls the width of the “V” and whether the V opens upward or downward, and is the vertex.
::控制“V”的宽度,以及V向上还是向下打开,以及(h,k)为顶点。Let's see how a changes the graph.
::让我们看看如何改变图表。Example 4
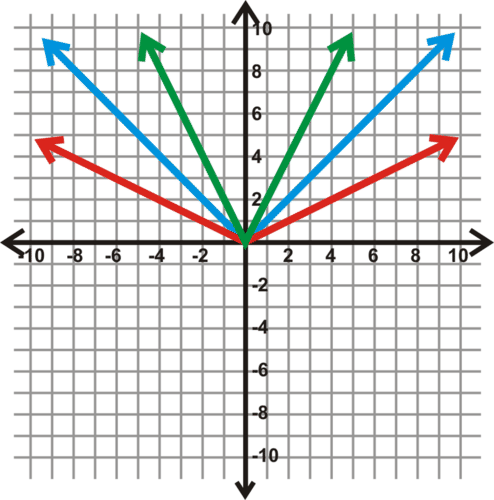
::例4Graph , , and on the same set of axes. Compare the three functions.
::相同轴组上的 yx, y=12x, y=2x。 比较三个函数 。Solution: We can make a table for all three of these functions. They all have the same x -coordinate for the vertex, , so we use the same x- values.
::解答: 我们可以为上述所有三个函数制作一个表格。 它们都有相同的顶点x坐标, x=0, 所以我们使用相同的 x 值 。Plotting these points for each graph, we have the three graphs below. The blue graph represents the function , the red graph represents the function , and the green graph represents .
::为每个图表绘制这些点, 我们有三个图。 蓝色图代表函数 yx, 红色图代表函数 y=12x, 绿图代表y=2x。The size of the opening between the two sides of an absolute value function (and other functions) is called the breadth . If is greater than 1, the graph is narrower; if is less than 1, the graph is wider.
::绝对值函数(和其他函数)两侧之间的开口大小称为宽度。如果一个大于1,则图形较小;如果一个小于1,则图形宽度更大。by Mathispower4u demonstrates how to graph an absolute value function by finding the vertex and two other points on the graph. Transformations of the absolute value function are also discussed.
::通过 Mathispower4u 演示如何通过在图形中找到顶点和另外两个点来绘制绝对值函数的图形。 也讨论了绝对值函数的转换。Summary
::摘要-
To graph absolute value functions, find the vertex, choose three
x-
values on each side of the
x-
value for the vertex, use a table of values to find the
y-
values, plot the points and connect them in a V-shape.
::要图形绝对值函数,请找到顶点,在顶点的 X 值的每侧选择三个 x 值,使用一个数值表查找 y 值,在 V 形状中绘制点并连接它们。
Review
::回顾Graph the following absolute value functions.
::如下图所示的绝对值函数。1.
::1. y=2x_______________________________________________________________________________2.
::2. y=13x________________________________________________________________________________________________________3.
::3 y3x4.
::4. yx+6______________________________________________________________________________________________________________________________________________________________________________________________________________________________________________________________5.
::5. yx-46.
::6 y x 37.
::7 yx28.
::8. yx+379.
::9. yx-1610.
::y y= 14 x - 1 2Explore More
::探索更多1. While on vacation, you go scuba diving. You start at a sea level of zero feet. You then dive to a depth of 90 feet below sea level. What is the vertex of the absolute value function that represents your possible distance from sea level after diving?
::1. 假期期间,你去潜水,从零英尺的海平面开始,然后下潜到海平面下90英尺的深处。潜入后,绝对值功能的顶部代表你可能距离海平面的距离是什么?2. Graph , and on the same set of axes. Compare the graphs.
::2. 同一组轴上的图y=14x+1和y=2x。比较图表。3. Without graphing, do you think that , , and will all produce the same graph? Why or why not?
::3. 不绘制图表,你是否认为y=2x,y2x和y2x将产生相同的图表?为什么或为什么不是?Answers for Review and Explore More Problems
::回顾和探讨更多问题的答复Please see the Appendix.
::请参看附录。PLIX
::PLIXTry this interactive that reinforces the concepts explored in this section:
::尝试这一互动,强化本节所探讨的概念: -
To graph absolute value functions, find the vertex, choose three
x-
values on each side of the
x-
value for the vertex, use a table of values to find the
y-
values, plot the points and connect them in a V-shape.