3.15 连接:绘制散射图和寻找最佳匹配线
章节大纲
-
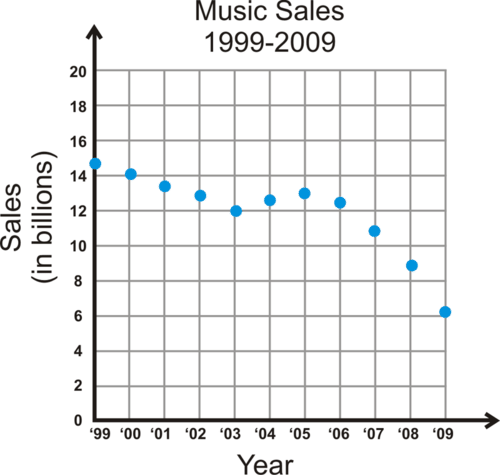
A scatterplot is a set of points that represent data. We plot these points and try to find equations that best approximate their relationship. Because data is not always perfect, not every point will always fit on the line of best fit. The line of best fit is the line that is the closest to all the data points. It can be used to approximate data within the set or beyond the set.
Scatterplots can have positive correlation if the x - and y -values tend to increase together. They can have negative correlation if the y -values tend to decrease as the x -values tend to increase. And, if the points have no sort of linear pattern, then the data would have no correlation. Think of the type of correlations referring to the slope of the line that would best fit that data.
::如果 x 值和 Y 值同时增加, 散射图则可能有正相关关系。 如果 y 值随着 x 值的增加而减少, 它们可能有负相关关系。 而且, 如果 点没有线性模式, 那么数据就不会有正相关关系 。 想想与线的斜坡最符合该数据的对应关系类型 。1. Describe the type of correlation shown in the scatterplot. 1 Explain your answer.
::1. 描述散射图1 中显示的关联类型。We can approximate the linear equation of best fit for the data set above. In statistics, you learn to do this with more accuracy. You can follow the steps below.
::我们可以比较最适合上述数据集的线性方程。 在统计中, 您可以以更准确的方式学习这样做。 您可以遵循下面的步骤 。Steps to Find a Line of Best Fit
::寻找一条最佳适用线的步骤1. Draw the scatterplot on a graph.
::1. 在图表上绘制散射图。2. Sketch the line that appears to most closely follow the data. Try to have the same number of points above and below the line.
::2. 将似乎最接近数据的线条拉开,尽量在线上和线下划出相同数目的点。3. Choose two points on the line and estimate their coordinates. These points do not have to be part of the original data set.
::3. 在线上选择两点并估计其坐标,这些点不一定是原始数据集的一部分。4. Find the equation of the line that passes through the two points from Step 3.
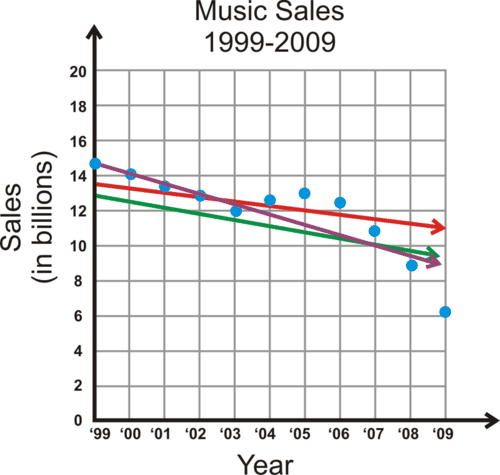
::4. 找出第3步通过两点的线的方程。Let’s use these steps on the graph above. We already have the scatterplot drawn, so let’s sketch a few lines to find the one that best fits the data.
::让我们在上面的图表上使用这些步骤。 我们已经绘制了散射图, 因此让我们绘制几行草图, 以找到最适合数据的行。From the lines in the graph, it looks like the purple line might be the best choice. The red line looks good from 2006-2009, but in the beginning, all of the data is above it. The green line is below most of the data. Only the purple line cuts through the first few data points, and then splits the data from the last few years. Remember, it is important to try to have the same number of points above and below the line.
::从图形中的线条看,紫线似乎是最好的选择。 红线从2006-2009年看起来不错, 但一开始, 所有的数据都高于它。 绿线低于大多数数据。 只有紫线通过前几个数据点进行切分, 然后将过去几年的数据分割开来。 记住, 必须在线上和线下尝试相同的点数 。Using the purple line, we need to find two points on it. The second point crosses the grid at (2000,14). Be careful! Our graph starts at 1999, so that would be considered zero. Therefore, (2000,14) is actually (1,14). The line also crosses at (2007,10), or (8,10). Now, let’s find the slope and y- intercept.
::使用紫线, 我们需要找到两点。 第二点在(2000, 14) 时跨越网格 。 注意 ! 我们的图表从1999年开始, 这样算为零 。 因此, (2000, 14) 实际上是 1, 14 。 这条线在(2007, 10) 或 ( 8, 10) 或 ( 8, 10) 时也交叉 。 现在, 让我们找到斜坡和 y 探测 。
::m=14 - 101 - 8 - 8 47
::y+47x+b14+47(1)+b14+0.57+b14.57=bThe equation of best fit is .
::最合适的方程式是y47x+14.57。However, the equation above assumes that starts with zero. In actuality, we started with 1999, so our final equation is .
::然而,上述方程式假设x开头为零。实际上,我们从1999年开始,所以我们的最后方程式是y47(x-1999)+14.57。2. Using the line of best fit above, what would you expect music sales to be in 2010?
::2. 利用以上最合适的一行,你对2010年的音乐销售有何期望?3. Now, choose two data sets from below. Draw the scatterplot, find the line of best fit and use the line of best fit to predict certain values.
::3. 现在,从下面选择两个数据集。 绘制散射图, 找到最合适的线, 并使用最合适的线来预测某些值 。Sleep Requirements, 0-3 years 2
::0-3年2Age, 1 3 6 9 12 18 24 36 Sleep, 16 15 14.25 14 13.75 13.5 13 12 The age is measured in months and sleep is measured in hours. Use the limit of the best fit to estimate the amount of sleep needed for a 2 1/2 year old and a 5 year old.
::年龄以月计,睡眠以小时计,使用最佳适量限度估计2岁半和5岁需要的睡眠量。The Price of Apple Stock from October 2009 - September 2011 3
::2009年10月至2011年9月苹果股票价格310/09 11/09 12/09 1/10 2/10 3/10 4/10 5/10 6/10 7/10 8/10 9/10 $181 $189 $198 $214 $195 $208 $236 $249 $266 $248 $261 $258 10/10 11/10 12/10 1/11 2/11 3/11 4/11 5/11 6/11 7/11 8/11 9/11 $282 $309 $316 $331 $345 $352 $344 $349 $346 $349 $389 $379 Use the limit of the best fit to e stimate the predicted price of the stock in January 2012.
::2012年1月,利用最佳适用限度估算库存的预测价格。Total Number of Home Runs Hit in Major League Baseball, 2000-2010 4
::2000-20104年主要联盟棒球击出的家庭跑总次数2000 2001 2002 2003 2004 2005 2006 2007 2008 2009 2010 5693 5458 5059 5207 5451 5017 5386 4957 4878 4655 4613 Use the limit of the best fit to e stimate how many total home runs were hit in 2011.
::利用最佳适用限度来估计2011年全垒打总数。Total Number of Home Runs Hit in Major League Baseball, 1990-2000 4
::1990-20004年主要联盟棒球击打家庭跑总次数1990 1991 1992 1993 1994 1995 1996 1997 1998 1999 2000 3317 3383 3038 4030 3306 4081 4962 4640 5064 5528 5693 Use the limit of the best fit to e stimate how many home runs were hit in 2001.
::利用最合适的限度来估计2001年有多少本垒打被击中。Temperature for Various Elevations (taken at the same time of day in roughly the same location)
::各种高地的温度(在大约同一地点的当天同时间)Elevation, ft . 0 1000 5000 10,000 15,000 20,000 30,000 Temperature , 60 56 41 27 9 -8 -40 Use the limit of the best fit to e stimate the temperature at 50,000 feet.
::使用最佳适量限度来估计50 000英尺的温度。Average Life Expectancy (in years) of the Average Male in Relation to the Year they Were Born 5
::平均男性平均预期寿命(年数)与出生年份的关系5Year of birth 1930 1940 1950 1960 1970 1980 1990 2000 2007 Life expectancy, Males 58.1 60.8 65.6 66.6 67.1 70 71.8 74.3 75.4 Use the line of best fit to p redict the life expectancy of a male born in 2016.
::使用最合适的直线预测2016年出生的男性的预期寿命。Average Life Expectancy (in years) of the Average Female in Relation to the Year they Were Born 5
::与出生年份有关的平均女性平均预期寿命(年数)5Year of birth 1930 1940 1950 1960 1970 1980 1990 2000 2007 Life expectancy, Females 61.6 65.2 71.1 73.1 74.7 77.4 78.8 79.7 80.4 Use the line of best fit to p redict the life expectancy of a female born in 2016.
::使用最合适的直线预测2016年出生的女性的预期寿命。Resources
::资源For a more accurate line of best fit, you can do what is called linear regression . by Mathispower4u describes how to do this with a graphing calculator.
::更精确的直线最合适, 您可以做所谓的线性回归。 由 Mathispower4u 描述如何用图形计算计算器来做到这一点 。References
::参考参考资料-
“Music’s Los Decade: Sales Cut in Half in 2000s,” by David Goldman, posted February 2, 2010,
.
::David Goldman在2010年2月2日发表的文章中写道: " 音乐的十年:2000年代销售量减半, " 。 -
“Baby Sleep | BabyCenter,”
.
::《婴儿睡眠》,《婴儿中心》。 -
“AAPL Historical Prices | Apple Inc. Stock - Yahoo Finance,”
::“AAPL 历史价格 苹果公司股票-雅虎金融公司”, -
“Home Runs League by League Totals on Baseball Almanac,”
.
::“本垒球全垒打全垒打全垒打联盟“。 -
“United States Life Tables, 2012,” by Elizabeth Arias, Ph.D., Melonie Heron, Ph.D., and Jiaquan Xu, M.D., Division of Vital Statistics, National Vital Statistics Reports, Volume 65, Number 8, published November 28, 2016,
.
::《2012年美国生活表》,由伊丽莎白·阿里亚斯博士、梅洛尼·赫隆博士和生命统计司许佳川博士撰写,《国家生命统计报告》,第65卷,第8号,2016年11月28日出版。
-
“Music’s Los Decade: Sales Cut in Half in 2000s,” by David Goldman, posted February 2, 2010,
.