5.6 查找和界定图表的部分
章节大纲
-
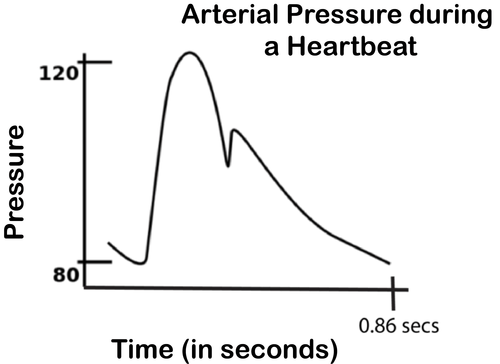
The graph below shows the arterial pressure during one heartbeat. (The closing of the aortic valve causes the notch in the curve). 1 This graph can help us answer many questions about this process. When is the arterial pressure going up? When is the arterial pressure going down? When is it at its highest point? When is it at its lowest point?
::下图显示一个心跳中的动脉压力。 (动脉阀门的关闭导致曲线中的圆点) 1 这个图可以帮助我们回答许多关于这个过程的问题。 动脉压力何时会上升? 动脉压力何时会下降? 动脉压力何时会降下? 动脉压力何时会降下? 何时会降到最高点? 何时会降到最低点?In this section, we discuss how to identify these properties of a graph.
::在本节中,我们讨论如何确定图表的这些属性。
Increasing, Decreasing, or Constant
::增长、下降或常数We can recognize trends in a graph by looking at how the y -values change as we move from left to right on the x -axis. There are three possibilities described below.
::我们可以在图表中辨别趋势,查看在X轴上从左向右移动时Y值的变化。下面说明三种可能性。Increasing, Decreasing or Constant
::增长、下降或常数As the x -values go up, that is as , the graph is:
::当 x 值上升时, 即为 x1x2, 图形为 :-
Increasing
if the
y
-values go up, that is
::如果 Y 值上升, 即 f( x1) < f( x2) , 则增加 Y 值 -
Decreasing
if the
y
-values go down, that is
::如果 Y 值下降, 即 f( x1) > f( x2) , 则衰减 -
Or,
constant
, if the
y
-values stay the same, that is
::或者, 恒定, 如果 Y 值保持不变, 那就是 f( x2) = f( x1)
Example 1
::例1Determine where the function below is increasing, decreasing, or constant.
::确定以下功能在增加、减少或常数中的位置。
Solution: We identify where the graph is increasing, decreasing, or constant by describing the intervals on the x -axis where this occurs.
::解决办法:我们通过描述X轴的间隔,确定图在增加、减少或恒定的位置。Increasing: As we move from left to right, the only section of the graph where the y -values go up is between x =2 and x =3, so this graph is increasing on .
::递增 : 当我们从左向右移动时, 图表中Y值上升的唯一部分是在 x=2 和 x=3 之间, 因此这个图表正在增长(2 3 )。Decreasing: This graph is decreasing on two intervals. The first is the left side of the graph. The arrow indicates that the graph continues forever in the left direction, so we can say that this graph is decreasing on . This graph is also decreasing on the right side of the graph, starting at x =3. The arrow on the right indicates this trend continues forever, so this graph is also decreasing on . Together, we would say this graph is decreasing on .
::递减 : 此图表以两个间距递减 。 第一个是图的左侧 。 箭头显示, 此图在左方向会一直持续, 因此我们可以说, 此图正在从 x=3 开始下降 。 此图在图的右侧也正在下降 。 右侧的箭头显示此趋势将永远持续, 因此此图也在3 。 我们共同表示, 此图在( 0 )\\\\ { ( 3 ) 上正在下降 。Constant: As we move from left to right, the y -values stay the same between x =0 and x =2. This graph is constant on .
::常数 : 当我们从左向右移动时, Y 值在 x=0 和 x=2 之间保持不变。 这个图形在( 0, 2) 上是恒定的 。Notice, the endpoints are not included in any of the intervals. Since the graph is changing at those points, they are not included in either interval.
::注意, 末点不包含在任何间隔中。 由于图表在这些点上正在变化, 末点不包含在这些间隔中 。by Randy Anderson demonstrates how to read graphs to determine the intervals where the function is increasing, decreasing, and constant.
::Randy Anderson 展示了如何阅读图表以确定函数增加、减少和恒定的间隔。Maximum and Minimum
::最大和最低In real life, it is often helpful to know when there is a maximum , or largest value, or a minimum , or smallest value. Whether you want to maximize the profit of a company or minimize the time it takes to perform a particular task, knowing the extreme values, or mathematically, the extrema , is important in many applications.
::在现实生活中,知道何时存在最大价值、最大价值、最低价值或最小价值往往是有益的。 无论是想使公司利润最大化还是想将完成特定任务所需的时间最小化,了解极端价值,还是从数学上看,极端值在许多应用中都很重要。If we consider the entire domain where a function is defined, a global or absolute maximum (plural: maxima ) refers to the point(s) with the largest y -value. The maximum is the y- value and the location where it occurs is the x- value. Similarly, a global or absolute minimum (plural: minima ) refers to the point(s) in the entire domain with the smallest y-value. Together, these two values are referred to as global or absolute extrema .
::如果我们考虑定义函数的整个域, 则全球或绝对最大值( 多元值: 最大值) 指具有最大 y 值的点。 最大值是 y 值, 发生点是 x 值。 同样, 全球或绝对最小值( 多元值: 微型值) 指整个域中最小 y 值的点。 这两个值加在一起, 被称作全球或绝对 extrema 。If we only consider one part of the domain where a function is defined, we can consider local or relative extrema . These values are the highest or the lowest y -values that the function reaches in some open interval in the domain.
::如果我们只考虑一个函数定义的域的一部分, 我们就可以考虑本地或相对的extrema。 这些值是函数在域内某个开放间隔内达到的最高或最低的 y 值 。Maximum and Minimum
::最大和最低Maximum: The value is the maximum of if for all elements of the domain of , that is, the point is the maximum if all other function values are less than or equal to .
::最大值 : f(c) f(c) f(a) 是 f(x) 所有元素的最大值 f(x) , 如果 f(c) f(a) 是 f(x) 域内所有元素的最大值 , 也就是说, 点 (c) f(c) 是 最大值 , 如果所有其他函数值小于或等于 f(c) 。Minimum: The value is the minimum value of a function if for all elements of the domain of , that is, the point is the minimum if all other function values are greater than or equal to .
::最小值:如果f(c)-f(a)对于f(x)领域的所有要素,即当所有其他函数值大于或等于f(c)时,点(c)为最小值,则f(c)值为函数的最小值。Example 2
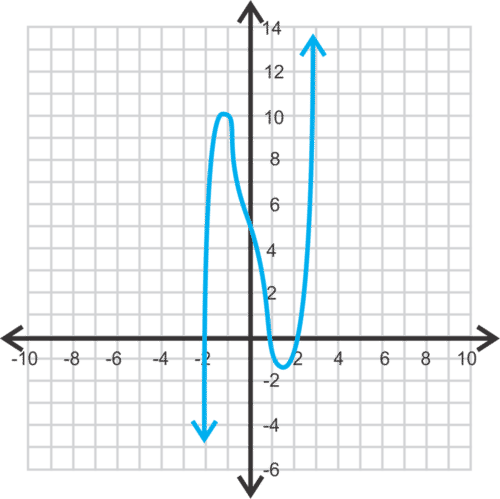
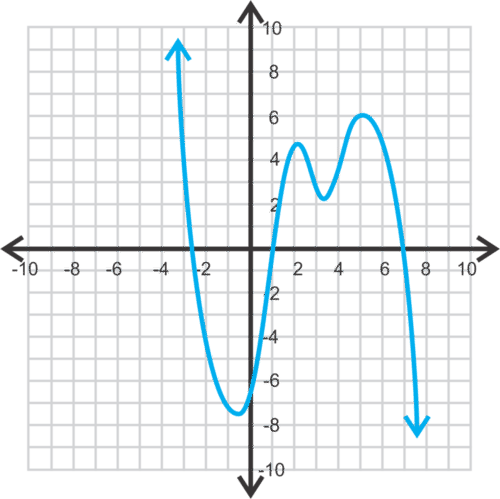
::例2Identify and categorize all extrema, both global and local, of the following graph.
::确定并分类下图的所有全球和局部外形。
Solution: Since the function appears to increase and decrease beyond the display, there are no global extrema. There is a local maximum of 1.3 at (1, 1.333) and a local minimum of 0 at approximately (3, 0).
::解答:由于该函数似乎在显示器之外增减,因此没有全球外缘,当地最大值为1.3(1,1.333),当地最低值为0(大约3,0)。Example 3
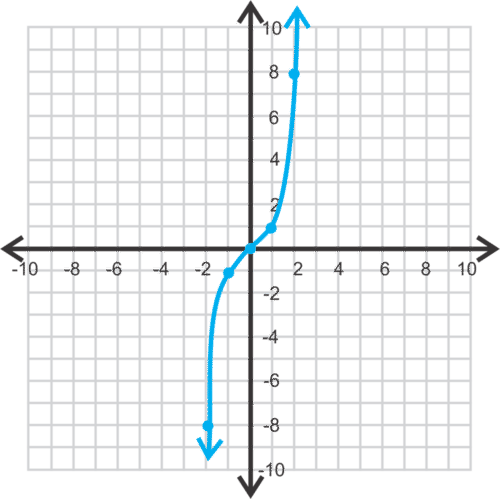
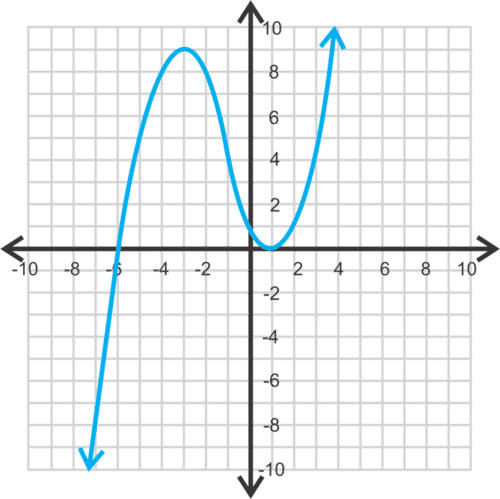
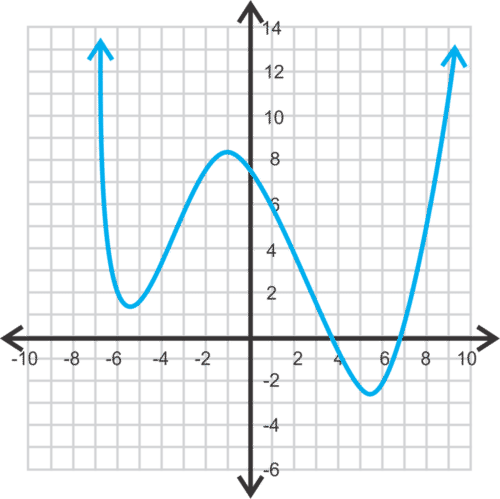
::例3Identify and categorize all extrema, both global and local, of the following graph.
::确定并分类下图的所有全球和局部外形。
Solution: The lowest point on this graph is at (1,3). It is both a global minimum and a local minimum. Since the graph continues forever upward, there is no global maximum.
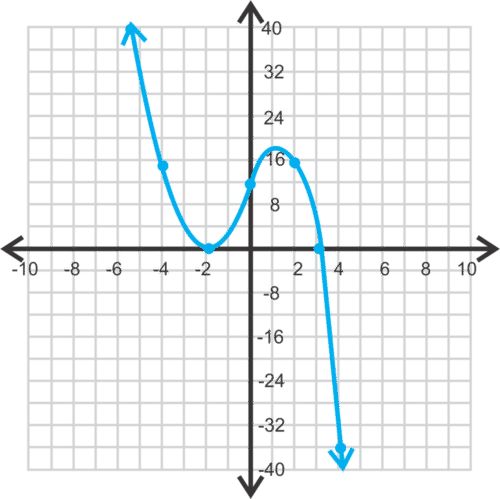
::解决方案: 本图中的最低点为(1,3) 。 它既是全球最低点,也是本地最低点。 由于该图一直向上持续,因此没有全球最高点。Example 4
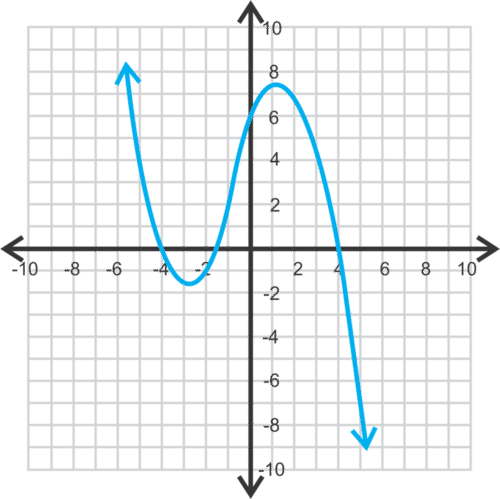
::例4Identify and categorize all extrema, both global and local, of the following graph.
::确定并分类下图的所有全球和局部外形。
Solution: There is no highest point on this graph or in an interval, so there are no global or local maxima. There is a lowest point on this graph at (-4,0). Zero is the global minimum. It is not also a local minimum because it is not contained in an open interval of the domain of the function, that is, it is an endpoint.
::解答 : 此图没有最高点, 或间隔内没有最高点, 因此没有全球或本地最高点 。 此图上有一个最低点 。 ( 4, 0) 。 零是全球最低点 。 它不是本地最低点, 因为它没有包含在函数域的开放间隔内, 也就是说, 它是一个终点 。Example 5
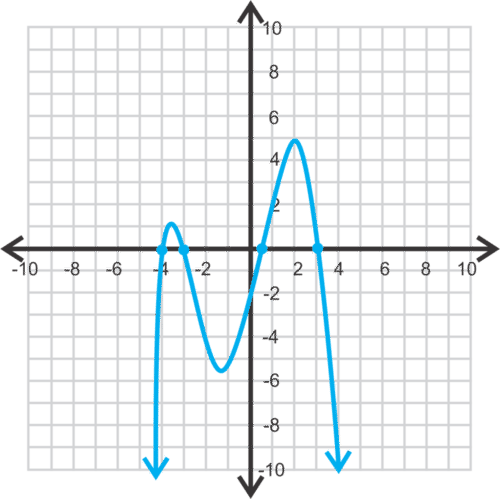
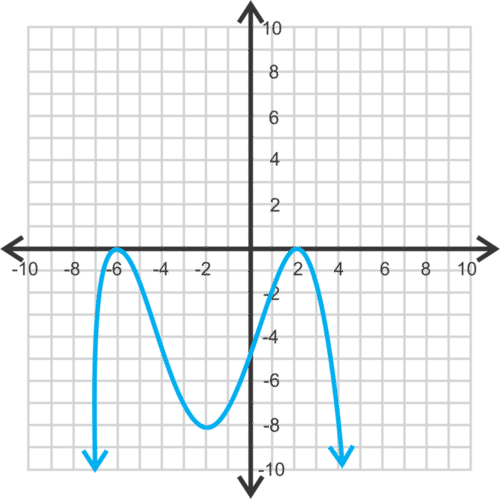
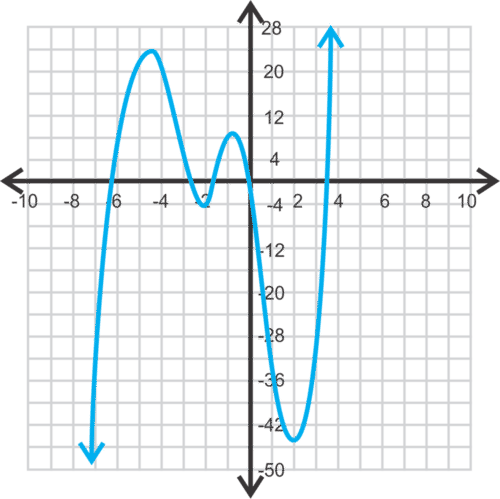
::例5Identify and categorize all extrema, both global and local, of the following graph.
::确定并分类下图的所有全球和局部外形。
Solution: There are an infinite number of highest points on this graph, so there are an infinite number of global maxima of 3 on the interval . All of them, except for the endpoint (1,3), are also local maxima. There is also a local maxima of 0 at (0,0) since it is the highest point in an open interval of the domain of the function. There are no global minima since the graph continues forever downward.
::解答 : 此图有无限数量的最高点, 因此在间隔[ 1,\\\\\\\\\\\\\\\\\\\\\\\\\\\\\\\\\\\\\\\\\\\\\\\\\\\\\\\\\\\\\\\\\\\\\\\\\\\\\\\\\\\\\\\\\\\\\\\\\\\\\\\\\\\\\\\\\\\\\\\\\\\\\\\\\\\\\\\\\\\\\\\\\\\\\\\\\\\\\\\\\\\\\\\\\\\\\\\\\\\\\\\\\\\\\\\\\\\\\\3\\\\\\\\\\\\\\\\\\\\\\\\\\\\\\\\\\\\\\\\\\\\\\\\\\\\\\\\\\\\\\\\\\\\\\\\\\\\\\\\\\\\\\\\\\\\\\\\\\\\\\\\\\\\\\\\\\\\\\\\\\\\\\\\\\\\\\\\\\\\\\\\\\\\\\\\\\\\\\\\\\\\\\\\\\\\\\\\\\\\\\\\\\\\\\\\\\\\\\\\\\\\\\\\\\\\\\\\\\\\\\\\\\\\\\\\\\\\\\\\\\\\\\\\\\\\\\\\\\\\\\\\\\\\\\\\\\\\\\\\\\\\\\\\\\\\by CK-12 demonstrates how to find the absolute and local extrema.
::CK-12 演示如何找到绝对的局部矩形。Example 6
::例6Identify and categorize all extrema, both global and local, of the following graph.
::确定并分类下图的所有全球和局部外形。Solution: The highest point on this graph appears to be around (0.30, 120). 120 is the global maximum and it is also a local maximum. This represents your systolic blood pressure reading. The lowest point on this graph appears to be around (0.20,80); 80 is also a global and local minimum. This represents your diastolic blood pressure reading. This person's blood pressure is mm Hg (millimeters of mercury).
::解答: 此图上的最高点似乎在( 0. 30, 120) 。 120 是全球最高点, 也是本地最高点 。 这代表了您的静脉血压读数 。 此图上的最低点似乎在0. 20, 80 左右; 80 也是全球和本地最低点 。 这代表了您的异口血压读数 。 此人的血压为 12080 毫米汞( 毫米汞 ) 。There is also a local maximum of approximately 105 at (0.45, 105) and local minimum of 100 at approximately (0.40, 100) when the aortic valve closes. 1
::此外,在(0.45、105)和(0.40、100)关闭动脉阀时,当地最多约105个,当地最低为100个。Summary
::摘要-
As you read a graph from left to right on the
x
-axis, it is increasing if the
y
-values go up, decreasing if the
y
-values go down, and constant if the
y
-values stay the same.
::当您在 X 轴上读取从左到右的图表时,如果 Y 值上升,它会增加,如果y 值下降,则会减少,如果y 值保持不变,则会保持不变。 -
Global extrema and absolute extrema are synonyms that refer to the points that have either the highest or the lowest
y
-values of the entire function.
::Global extrema 和 绝对 extrema 是同义词, 指具有整个函数最高或最低 y 值的点。 -
Local extrema and relative extrema are synonyms that refer to the points that have either the highest or lowest
y
-values in an open interval contained in the domain of the function.
::局部弧度和相对弧度是同义词,指在函数域内的开放间隔内具有最高或最低 y 值的点。
Review
::回顾Identify where the following graphs are increasing, decreasing or constant. Identify any extrema, both global or local.
::标明下图的增减或常数。 标明任何全球或本地的外形 。1.
2.
3.
4.
5.
6.
7.
8.
9.
10.
Explore More
::探索更多1. Below is a graph describing the amount of forest land in the U.S. by area of the country. 2
::1. 下图按美国地区说明美国林地面积。 2
Use the language increasing, decreasing, or constant to identify any trends in this graph. Identify the global extrema for each curve.
::使用语言增加、减少或常数来识别本图中的任何趋势。指定每个曲线的全球矩形。2. Below is a graph showing data collected by the National Oceanic and Atmospheric Administration global atmospheric concentration of carbon dioxide up to 2010. 3
::2. 下图显示国家海洋和大气管理局全球大气二氧化碳浓度截至2010年的数据。 3
Use the language increasing, decreasing, or constant to identify any trends in this graph. Identify the global extrema.
::使用语言增加、减少或常数来识别本图中的任何趋势。 识别全局extrema 。3. The graph below shows the median income of an individual based on his/her number of years of education. The top curve shows the median income for males and the bottom curve shows the median income for females (Source: US Census, 2003). 4
::3. 下图显示根据受教育年限计算的个人中位收入,上曲线显示男性的中位收入,下曲线显示女性的中位收入(资料来源:美国人口普查,2003年)。
Use the language increasing, decreasing, or constant to identify any trends in this graph. Identify the global extrema.
::使用语言增加、减少或常数来识别本图中的任何趋势。 识别全局extrema 。4. Graphing Utility: The prototype for a roller coaster is represented by the equation . What is the maximum height the coaster will reach over the domain [-1, 2]?
::4. 绘制功用图:云层海岸车的原型由 y=x5-8x3+10x+6 等式表示。 圆层海岸车在域上的最大高度是多少[ - - - 2]?by Mathispower4u demonstrates how to determine the location and value of the local minimum and local maximum of a cubic function.
::通过 Mathispower4u 演示如何确定一个立方函数的本地最小值和本地最大值的位置和值 。Answers for Review and Explore More Problems
::回顾和探讨更多问题的答复Please see the Appendix.
::请参看附录。PLIX
::PLIXTry these interactives that reinforce the concepts explored in this section:
::尝试这些强化本节所探讨概念的交互作用 :References
::参考参考资料1. "Blood Pressure," last edited May 11, 2017, .
::2017年5月11日 上次编辑的"血压" 2017年5月11日2. "Forests and Timberland," last updated May 09, 2002,
::2. “森林和林地”,2002年5月9日最新更新3. "Atmospheric Concentration of Carbon Dioxide (ppm) - European Enviromental Agency," lat modified September 11, 2015,
::3" 二氧化碳(ppm)大气浓度 - 欧洲环境局,拉特修正了2015年9月11日4."Statistical Abstract of the United States: 2003," last revised October 6, 2015, .
::《美国统计摘要:2003年》,最后于2015年10月6日修订, -
Increasing
if the
y
-values go up, that is