4.3 绘图和评估对数函数
章节大纲
-
Introduction
::导言Consider the emergency personnel who were handling the aftermath of Hurricane Fran. days after the hurricane, the number of power outages could be modeled by the exponential function . This function is helpful, but it would be more beneficial to determine the number of days the emergency personnel need to report, given the number of power outages. For this calculation, the inverse function of the given exponential function must be used. This inverse function is %3D%5Cfrac%7B%5Cln%7Bn%7D-%5Cln%7B1%2C%5C!274%2C%5C!100%7D%7D%7B%5Cln%7B0.6343%7D%7D%2C" style="width: 684px;">
::考虑到处理飓风弗朗飓风后果的应急人员在飓风发生后数日,断电次数可以用指数函数f(t)=1,274,100(0.6343t),t0来模拟。这个函数很有用,但考虑到停电次数,确定紧急人员需要报告的天数比较有益。对于这个计算,必须使用给定指数函数的反作用。这个反作用是T=ln-ln=1,274,100.6343,
where is the number of power outages, and "> is the total number of days. If the number of power outages reaches 5,000, determine the number of days the emergency personnel need to report after the hurricane.
::n>0是停电次数,T
Inverse of an Exponential Function
::指数函数的逆函数F unctions are inverses of each other when their graphs are mirror images over the line . Consider where or . When the function's graph is reflected over the line , the resulting curve is the graph of where log represents a logarithm function.
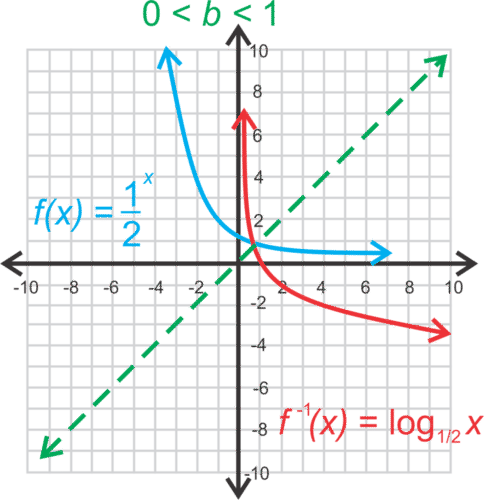
::当它们的图形是 y=x 线上的镜像图像时, 函数是反向的。 考虑 f( x) =bx, 其中 b>1 或 0 <b < 1. 当函数的图形反映在 y=x 线上时, 产生的曲线是 f- 1 (x) =logbx 的图形, 其中日志代表对数函数 。The graphs below illustrate an example of the exponential function with base 2 and its inverse. The first graph illustrates and its inverse, . The second graph illustrates and its inverse, . The base in the 1st graph below is 2, and in the 2nd graph below is to display two ways the are graphed in the coordinate plane. Note that the base can be any number greater than 0 except 1.
::下面的图表显示了以基 2 及其反向显示指数函数的示例。 第一个图形显示 f( x) = 2x 及其反向, f-1( x) = log2x。 第二个图形显示 f( x) = ( 12) 及其反向, f-1( x) = log12x。 下面第一个图中的基数是 2, 下面的第二个图是 12, 以显示坐标平面所显示的两种方式。 请注意, 底数b 可以是除 1 外大于 0 的数 。 请注意, 除 1 外, 底数b 可以是 大于 0 的数 。Inverse of the exponential function
::指数函数的逆向The inverse of the function is .The general form of a logarithmic function is . I f , there are three key points on the graph of the logarithmic function: , , and .
::对数函数的一般形式是 f( x) = alogbx。 如果 a=1, 对数函数图中有三个关键点:1, 1, 1, 0) 和 (b, 1) 。When the base is 10 , the inverse function is . This logarithmic function is called the common logarithm and is written as . When the base is , the inverse function is . This logarithmic function is called the natural logarithm and is written as .
::当基值为 10 时, 反向函数为 f( x) = log10 x。 此对数函数被称为通用对数, 以 f( x) = logx 写入。 当基值为 e 时, 反向函数为 f( x) = logex 。 此对数函数被称为自然对数, 以 f( x) = lnx 写入 。The logarithmic function can also undergo transformations: .
::对数函数也可以进行变换: f( x) =alogb( x-h)+k。Since an exponential function has a horizontal asymptote, the logarithm will have a vertical asymptote at . The domain is and the range is all real numbers. If and , the graph increases on . If and , the graph decreases on .
::由于指数函数有一个水平同位数, 对数将有一个在 x=h 的垂直同位数。 域为 x>h , 范围为全部实际数字。 如果 b>1 和 a>0, 则图形在( h, ) 上增加。 如果 0 < b < 1 和 a > 0, 则在( h, ) 上减少图形 。
Examples
::实例Example 1
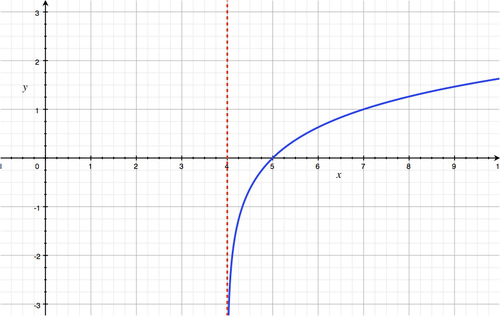
::例1Graph . State the domain and range.
::图 y= log3 (x- 4) 说明域和范围 。Solution:
::解决方案 :The vertical asymptote is at . Since , the graph is increasing on the interval . The domain is and the range is all real numbers.
::自 3 > 1 开始, 图形在间隔( 4,\\\\\\\\\\\\\\\\\\\\\\\\\\\\\\\\\\\\\\\\\\\\\\\\\\\\\\\\\\\\\\\\\\\\\\\\\\\\\\\\\\\\\\\\\\\\\\\\\\\\\\\\\\\\\\\\\\\\\\\\\\\\\\\\\\\\\\\\\\\\\\\\\\\\\\\\\\\\\\\\\\\\\\\\\\\\\\\\\\\\\\\\\\\\\\\\\\\\\\\\\\\\\\\\\\\\\\\\\\\\\\\\\\4\\\\\\\\\\\\\\\\\\\\\\\\\\\\\\\\\\\\\\\\\\\\\\\\\\\\\\\\\\\\\\\\\\\\\\\\\\\\\\\\\\\\\\\\\\\\\\\\\\\\\\\\\\\\\\\\\\\\\\\\\\\\\\\\\\\\\\\\\\\\\\\\\\\\\\\\\\\\\\\\\\\\\\\\\\\\\\\\\\\\\\\\\\\\\\\\\\\\\\\\\\\\\\\\\\\\\\\\\\\\\\\\\\\\\\\\\\\\\\\\\\\\\\\\\\\\\\\\\\\\\\\\\\\Example 2
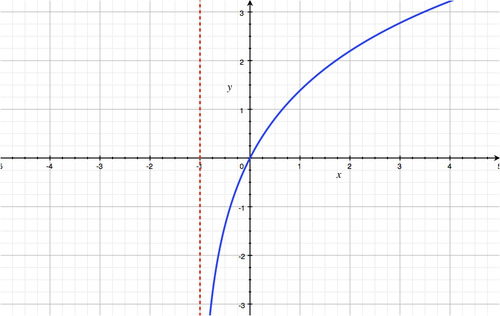
::例2Graph .
::图f(x)=2ln(x+1)Solution:
::解决方案 :-
The vertical asymptote is at
.
::垂直静态为 x1 。 -
Since
, the graph is increasing on the interval
.
::自 e>1 以来,图的间距(- 1,\\\\\\\\\\\\\\\\\\\\\\\\\\\\\\\\\\\\\\\\\\\\\\\\\\\\\\\\\\\\\\\\\\\\\\\\\\\\\\\\\\\\\\\\\\\\\\\\\\\\\\\\\\\\\\\\\\\\\\\\\\\\\\\\\\\\\\\\\\\\\\\\\\\\\\\\\\\\\\\\\\\\\。 -
The domain is
and the range is all real numbers.
::域是 x1, 区域是所有实际数字 。
Example 3
::例3Find three key points for the function . Then graph the function.
::查找函数 y = log14x+2 的三个关键点。然后绘制函数图。Solution:
::解决方案 :-
There is a vertical asymptote at
.
::x=0 时有一个垂直的空点 。 -
Since
the function is decreasing on
::自 0<14<1] 起,该函数正在下降 (0,\\\\) 。 -
Use point transformation to find some key points. The graph has a vertical shift up 2:
::使用点转换以找到一些关键点。 图形向上垂直移动 2:
Example 4
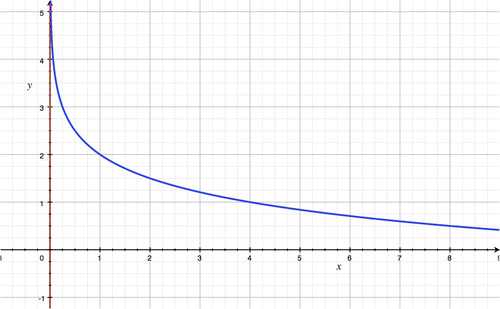
::例4Graph . Find the domain and range.
::图形 ylogx. 查找域和范围。Solution:
::解决方案 :-
Since
and t
his graph is reflected across the
-axis
, the function is decreasing.
::由于 X轴横跨 X > 1 和本图,该函数正在下降。 -
The domain is
and the range is
.
::域名是( 0, ) , 范围是( , ) 。
Example 5
::例5Is on the graph of ?
::F(x) = log12 (x+4) 的图形是否(-2) - 1) ?Solution:
::解决方案 :Plug (-2, -1) into to see if the equation holds true:
::插件 (-2, - 1) 插入 f( x) =log12\\\( x+4) 以查看方程式是否正确 :
::-1=log12(-2+4)-1=log12212-1=22=2。Therefore, (-2, -1) is on the graph.
::因此,(2-2-1)在图表中。Example 6
::例6Is (16, 1) on ?
:16,1)在y=log(x-6)上吗?
Solution:
::解决方案 :Plug in the point to the equation to see if it holds true:
::插在方程的点上, 看看它是否真实:
::1=log(16-6)1=log1010101=10。Yes, this is true, so (16, 1) is on the graph.
::是的,这是真的,所以图上是16,1。Example 7
::例7Recall the problem from the Introduction. Determine the number of days the emergency personnel need to report after Hurricane Fran, i f the number of power outages reaches 5,000. T he inverse function for this problem is:
%3D%5Cfrac%7B%5Cln%7Bn%7D-%5Cln%7B1%2C%5C!274%2C%5C!100%7D%7D%7B%5Cln%7B0.6343%7D%7D%5Capprox-2.1967%5Cln%7Bn%7D%2B30.8803">
::回顾导言中的问题。确定在弗朗飓风后紧急人员需要报告的天数,如果停电次数达到5 000次的话。这个问题的反作用是:TTo determine the number of days after the hurricane that the outages will reach 5,000, calculate:
::为了确定飓风过后5 000天的停机率将达到5 000天,计算:T(5 000)=5 000-1 274 100-0.6343-12天。Summary
::摘要-
If where or , then .
::如果 f( x) = bx, 其中 b > 1 或 0 <b < 1, 那么 f- 1 (x) =logbx 。
::如果 f( x) = bx, 其中 b > 1 或 0 <b < 1, 那么 f- 1 (x) =logbx 。 -
When , the inverse function is called the common logarithm and is written as
::b=10 时,反函数称为常见对数,以 f(x) =logx 写入。
::b=10 时,反函数称为常见对数,以 f(x) =logx 写入。 -
When , the inverse function is called the natural logarithm and is written as
::b=e 时,反函数称为自然对数,写成 f(x)=lnx。
::b=e 时,反函数称为自然对数,写成 f(x)=lnx。 -
The logarithmic function can also undergo transformations:
::对数函数也可以进行变换: f( x) =alogb( x-h)+k。
::对数函数也可以进行变换: f( x) =alogb( x-h)+k。
Review
::回顾Graph the following logarithmic functions without using a calculator by reflecting the corresponding exponential function. State the equation of the asymptote, the domain, and the range of each function:
::绘制以下对数函数的方程式,不使用计算器,而反映相应的指数函数。请说明单数的方程式、域和每个函数的范围:-
::y=log5x -
::y=log2( x+1) -
::y=log(x)- 4 -
::y=log13(x- 1)+3 -
::ylog12( x+3) - 5 -
::y=log4( 2- x)+2
Graph the following logarithmic functions using your graphing device:
::用您的图形化设备绘制以下对数函数图 :-
::y=ln( x+6)- 1 -
::yln(x- 1)+2 -
::y=log( 1- x)+3 -
::y=log( x+2) - 4
-
Bonus:
How would you graph
on the graphing
device
? Graph the function.
::Bonus: 您如何在图形设备上绘制 y=log4x 的图形? 图形显示函数 。 -
Bonus:
Graph
on the graphing
device
.
::Bonus: 图形设备上的图 y= log34x 。 -
Is (3, 8) on the graph of
?
::y=log3&(2x-3)+7的图中是否(3,8)? -
Is (9, -2) on the graph of
?
::y=log14(x-5)的图表上是否(9,2)? -
Is (4, 5) on the graph of
?
::y=5log2(8-x)的图上是否有(4,5)?
Review ( Answers)
::回顾(答复)Please see the Appendix.
::请参看附录。 -
The vertical asymptote is at
.