4.8 人口增长模式和后勤职能
章节大纲
-
Introduction
::导言In May of 2014, the 1st cases of the ebola virus were detected in Sierra Leone. The following graph shows the number of cases detected every other week from May 15, 2014, through December 31, 2014:
The mathematical model for the growth of the virus for this data is where is the number of 2-week periods since May 13, 2014, and is the number of diagnosed cases of ebola in Sierra Leone. This model describes the population of the occurrences of ebola virus cases in that area.
::此数据病毒生长的数学模型是P(t)=343.001e0.22739t, t是2014年5月13日以来的2周周期,P(t)是塞拉利昂经确诊的ebola病例数,该模型描述了该地区伊波拉病毒病例的发生率。Population Growth Model
::人口增长模式P opulations grow, at least for a short period of time, according to an exponential model. These populations can be of cell s, animals, data, people, viruses, or a nything that tends to grow at a fairly constant rate . The population growth model is where is the initial population when , is the g rowth rate, and is the time since the population was detected.Population Growth Model
::人口增长模式increases without bound, which is reas onable in the short run . However, populations usually have some type of upper bound. This can be caused by limitations on food, space, or other scarce resources. The logistic model describes population growth that is limited by its environment.The Logistic Model
::后勤模式Logistic Equation
::后勤等量where , , and are constants and .
::f(x) = c1+abx, 其中a、b和c为常数, 0<b<1。In the logistic equation, the letters , , and are constants that can be changed to match the situation being modeled. The constant is particularly important because it is the limit of the growth, or the carrying capacity .
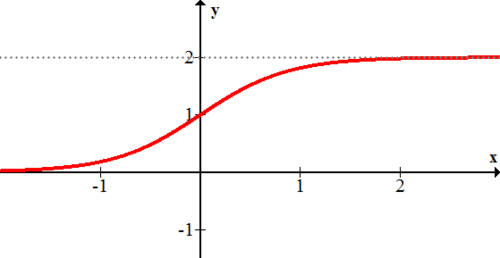
::在后勤等式中,字母a、b和c是常数,可以修改以适应正在模拟的情况。常数c特别重要,因为它是增长的限度或承载能力。The following logistic function has a carrying capacity of 2 because . When graphing the function , a horizontal asymptote occurs at the horizontal line of carrying capacity, . Another horizontal asymptote occurs at the -axis. If the logistic function has a vertical shift , then both horizontal asymptotes will be vertically shifted as well.
::以下后勤职能的承载能力为2, 因为 c=2. 在绘制函数图时, 水平的承载能力水平线上会出现水平的空位, y=2. 另一种水平的空位出现在 x 轴上。 如果后勤职能垂直移动, 那么两个水平的空位也会垂直移动 。
:xx)=21+0.1x
An important note about the logistic function is its inflect ion point. Observe that at the point the graph transitions from curving up (concave up) to curving down (concave down). The inflection point occurs halfway between the two horizontal asymptotes. In this example, the inflection point occurs halfway between the carrying capacity and the -axis.
::关于后勤功能的一个重要说明是其切入点。 注意在点( 0, 1) , 图从弯曲上( 弯曲上) 到弯曲下( 弯曲下) 。 切入点在两个水平低位值之间的半点。 在此示例中, 切入点在承载能力和 x 轴之间的半点 。The logistic equation can be determined from given conditions, such as the carrying capacity, the initial value, and a population at a certain time. Remember that the carrying capacity is in the equation. The initial value is the function value when . When the initial value and carrying capacity are inserted into the logistic equation, can be solved for easily because . Once and are determined, can be calculated by inserting the given population and time into the logistic equation with and . A specific example can be seen in the following video:
::后勤方程可以根据特定条件确定,例如承载能力、初始值和某一时间的人口。请记住承载能力是 c 方程中的。初始值是 x=0 的函数值。当初始值和承载能力被插入后勤方程时,可以很容易地解答,因为b0=1. 一旦确定a和c,b 可以通过将特定人口和时间与a和c插入后勤方程中的方式计算。Examples
::实例Example 1
::例1A rumor is spreading in an office that has 1,200 employees. Four people know the rumor when it starts, and three days later, 300 have heard the rumor. About how many people in the office know t he rumor by the 4th day?
::4人知道谣言开始时,3天后,300人听到了谣言。 关于办公室中有多少人知道第4天的谣言?Solution:
::解决方案 :Step 1: In a limited population, the count of people who know a rumor is an example of a situation that can be modeled using the logistic function. The population is 1,200 so this will be the carrying capacity.
::第1步:在有限的人口中,了解谣言的人数是使用后勤功能进行模拟的一个实例。人口为1,200人,即承载能力。Parameters to fit the model:
::适合模型的参数: c= 1,200; (0,4); (3,300)Step 2: Evaluate at the point (0, 4) t o solve for .
::步骤2:在(0,4)点对a进行鉴定。
::1,2001+ab0=41,2001+a=41,2004=1+a=299Step 3: Evaluate at the point (3, 300) to solve for .
::步骤3:在(3,300)点进行评估,以解决b.
::1,2001+299b3=3004=1+299 b33299=b30.21568bThe modeling equation at :
::x=4 的建模方程式:
::f(x) = 1,21+299_0.21568x_f(4)_____________________________________________________________________________________________________________________________________________________________________________________________________________________________________________________________________________________________________________________________________________________________________________________________________________________________________________________________________________________________________________________________________________________________________________________________________________________________________________________________________________________________________________________________A similar growth pattern will exist with any kind of infectious disease that spreads quickly and can only infect a person or animal once.
::任何传染性疾病迅速蔓延,只能一次感染一个人或动物,这种疾病也会出现类似的增长模式。Example 2
::例2Long Island has roughly 8 million people. A hundred years ago, it had 2 million people. Suppose that the resources and infrastructure of the island could only support 20 million people. When will the population reach 10 million inhabitants?
::长岛约有800万人,100年前有200万人,假设该岛的资源和基础设施只能支持2 000万人,人口何时能达到1 000万居民?Solution:
::解决方案 :Step 1: Identify known points and the carrying capacity. (0, 8,000,000) and (-100, 2,000,000). . Use the 1st point to solve for .
::第1步:确定已知点和承载能力。 (0,800,000)和(-100,2,000,000,c=2,000,000。使用第1点解决a。
::8 000 000=20 000 0001+ab08 000 000=20 0001+a1+a=20 000 0008 000 000=2.5a=1.5Step 2: Evaluate at the 2nd point to solve for .
::步骤2:在第二点对b进行评价,以解决b。
::2 000 000=20 000 0001+1.5b-1001+1.5b-100=10b-100=100=91.51b100=616=b100b=0.98224Step 3: The question asks for the value when
::第3步:当f(x)=10 000 000时,问题要求x值。
::10 000 000=20 000 0001+1.5(0.98224x1+1.52(0.98224x2)(0.98224x2)(0.98224x=23x(8)(0.982224)=ln((23x)=ln(23)XXX(23)(0.98224)。This means that the predicted time from now that the population of Long Island will reach 10 million inhabitants is about 22.6 years.
::这意味着从现在起长岛人口将达到1 000万的预测时间约为22.6年。Example 3
::例3A special kind of algae is grown in giant clear plastic tanks and can be harvested to make biofuel. The algae are given plenty of food, water, and sunlight to grow rapidly, and the only limiting resource is space in the tank. The algae are harvested when 95% of the tank is full, leaving the tank 5% full of algae to reproduce and refill the tank. Currently the time between harvests is 20 days, and the payoff is 90% harvest. Would you recommend a more optimal harvest schedule?
::一种特殊的藻类在巨大的清晰塑料罐中生长,可以收获来生产生物燃料。藻类有充足的食物、水和阳光可以快速生长,而唯一的限制资源是储罐的空间。当95%的储罐满载时,藻类就被收获,让5 %的满水藻再生和再填充储罐。目前,从收获到收获的时间是20天,而收益则是90%的收获。你是否推荐一个更理想的收成时间表?Solution:
::解决方案 :Identify known quantities and model the growth of the algae.
::查明已知数量并模拟藻类的生长。Known quantities:
::已知数量: (0,0.005); (20,0.95); c=1或100%
::0.05=11+ab01+a=10.05a=190.95=11+19_b201+19_b20=10.95b20=(10.95-1)19b=0.74495The model for the algae growth is
::藻类生长的模型是
::f(x)=11+19(0.74495)x。The question asks about optimal harvest schedule. Currently the harvest is 90% per 20 days, or a unit rate of 4.5% per day. Shortening the time between harvests where the algae are growing the most efficiently will poten tially increase this unit rate. Suppose 15% of the algae is left in the tank and harvest ed when it reaches 85%. How much time will that take to yield 70%?
::问题询问了最佳收成时间表。 目前,收成为每20天90%,或每天4.5 % 。 缩短藻类生长效率最高的收成之间间隔时间可能会增加这个单位速度。 假设15%的藻类留在水槽中,当它达到85%时收获。 这需要多少时间才能收成70%?
::0.15=11+19(0.744995xx1) 4.108970.85=11+19(0.744995xx2) 15.891415.8914-4.1089711.78243It takes about 12 days for the batches to yield 70% harvest, which is a unit rate of about 6% per day. This is a significant increase in efficiency. A harvest schedule that maximizes the time where the logistic curve is steepest creates the fastest overall algae growth.
::批量需要大约12天才能收获70%的收获,单位速度约为每天6%。 这是效率的显著提高。 收成时间表将后勤曲线最陡峭的时间最大化,从而创造出最快的总藻类生长速度。Example 4
::例4Given the following logistic model, predict the value that will produce a height of 14 and then predict the height when is 4.
::考虑到以下后勤模式,预测产生14个高度的x值,然后预测X为4的高度。
::f(x)=201+4(0.9.9)xSolution:
::解决方案 :Step 1: Solve for with a known height of 14.
::第1步:为已知高度为14的 x 提供补偿。Step 2: Substitute for .
::14=201+4(0.9)x1+4(0.9)xxx=2014(0.9)xxx=2014(2014-1)x=(0.9)xx=(2014-1)4x=(0.9)((2014-1)4)=((2014-1){(2014-1)4)_(0.9)x1+4(21)1995Step2: x=4的替代物。
::f(x)=201+4(0.9.9)4=5.51815Example 5
::例5Determine the logistic model given and the points (0, 9) and (1, 11).
::确定给定的后勤模式C=12以及点(0,9)和点(1,11)。Solution:
::解决方案 :Step 1: Use the given conditions to solve for and .
Step 2: Complete the logistic equation.
::第1步:使用给定条件解决a和b. 9=121+ab01+a=129a=1311=121+(13)b11+(13){b=1211b=0.27 311Step2:完成后勤方程。
:Example 6
::例6Determine the logistic model given and the points (0, 2) and (3, 5).
::确定给定的C=7的后勤模式以及点数(0,2)和点数(3,5)。Solution:
::解决方案 :Step 1: Use the given conditions to solve for and .
::第1步:使用给定条件解决 a和b. 2=71+ab01+a=72a=2.55a=2.55=71+(2.5)b31+(2.5)b3=75b3=0.16b=0.16b=0.5429Step 2: Complete the logistic equation.
::步骤2:完成后勤等式。
:Summary
::摘要-
The population growth model is
::人口增长模式是P(t)=P0ert。 -
The logistic equation is
::后勤方程为f(x)=c1+abx。 -
The logistic equation can be determined when given the
carrying capacity, the initial value, and a population at a certain time
by solving for the constants
,
, and
::后勤方程式可以按照承载能力、初始价值和人口在某一时间通过对常数a、b和c的解答来确定。
Review
::回顾For 1-5, determine the logistic model given the carrying capacity and two points.
::1-5,根据承载能力和两点确定后勤模式。1.
::1. c=12; (0, 5); (1, 7)2.
::2. c=200; (0,150); (5,180)3.
::3. c=1 500; (0,150); (10,1 000)4.
::4. c=1,000,000; (0,100,000); (-40,20,000)5.
::5. c=30 000 000;(-60,10 000);(0.8 000 000)For 6-8, use the logistic function .
::6-8使用后勤功能f(x)=321+3e-x。6. What is the carrying capacity of the function?
::6. 该职能的承载能力是什么?7. What is the -intercept of the function?
::7. 函数的Y 界面是什么?8. Use your answers to 6 and 7 along with at least two points on the graph to make a sketch of the function.
::8. 使用您对 6 和 7 的回答以及图上至少两点来绘制函数的草图。For 9-11, use the logistic function .
::9-11时,使用后勤功能g(x)=251+40.2x。9. What is the carrying capacity of the function?
::9. 该职能的承载能力是什么?10. What is the -intercept of the function?
::10. 函数的Y 界面是什么?11. Use your answers to 9 and 10 along with at least two points on the graph to make a sketch of the function.
::11. 利用对9和10的答复以及图上至少两点来绘制函数的草图。For 12-14, use the logistic function .
::对于12-14,使用后勤功能h(x)=41+20.68x。12. What is the carrying capacity of the function?
::12. 该职能的承载能力是什么?13. What is the -intercept of the function?
::13. 函数的Y 界面是什么?14. Use your answers to 12 and 13 along with at least two points on the graph to make a sketch of the function.
::14. 使用您对12和13的答复以及图上至少两点来绘制函数的草图。15. Bonus : Give an example of a logistic function that is decreasing (models decaying). In general, how can you tell from the equation whether the logistic function is increasing or decreasing?
::15. 效益:举一个正在减少的后勤功能(模式衰减)的例子,一般而言,如何从等式中看出后勤功能在增加还是减少?Review (Answers)
::回顾(答复)Please see the Appendix.
::请参看附录。 -
The population growth model is