7.4 转化松和余弦函数
章节大纲
-
Introduction
::导言Consider the graph of average monthly temperatures during one year in Chicago:
::考虑芝加哥一年月平均气温图:
Clearly, this is a sine or cosine graph. However, several transformations have been performed. The is This graph also has a vertical and horizontal shift. In this section, we will explore both vertical and horizontal shifts .
::显然,这是一个正弦或正弦图。 但是, 已经进行了数个转换。 最大值 - 最小值2 = 28。 此图也有一个垂直和横向的转换。 在此节中, 我们将探讨垂直和横向的移动 。Translating Sine and Cosine Functions
::转换正弦和余弦函数Just like other functions, curves can be translated to the left, right, up, and down.
::就像其他函数一样,曲线可以被翻译成左、右、上、下。The general equation for a sine and cosine curve is and respectively. Similar to other function transformations, is the horizontal shift (also called a phase shift), and is the vertical shift .
::正弦和余弦曲线的一般方程是 y = Asin(x-h)+k 和 y = Acos(x-h)+k 。 与其他函数转换类似, h 是 水平转换( 也称为 阶段转换) , k 是 垂直转换 。Horizontal & Vertical Shifts
::水平和垂直移动
::y=sin}(x-h) y=sin}(x-h) y=sin}(x+h) y=sin}(x+h) y=sin}(x+h) y=sin}(x) +k y=sin}(x) y=sin}(x-h) y=sin}(x) -k y=sin=sin}(x+h) y=sin=sin}(x) y=sin*x 向下移动 k 单位Examples
::实例Example 1
::例1Graph .
::图y=cos(x4)Solution :
::解决方案 :Identify the shift. Since the x-value is reduced by , this function will be shifted units to the right. The easiest way to sketch the curve is to start with the parent graph and then move it to the right the correct number of units. The parent graph ( ) is shown below in dotted blue. The solid graph in red is the graph of .
::识别变化。 由于 x 值减少 +++ 4, 此函数将被移到右边 ++ 4 单位。 绘制曲线的最简单方式是从父图形开始, 然后将其移到正确的单位数。 父图形( y=cosx) 以点蓝色显示在下面。 红的固态图形是 y=cos+( x++ 4) 的图形。Example 2
::例2Graph .
::图y=sin(x+2)+3。Solution :
::解决方案 :Step 1: The sine function is graphed in blue.
::第1步:正弦函数以蓝色图表显示。Step 2: Then the graph is shifted 2 units to the left, because the horizontal shift is -2. This graph is in green.
::第2步:然后将图向左移动2个单位,因为水平移动是 - 2。 这个图是绿色的。Step 3: Translate the green graph up 3 units, because the vertical shift is +3. The solid red graph is the result.
::步骤3:将绿色图向上翻译3个单位,因为垂直移动是+3。 固态红色图是结果。Example 3
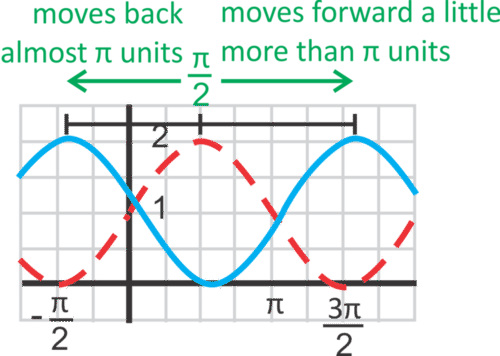
::例3Find the equation of the sine curve below.
::查找下方正弦曲线的方程式。Solution :
::解决方案 :Step 1: T he amplitude is 1 because the maximum is 2 and the minimum is 0.
::第1步:振幅为1,因为最大值为2,最低值为0。Step 2: Identify the vertical shift. The sine function is shifted up 1 unit to get the given graph.
::第2步 : 识别垂直移动。 正弦函数被移到上方 1 个单位以获取给定的图形 。Step 3: The horizontal shift is the hardest to find. Because sine curves are periodic, the horizontal shift can either be positive or negative. Find a convenient point that reflects the horizontal shift. is close . So and the equation is
::步骤 3 : 水平转换是最难找到的。 因为正弦曲线是周期性的, 水平转换可以是正的, 也可以是负的。 找到一个能反映水平变化的方便点 。 (..., 1) 已经接近了 。 因此 h , 方程式是 ysin(x)+1 。Example 4
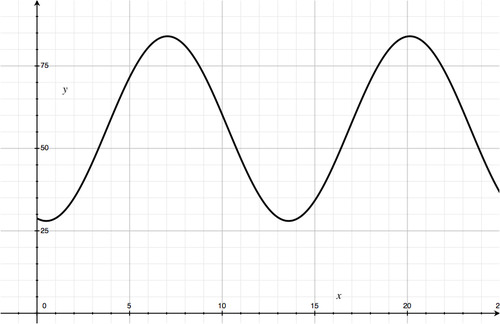
::例4Recall the problem from the Introduction. Consider the graph of average monthly temperatures during one year in Chicago. The graph of the model that fits that data is a sine or cosine graph and has an amplitude of 28. Determine the vertical shift.
::回顾导言中的问题。 考虑芝加哥一年中平均月温度的图。 符合该数据的模型图是一个正弦或正弦图, 其振幅为28。 确定垂直变化 。Solution :
::解决方案 :The sine function is shifted up approximately 56 units to get the given graph.
::正弦函数被移到大约56个单位,以获取给定的图形。Example 5
::例5Graph the following functions on :
::在 [,3] 上图示以下函数 :
::y1+siníx。 y1+sinx。Solution :
::解决方案 :Shift the parent graph down 1 unit.
::将父图向下移动 1 个单位 。Example 6
::例6Graph
::图y=cos(x3)-2。Solution :
::解决方案 :Step 1: Shift the parent graph to the left units
::第一步 1: 将父图向左移Step 2: Shift the resultant graph down 2 units.
::第2步:将随后的图表向下移动 2 个单位。Example 7
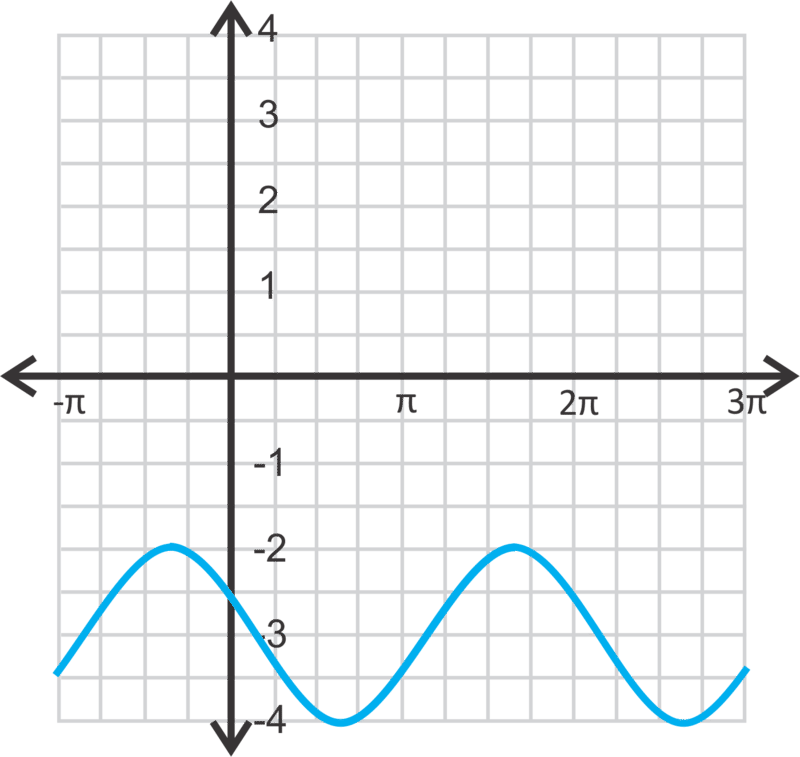
::例7Find the equation of the cosine curve below.
::在下面查找余弦曲线的方程。Solution :
::解决方案 :Step 1: Identify the vertical shift. It moves up 3 units.
::第1步:确定垂直转换。它向上移动3个单元。Step 2: Identify the horizontal shift. The graph moves to the right units.
::第2步:标明水平变化。图形向右移动 3+4 个单位。Step 3: The equation is .
::第3步:等式是y=cos(x-34)+3。If the equation was based on the cosine curve moving to the left, then the equation would be .
::如果公式基于向左移动的余弦曲线,则公式为y=cos(x+54)+3。Summary
::摘要-
The standard forms for the sine and cosine graphs are
and
, where
is the amplitude,
is the horizontal shift, and
is the vertical shift.
::正弦和余弦图形的标准表格是 y=asin(x-h)+k 和 y=acos(x-h)+k, 其中 a是振幅, h 是水平移动, k 是垂直移动 。 -
The period of standard sine and cosine functions is
.
::标准正弦和共弦函数的期间为 2 。
Review
::回顾For questions 1-4, match the equation with its graph.
::对于问题14, 问题14, 将方程式与其图表匹配 。-
::y=sin(x2) -
::y=cos(x4)+3 -
::y=cos(x4)-2 -
::y=sin(x4)+2
Which graph above also represents these equations?
::以上哪个图表也代表这些方程式?-
::y=cos(x) -
::y=sin%( x+3+4)-2 -
Write another sine equation for graph A.
::为图A写一个正弦方程。 -
How many sine (or cosine) equations can be generated for one curve? Why?
::一个曲线可以产生多少正弦(或余弦)方程式?为什么? -
Fill in the blanks below.
-
::sinux=cos(x) -
::COsx=sin(x)
::填充下面的空白。 sinx=cos(x) cosx=sin(x) -
For questions 10-15, graph the following equations from :
::关于问题10-15, 如下方程式来自[-2-2], 2:-
::y=sin(x4) -
::y=1+cosx -
::y=cos(x)-2 -
::y=sin%( x+3)- 4 -
::y=sin(x6) -
::y=cos%( x- 1)- 3 -
Is there a difference between
and
? Explain your answer.
::y=sinx+1和y=sin(x+1)之间有区别吗? 请解释您的答案 。
Review (Answers)
::回顾(答复)Please see the Appendix.
::请参看附录。 -
The standard forms for the sine and cosine graphs are
and
, where
is the amplitude,
is the horizontal shift, and
is the vertical shift.