12.3 极赤道
章节大纲
-
Introduction
::导言Max is in charge of the sound system for his big sister's wedding reception. He can't get into the hall until the morning of the wedding, so he's going to have to set up his microphones and speakers in record time. He does, however, have a floor plan of the hall. How can he make sure the pickup areas of the microphones and the broadcast area of the speakers don't overlap and cause feedback? He'll have time for some minimal trial and error, but he needs to have a general idea of where all the microphones and speakers will be during the reception. Can he use to help him place his equipment?
::麦克斯负责他大姐的婚礼招待会的音响系统。他不能进入大厅直到婚礼的上午,所以他必须在记录时间里安装他的麦克风和扬声器。 但是,他有一个大厅的地面图。 他如何确保麦克风的收发区和发言者的广播区不会重叠和产生反馈? 他将有时间进行一些微小的试验和错误,但他需要有一个关于接待期间所有麦克风和扬声器都放在哪里的一般想法。他能用来帮助他安装设备吗?Polar Equations
::极平方Why do people continue to use polar coordinates when modern computers are powerful and fast enough to solve extremely complicated problems in rectangular form ? One reason is that many polar graphs are beautiful and intriguing. Polar graphs can help people see patterns they might otherwise overlook. Artists have even used polar graphs as the basis of their designs.
::当现代计算机强大而快速,足以解决极端复杂的矩形问题时,人们为什么继续使用极地坐标? 原因之一是许多极地图是美丽而有趣的。 极地图可以帮助人们看到他们可能忽略的模式。 艺术家甚至用极地图作为设计的基础。One of the simplest equations that forms a special polar curve is , where is any real number and ranges from zero to infinity. Equations of this form create a shape known as an Archimedean spiral . As increases, the graph continues to spiral out like a perfect snail's shell. The graphs below (with the angles in degrees) demonstrate how changing the value of alters the spiral. Note that each curve will continue to spiral forever.
::形成特殊极曲线的最简单的方程式之一是 r=a, 其中一个是任何实际数字, 和 从零到无穷不等。 这种形态的方程式的方程式创造了一个被称为Archimedean 螺旋的形状。 随着 的增加, 图形继续像一个完美的蜗牛壳一样螺旋。 下面的图形( 角度以度计) 显示一个螺旋值是如何改变的。 注意每个曲线会永远螺旋 。Another important polar curve is the cardioid . People who work with acoustics know that the cardioid is an accurate model for both the pickup range of certain types of microphones and the broadcast range for certain kinds of speakers. Cardioids get their name from their heart-like shapes. Equations of the form produce cardioid curves. You can change the orientation of a cardioid, or of any other polar equation with cosine in its standard form, by replacing cosine with sine, negative cosine, or negative sine. Note that the graphs below include angles in radians.
::另一个重要的极地曲线是类心形。从事声学工作的人知道,类心形是某些类型麦克风的搭接范围以及某些类喇叭广播范围的精确模型。类心形从心型中取其名字。表型号 r=1+acos 的方程式可产生类心曲线。您可以通过正弦、负正弦或负正弦取代正弦来改变类心形或任何其他极方程式的方向。请注意,下图中包含弧度角度。Rose curves are another interesting set of polar curves. For these, equations are of the form or .
::玫瑰曲线是另一组有趣的极曲线。 对于这些曲线, 方程式为 r=acosn 或 r=asinn。 如果 n 是整数, 这些方程式将产生 n 的玫瑰, 如果 n 是奇数, 则产生 2n 的玫瑰。 如果 n 是 理性的, 不是整数, 则可能形成类似玫瑰的形状, 但与花瓣相重叠 。 变量a 代表玫瑰花瓣的长度。 角度再次以弧度表示 。Polar graphs can be created much like graphs of equations in the rectangular coordinate system. You can use a table of points, or you can use key information from the equations provided. Graphing software such as Desmos and GeoGebra as well as graphing calculators can help you produce both tables and graphs for polar equations.
::极图可以在矩形坐标系统中创建类似方程式的图形。您可以使用一个点表,也可以使用所提供的方程式的关键信息。 Desmos 和 GeoGeoGebra 等图形软件以及图形计算器可以帮助您生成极方公式的表格和图形。The following video demonstrates how to graph basic polar equations:
::以下视频展示如何绘制基本极方程图:Examples
::实例Example 1
::例1Use graphing software, a calculator, or a plotting program to plot the following equation:
::使用图形化软件、计算器或绘图程序绘制下列方程式:
::r% 2 。Solution:
::解决方案 :
Example 2
::例2Graph by hand the following equation:
::按手图绘制的公式如下: r=sin。Solution:
::解决方案 :
D epending on domain, the circle may be redrawn or retraced multiple times. The whole circle can be drawn when
::视域而定, 圆可以重新绘制或多次收回。 当 0\\\\\\\\\\\\\\\\\\\\\\\\\\\\\\\\\\\\\\\\\\\\\\\\\\\\\\\\\\\\\\\\\\\\\\\\\\\\\\\\\\\\\\\\\\\\\\\\\\\\\\\\\\\\\\\\\\\\\\\\\\\\\\\\\\\\\\\\\\\\\\\\\\\\\\\\\\\\\\\\\\\\\\\\可以绘制整个圆。Example 3
::例3Graph by hand the following equation:
::按手图绘制的公式如下: r=3cos=22。Solution:
::解决方案 :
Example 4
::例4Graph by hand the following equation:
::用手图绘制的公式如下: r=5sin22。Solution:
::解决方案 :
Example 5
::例5Recall the problem from the Introduction: You were asked how Max can set up the sound system for his sister's wedding so the speakers don't overlap.
::回顾导言中的问题:有人问到Max如何为他姐姐的婚礼建立音响系统,Solution:
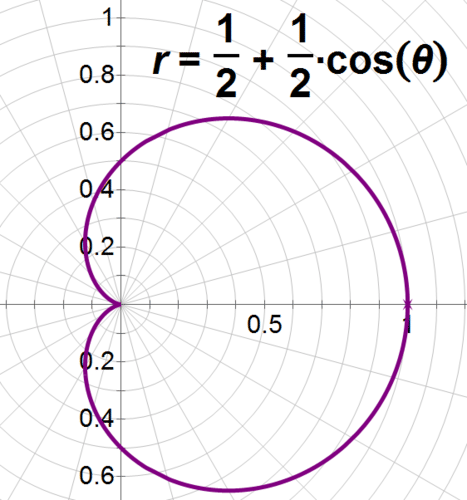
::解决方案 :Max can use cardioids to help him set up the sound system without causing feedback. Researching his microphones and speakers online, he finds out that the pickup pattern of his microphones can be graphed using the equation . Since he has multiple microphones to place , he can graph the curve and use it with his floor plan to ensure that the mikes don't overlap, and to position the speakers in the dead zones behind the microphones, where they won't pick up any sound.
::Max 可以在不引起反馈的情况下使用心血管机帮助他建立声音系统。 在网上研究他的麦克风和扬声器时, 他发现他的麦克风的接听模式可以用 r= 12+12cos的方程式来绘制。 由于他有多个麦克风, 他可以用他的平面图绘制曲线, 用他的平面图来确保麦克风不会重叠, 并且将扬声器放在麦克风后面的死区, 在那里他们不会听到任何声音。Since the microphones pick up along the polar axis between 0 and 1, he'll want to position speakers in the dead zone, where and . He can also put speakers at other places in the dead zone, but cardioid microphones are least likely to pick up sound when they are radians from their optimal pickup areas.
::由于麦克风沿着0到1的极轴在0到1之间收起,他想把扬声器放在死区,那里是r <0和0。他也可以把扬声器放在死区的其他地点,但是,心形麦克风在他们是乌拉迪人时,最不可能从他们最理想的搭载区听到声音。Example 6
::例6Use graphing software, calculator, or plotting program to plot the following equation:
::使用图形化软件、计算器或绘图程序绘制以下方程式: r=1+3sin。Solution:
::解决方案 :
Example 7
::例7Use graphing software, calculator, or plotting program to plot the following equation:
::使用图形化软件、计算器或绘图程序绘制以下方程式: r=1+2cos。Solution:
::解决方案 :
Summary
::摘要-
Polar graphs can show important information and relationships.
::极地图可以显示重要的信息和关系。 -
Tables and graphs can be created for polar equations using graphing software, calculators, or plotting programs.
::可以使用图形化软件、计算器或绘图程序为极方程式创建表格和图表。
Review
::回顾Plot the following equations:
::绘制下列方程式:16 . French mathematician Pierre de Fermat is credited with discovering the spiral defined by the equation . Graph this equation.
::16. 法国数学家Pierre de Fermat发现方程式r2 ' 所定义的螺旋,因此应归功于它。Review (Answers)
::回顾(答复)Please see the Appendix.
::请参看附录。Resources
::资源 -
Polar graphs can show important information and relationships.