14.9 差异
章节大纲
-
Introduction
::导言Two groups of students, each with an average test score of 75, might have a score distribution that looks remarkably different. One group might be made up entirely of grades between 72 and 78, while the other group may have half the students around 50, with the other half near 100. Variance is a way of measuring the variation in a set of data . What are the mean and variance for the following sample test scores taken from a larger student population ?
::两组学生,每组平均考试得分为75分,其得分分布可能明显不同。 一组学生的得分可能完全由72至78年级组成,另一组学生的一半在50岁左右,另一组学生的一半在100岁左右,另一组学生的得分接近100岁左右。 差异是衡量一组数据差异的一种方法。 从较大学生群体中抽取的以下抽样考试得分的平均值和差异是什么?75, 73, 78, 90, 60, 51, 87, 79, 80, 77

Variance
::差异The thought process of a person trying to describe the spread of some data for the 1st time must have been something like this:
::第一次试图描述某些数据传播情况的人的思考过程 一定是这样的:Well, the average is 75. What if I try to just add up how different each number is from 75?
::那么,平均数字是75,如果我试着加起来 每一个数字和75有什么不同呢?
Calculating the numbers, the person realizes pretty quickly that this sum will be zero, essentially by definition. This is because the numbers that occur below 75 precisely cancel out with the numbers above 75.
::在计算数字时,人很快意识到这个总和将是零,基本上根据定义。这是因为75以下的数字与75以上的数字完全勾销了75以下的数字。Since I cannot add the differences directly, why don't I just sum the absolute value of the differences?
::既然我不能直接加上差异, 为什么我就不能把差异的绝对价值 相加起来呢?
This is a legitimate method for describing the spread of the data. The sum of the absolute differences from the mean is the total distance of the data points from the point representing the mean of the set. It is called absolute deviation , and is simply the sum of the absolute values of each of the differences.
::这是描述数据分布的合理方法。 与平均值绝对差的总和是数据点与代表集平均值的数据点之间的总距离。 它被称为绝对偏差, 仅仅是每个差异的绝对值的总和。If I take the average absolute difference, I will be able to judge on average how far away each data point is from the mean. A larger difference means more spread out.
::如果我得出平均绝对差异,我就能平均判断每个数据点离平均值有多远。 更大的差异意味着扩大范围。
If you take the average of the absolute deviation, you get the mean absolute deviation . The mean absolute variation is a legitimate, but limited, way of describing the spread of data. Eventually, a person trying to describe the spread of data for the 1st time might consider a method called population variance.
::如果选择绝对偏差的平均值,您就会得到绝对偏差的平均值。绝对偏差是描述数据分布的一种合理但有限的描述方式。最终,试图描述数据第一次分布的人可能会考虑一种称为人口变化的方法。What if instead of using absolute value to solve the issue, I square each difference and then add them together? Of course I'd have to divide by the number of data points to get the average difference squared.
::如果不是用绝对价值来解决问题,而是我将每个差异平分,然后将它们加在一起呢? 当然,我不得不除以数据点数来平分平均差异。
This method turns out to be extraordinarily powerful in statistics . One downside is that most of the time you cannot get data from the entire population; you usually only get it from a sample. Over time, people realized that samples were typically less variable than their populations, and dividing by the number of data points was consistently underestimating the true variance of the population. In other words, if is the size of the sample, then multiplying the sum of the square differences by makes the variance too small. Research and theory progressed until it was realized that multiplying the sum of the square differences by made the fraction slightly larger and properly estimated the variance of the population. Thus, there are two ways to calculate variance, one for populations and one for samples.
::这种方法在统计中显得异常强大。 一个不利因素是大部分时间你无法从全部人口获得数据,通常只能从抽样中获得数据。 随着时间的推移,人们意识到样本通常比其人口变化较少,而除以数据点数,总是低估了人口的真正差异。 换句话说,如果样本的大小为 n,那么将平方差之和乘以1n,那么差异就太小了。 研究和理论的进展一直到人们认识到将平方差之和乘以1n-1使小点数略微增加并适当估计人口差异。 因此,有两种方法可以计算差异,一种是人口差异,另一种是抽样差异。Hey, wait, by squaring the differences, doesn't that mean the units are squared? What if I want to describe the spread in the regular units? Should I just take the square root of the variance?
::嘿,等等,通过缩小差异,这不意味着单位是平方的吗?如果我想描述常规单位的分布,那怎么办?我是否应该只选择差异的平方根?
This is why the Greek letter lowercase sigma, , is used for standard deviation of a population (which is the square root of the variance), and is the symbol for variance of a population. The letters and are used for sample standard deviation and sample variance. The Greek letter mu, , is the symbol used for mean of a population, while is the symbol used for mean of a sample.
::这就是为什么希腊字母小写 sigma, QQ, 用于人口的标准偏差( 差异的平方根) , 而 QQ2 是人口差异的符号。 字母 s 和 s 2 用于样本标准偏差和样本差异。 希腊字母 mu, 是人口平均值的符号, 而 x 则是样本平均值的符号 。Mean and variance for the population:
::人口平均和差异:x1,x2,x3,...,xn
::1ni=1nxi2=1ni=1n(xi)2Mean and variance for a sample from a population:
::人口样本的平均和差异: x1,x2,x3,...,xm
::x 1mi=1mxis2=1m-1i=1m(x x)2Variance is a measure of the spread of data. The bigger the variance, the more spread out the data points.
::差异是衡量数据分布的尺度。差异越大,数据点的分布越大。The following video explains how to find the variance of a set of data:
::以下视频解释如何找到一组数据的差异:Play, Learn, and Explore with Variance:
::使用差异来玩、学习和探索:Examples
::实例Example 1
::例1Calculate the variance and mean for rolling a fair, six-sided die.
::计算一个公平、六面死亡的 变化和平均值。Solution:
::解决方案 :Since the population for a six-sided die is entirely known, you would use the population variance.
::由于六肢死亡的人口是众所周知的,你将使用人口差异。Example 2
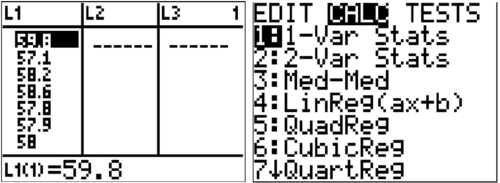
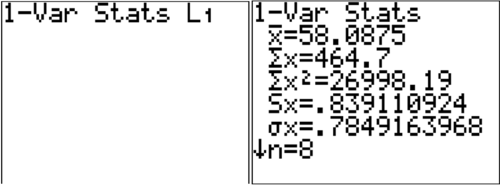
::例2Calculate the mean and variance of the following data sample of lap times:
::计算下列圈间数据样本的平均值和差异:59.8, 57.1, 58.2, 58.6, 57.8, 57.9, 58.0, 57.3.
Solution:
::解决方案 :
::X 18(59.8+57.1+58.2+58.6+57.8+57.9+58.80+57.3)=58.0875This is a sample , so you should use the sample variance formula.
::这是样本, 所以您应该使用样本差异公式 。
::s2=18-1}[(x) 598.8]2+(x) 58.8)2+2(x) 58.22+(x) 58.6)2+(x) 2+(x) 57.8)2+(x 57.9)2+(x 57.3.2)2+(x)2+(x)+17[(x) 7125)2+0.98752+(0.98752+(-0.125)2+(x)2+(x)2.8752+(x)0.8752+0.8752+0.8752+0.8752] +17[2.9327+0.9751+0.0126+0.2626+0.0826+351+0.0076+0.6201] +[4.9288]17[4.988]+_0.7041]Example 3
::例3Use a calculator to calculate the variance from Example 2.
::使用计算器计算示例2的差异。Solution:
::解决方案 :To calculate variance on a TI-83/84 calculator, enter the data in a list, choose 1-Var Stats, and run the 1-Var Stats on the list you entered the data.
::要计算 TI-83/84 计算器的差异,请在列表中输入数据,选择1-Var Stats,并在您输入的数据列表中运行1-Var Stats。
The two outputs that are important for you to interpret are:
::两项产出对于你的解释很重要,它们是:
::Sx = 0.839110924 和 x = 0.7848136868。The calculator does not know whether the data is a population or a sample, so it produces both. Since this problem is about a sample, the number of interest is . The calculator produces standard deviation. You need to square that number to produce the appropriate variance.
::计算器不知道数据是人群还是样本, 所以它同时产生。 由于这个问题涉及样本, 利息数量是 Sx 。 计算器产生标准偏差。 您需要平方该数字才能产生相应的差异 。The following video explains how to calculate statistics in the free online calculator Desmos:
::以下影片解释如何计算免费在线计算器Desmos的统计数字:Example 4
::例4Recall the problem from the Introduction: What are the mean and variance for the following sample test scores taken from a larger student population?
::回顾导言中的问题:从更多学生中抽取的下列抽样测试分数的平均值和差异是什么?75, 73, 78, 90, 60, 51, 87, 79, 80, 77
Solution:
::解决方案 :The mean of the test scores is 75. The variance is calculated by taking the difference of each number from the mean, squaring, and summing these differences.
::测试分数的平均值为75。 计算差异的方法是,将每个数字与平均值的差数、差数和这些差数之间的差数进行权衡。Since the data is a sample, you divide the sum by one fewer than the number of terms.
::由于数据是样本,所以总和除以比条件数少一分。If you knew the variances for two samples, each from a different group, you could quickly determine which group had test scores that were more spread out.
::如果你知道两个样本的差异,每个样本来自不同的组, 你可以很快地确定哪个组的测试分数比较分散。Example 5
::例5Calculate the standard deviation for the following six numbers by hand. Assume the numbers are a population.
::手工计算以下六个数字的标准偏差。 假设数字是人口。2, 4, 6, 8, 12, 19
Solution:
::解决方案 :Example 6
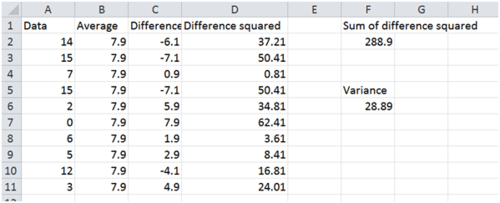
::例6Use an Excel spreadsheet to organize your calculations for computing the variance of the numbers below. Assume these numbers are a true population.
::使用 Excel 电子表格来组织您计算以下数字差异的计算。 假设这些数字是真实的数字 。14, 15, 7, 15, 2, 0, 6, 5, 12, 3
Solution:
::解决方案 :After entering the data in a column, you can use the power of the embedded programming of the spreadsheet to make a 2nd column of just the average.
::在将数据输入一列后,您可以使用电子表格嵌入式编程的功率,使第二列仅为平均值。-
The average command is: "
"
::平均命令是:"=平均(A2:A11)"
You can subtract one cell from another cell to find the difference. You can then square the difference to find the difference squared. You can then sum these values using the sum command.
::您可以从另一个单元格中减去一个单元格以找到差数。然后,您可以对差数进行平方以找到差数。然后,您可以使用和数命令将这些值相加。-
The sum command is: "
"
::总和命令是: "=总(D2:D11)"
Finally, just divide the sum by the number of observations (which is 10) to get the variance.
::最后,为得出差异,将总和除以观测次数(即10)即可。Summary
::摘要-
Variance
is a measure of how spread out the data are.
::差异是衡量数据分布的尺度。 -
The square root of the variance is the
standard deviation
.
::差异的平方根是标准偏差。 -
Both the variance and the standard deviation can be calculated from a
sample
or from the whole
population
. The formulas are slightly different in each case, so it is important to know whether your data is just a sample or is from the whole population.
::差异和标准偏差都可以从抽样中或从全部人群中计算出来。 公式在每种情况下略有不同, 所以重要的是要知道您的数据是样本还是来自全部人群。 -
The
absolute deviation
is the sum total of how different each number is from the mean.
::绝对偏差是每个数字与平均值之差的总和。 -
The
mean absolute deviation
is an alternate measure of how spread out the data are. While this method might seem more intuitive, in statistics it has been found to be too limited and is not commonly used.
::绝对偏差是衡量数据分散程度的另一种方法。 虽然这种方法看起来更直观,但在统计中发现它太有限,不常用。 -
Mean and variance for the population:
::人口平均和差异:x1,x2,x3,...,xn -
Mean and variance for a sample from a population:
::1ni=1nxxi2=1nni=1n(xi)2 人群样本的偏差: x1,x2,x3,...,xm
::x 1mi=1mxis2=1m-1i=1m(x x)2Review
::回顾1. What are the similarities and differences between standard deviation and variance?
::1. 标准偏差和差异之间有哪些相似之处和不同之处?2. Dataset A has a mean of 30 and a standard deviation of 10. Dataset B also has a mean of 30, but a standard deviation of 2. What does this mean about Dataset A compared to Dataset B?
::2. 数据集A的平均值为30,标准偏差为10。 数据集B的平均值为30,但标准偏差为2。 与数据集B相比,这对数据集A意味着什么?
Calculate the variance of each set of data by hand:
::按手计算每组数据的差异 :3. Sample: 1, 4, 7, 10, 3, 6, 12, 5, 8, 16, 21, 3, 1, 5
::3. 样本:1、4、7、10、3、6、12、5、8、16、21、3、1、54. Population: 23, 27, 19, 24, 20, 22, 31, 30, 28
::4. 人口:23、27、19、24、20、22、31、30、385. Sample: 64, 62, 60, 58, 54, 60, 61, 63, 47, 100, 29, 59
::5. 抽样:64、62、60、58、54、60、61、63、47、100、29、59
Calculate the variance of each set of data using your calculator. Compare your answers to your answers to 3-5.
::使用您的计算器计算每组数据的差异。 比较您的答复与您的答复到 3-5 。6. Sample: 1, 4, 7, 10, 3, 6, 12, 5, 8, 16, 21, 3, 1, 5
::6. 样本:1、4、7、10、3、6、12、5、8、16、21、3、1、57. Population: 23, 27, 19, 24, 20, 22, 31, 30, 28
::7. 人口:23、27、19、24、20、22、31、30、388. Sample: 64, 62, 60, 58, 54, 60, 61, 63, 47, 100, 29, 59
::8. 抽样:64、62、60、58、54、60、61、63、47、100、29、599. If , what is the population standard deviation?
::9. 如果0.12=16,人口标准差是多少?
10. Which dataset has the largest standard deviation?
::10. 哪个数据集的标准偏差最大?- 10 10 10 10 10
- 0 0 10 10 10
- 0 9 10 11 20
- 20 20 20 20 20
11. What will a large variance look like on a histogram? What will a small variance look like on a histogram?
::11. 直方图上的大差异将是什么样子?直方图上的小差异将是什么样子?直方图上的小差异将是什么样子?12. You find some data organized in a bar graph. Could you calculate the variance of this data? Explain.
::12. 在条形图中找到一些数据。您能否计算此数据的差异? 解释 。13. A sample set of 20 exam scores is 67, 94, 88, 76, 85, 93, 55, 87, 80, 81, 80, 61, 90, 84, 75, 93, 75, 68, 100, 98. Calculate the mean, variance, and standard deviation for this data.
::13. 一组20分的抽样考试分数为67、94、88、76、85、93、55、87、80、81、80、61、90、84、75、93、75、68、100、98。14. All of Mike's game scores are 1, 1, 2, 10, 12, 1, 9, 6, 7, 8, 4, 3, 4, 1, 4, 1, 6, 7, 11, 5. Calculate the mean, variance, and standard deviation for this data.
::14. 迈克的比赛分数都是1、1、2、10、12、1、9、6、7、8、4、4、4、4、4、1、1、6、7、11、5,计算这些数据的平均值、差异和标准差。15. Why can't you always calculate the population variance and standard deviation? Why do you sometimes have to calculate the sample variance and standard deviation?
::15. 为什么你不能总是计算人口差异和标准偏差?为什么有时还要计算抽样差异和标准偏差?Review (Answers)
::回顾(答复)Please see the Appendix.
::请参看附录。 -
The average command is: "
"