3.6 调换函数-interactive
Section outline
-
The Purpose of This Lesson
::本课程的目的In this lesson, you will use composite functions to transform functions. Your work will lead to a greater understanding of quadratic functions. You'll explore vertical and horizontal shifts of functions. You will apply shifts to a variety of function types, learn to recognize shifts in equations, and graph the results efficiently.
::在此课程中, 您将使用复合函数来转换函数。 您的工作将使得您对二次函数有更好的理解。 您将探索函数的垂直和水平变化。 您将应用转换到各种函数类型, 学习识别方程的转变, 并高效地绘制结果图 。
Activity 1 : Composites of Polynomial and Linear Functions
::活动1:多元函数和线性函数的复合体Example 1-1
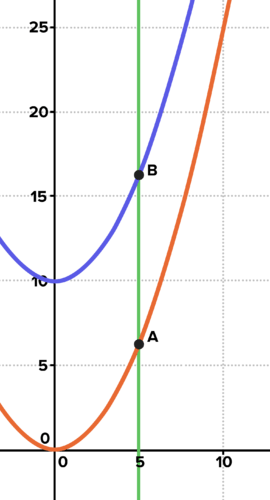
::例1-1The height of an object as a function of time is given by the equation where a represents acceleration in meters per second, per second. A balloon accelerates skyward at 0.5 meters per second, per second. Create a function giving the height of the balloon as a function of time. The height of a drone documenting the balloon's ascent is always 10 meters more than the height of the balloon. Create a function for the height of the drone as a function of the height of the balloon. Create a composite function for the height of the drone. Graph both. How high are each at the 5-second mark? Will the drone and the balloon ever collide? Why or why not? Will the graphs of their heights as a function of time ever intersect? Why or why not?
::以时间函数计算对象的高度由 公式 f( x) = 12ax2 表示加速度, 以每秒每秒每米计。 气球加速向天, 每秒每秒每秒0. 5 米。 创建一个函数 f 表示气球高度是时间函数。 记录气球高度的无人驾驶飞机的高度总是比气球高度高10 公尺。 以气球高度函数的形式为无人驾驶飞机高度创建一个函数 g 。 为无人驾驶飞机高度创建一个复合函数。 两者均图 。 在5 秒标记时, 每个人的高度都有多高? 无人驾驶飞机和气球会碰撞吗? 为什么不是? 它们高度的图表是否会作为时间函数相互交错? 为什么或为什么不相交错?Solution: The height of the balloon is given by
::解析度: 气球的高度由 f( x) = 14x2 给出 。The drone's height is always 10 meters more than the balloon's, so t he height of the drone relative to the height of the balloon is
::无人驾驶飞机的高度总是比气球高10米, 所以无人驾驶飞机相对于气球高度的高度是 g(x)=x+10。The height of the drone as a function of time is given by The function adds 10 to the height returned by the function
::g(f(x) 给出了无人驾驶飞机作为时间函数的高度。 函数 g 在函数 f 返回的高度上加上 10 。
::g(f(x)) =14x2+10From the graph and by substitution, at 5 seconds:
::从图表和替代图中,5秒后:
::f(5)=614米g(f(5))=g(6.25)=16.25米The graphs of the heights of the two objects as a function of time do not intersect because they will never have the same height at the same time. This demonstrates that the actual drone and balloon will not collide because they are never at the same height at the same time either.
::两个天体的高度作为时间函数的图形不会相互交叉, 因为它们永远不会同时有相同的高度。 这显示实际的无人机和气球不会相撞, 因为它们也从来没有同时处于同一高度 。The drone and balloon will not collide, because they are never at the same height at the same time. Interactive
::交互式互动This interactive features a function a function and a composite Use the interactive to experiment with different parameters for the given functions. Predict the graph of the composite, then see if you were correct. Describe in general the results of adding or subtracting a constant to/from a function.
::此交互式功能为函数和复合函数。 使用交互功能对给定函数的不同参数进行实验。 预测复合图形, 然后查看您是否正确。 一般地描述向函数增减常数的结果 。Example 1-2
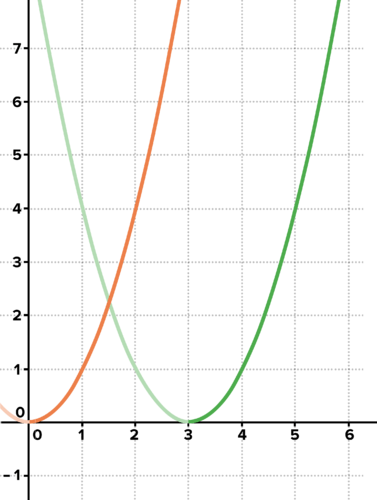
::例1-2A stopwatch is started, and at 0 seconds a balloon is launched such that it accelerates skyward at 2 meters per second per second. A second balloon is launched 3 seconds later with the same acceleration. Create a function for the height of the first balloon as a function of time. Create a function that relates the flight time of the second balloon as a function of the flight time of the first, as recorded on the stopwatch. Create a composite function for the height of the second balloon as a function of the time on the stopwatch. Graph both. When does each balloon reach the 90 meters?
::启动一个秒表, 0秒时发射一个气球, 使气球以每秒2米的速度向天加速。 第二个气球以同样的加速度在3秒后发射。 创建第一个气球高度的函数作为时间的函数。 创建一个函数, 将第二个气球的飞行时间作为第一个气球飞行时间的函数联系起来, 记录在手表上。 为第二个气球高度创建一个复合函数, 以时表上的时间函数向天加速2米/秒。 绘制两个数字图。 每个气球何时达到90米?Solution: The time on the stopwatch is The equation for the height of the first balloon as a function of time is
::解析度: 秒表上的时间是 x。 第一个气球作为时间函数高度的方程式是 f( x) =x2 。The flight time for the second balloon is always 3 seconds less than the flight time for the first,
::第二个气球的飞行时间总是比第一个气球的飞行时间少3秒,g(x)=x-3。Both balloons have the same acceleration, but the second balloon starts later, so it must take as an input instead of So the composite which models the height of the second balloon as a function of the time on the stopwatch is
::两个气球的加速度相同,但第二个气球的加速度较晚开始,因此它必须用x-3作为输入,而不是x。因此,用来模拟第二个气球高度的复合体是 f(g(xx))=(x-3)2。For our previous composite of a quadratic function and a linear function , the linear function was the "outer" function in the composition. In this case, the linear function is the "inner" function in the composition.
::对于我们以前的二次函数和线性函数组合,线性函数是组成中的“外”函数。在这种情况下,线性函数是组成中的“内”函数。A graph illustrating the first few seconds of each balloon's travel. Notice that the green curve, representing the 2nd balloon, is shifted to the right since it started later. Also, both curves are faded on the left, since negative times are not applicable. Note that the graph is shifted to the right to accommodate the late start for the second balloon. To determine when the first balloon reaches 90 meters, solve:
::请注意,图被移到右侧以容纳第二个气球的延迟启动。 要确定第一个气球何时达到90米, 请解答 :
::x2=90x =310x =9.5orx =9.5x =9.5x =9.5x 9.5秒To determine when the second balloon reaches 90 meters, solve:
::确定第二个气球何时达到90米 解答:
:x-3)2=90x-39x=3+90orx=3-90x=3+310orx=3-310x12.5orx=6.5x12.5秒
Note that there were two possible solutions in each case, but only positive values are in the practical domain .
::请注意,每种情况下都有两种可能的解决办法,但实际领域只有积极价值。Interactive
::交互式互动The interactive features a function a function and a composite Experiment with the parameters for the functions. Predict the graph of the composite and see if you were correct. Describe in general the result of adding or subtracting a constant to/from in a function.
::交互特性为 f 、 a 函数 g 和 a 复合 fg 。 以函数参数进行实验。 预测复合图并查看您是否正确。 一般地描述函数中向 x 增减常数的结果 。Work it Out
::工作出来-
Usain Bolt is the world record holder in the 100-meter dash. His acceleration out of the starting blocks is 9.5 meters per second, per second.
-
Create a function for his
distance
as a function of time If he were able to maintain this
rate
of acceleration.
::如果他能够保持这种加速率,则可以按时间函数为他的距离创建函数。 -
Based on this model, how long would it take him to
run
100 meters? A camera slides along a rail 5 meters in front of Bolt as he is running.
::根据这个模型,他跑100米需要多长时间? -
Create a function for the camera's position relative to Bolt's position.
::创建相机位置相对于 Bolt 位置的函数 。 -
Create a composite function that models the position of the camera as a function of time.
::创建复合函数,将相机的位置作为时间函数来建模。
::Usain Bolt是100米破碎时的世界记录持有者。 他从起始区块加速的速度是每秒9.5米,每秒9.5米。 如果他能够保持这种加速速度, 创建他的距离函数作为时间函数。 根据这个模型, 他要运行100米需要多长时间? 一部摄像机在Bolt运行时沿着一条5米长的铁路滑动。 为相机的位置相对于 Bolt 的位置创建一个函数。 创建一个复合函数, 将相机的位置作为时间函数来模拟 。 -
Create a function for his
distance
as a function of time If he were able to maintain this
rate
of acceleration.
-
Jill is running at 4 meters per second. Gary also runs at 4 meters per second but gets a 10-meter head start.
-
Create a function for Jill's distance as a function of time.
::创建 Jill 距离函数作为时间函数 。 -
Create a function for Gary's distance relative to Jill's distance.
::创建 Gary 相对于 Jill 距离距离的距离函数 。 -
Create a composite function for Gary's distance as a function of time.
::创建加里距离的复合函数作为时间函数。
::吉尔以每秒4米的速度运行。 Gary 也以每秒4米的速度运行, 但头头开始10米。 创建吉尔距离的函数作为时间函数。 创建加里距离相对于吉尔距离的函数。 创建加里距离的复合函数作为时间函数。 创建加里距离的复合函数作为时间函数 。 -
Create a function for Jill's distance as a function of time.
Interactive
::交互式互动Use the following interactive to explore vertical and horizontal shifts by modifying the parameters of the different functions being composed.
::通过修改组成不同职能的参数,使用以下互动方式探讨纵向和横向转移。Composites of Polynomial and
::多面合成和多面合成Given a polynomial function and a linear function
::给定一个多边函数 f( x) 和直线函数 g( x) :-
The composite
that is,
is a vertical shift of
by
units.
::复合g(f(x)x),即f(x)+a,是单位F的垂直移动。 -
The composite
that is,
is a
horizontal shift
of
by
units.
::复合f(g(x)x),即f(x)-a),是单位的f水平移动。
Activity 2 : Graphing Vertical and Horizontal Shifts of Parabolas
::活动2:绘制Parabolas垂直和水平变化图Work it Out
::工作出来-
Given
write the function and graph each of the following:
::给定 f( x) =x2, g( x) =x+4 和 h( x) =x- 7, 写下函数并绘制以下各图 :
:-
For each of the quadratics in the last problem, write the domain and
range
. What was the point featuring the lowest
-value for each function? Why?
::对于最后一个问题中的每个二次方块, 请写入域和范围。 每个函数的最小 y 值代表什么 点 ? 为什么 ? -
Given a function
state the domain and range. What are the
coordinates
of the point featuring the lowest
-value for the function? Why?
::给定函数 f( x) =( (x-h) 2+k) , 请说明域和范围。 显示函数最小 y 值的点的坐标是什么? 为什么? -
The graph of a quadratic function is called a
parabola
and the lowest
-value is the
vertex
. What is the vertex of the parabola
::二次函数的图形称为抛物线, 最低的 Y 值是顶点。 抛物线 y=x2 的顶点是什么 ?
Interactive
::交互式互动Use the interactive to s hift the parabola by moving the vertex.
::使用交互程序移动顶点以移动抛物线。Vertical and Horizontal Shifts of Quadratic Functions
::二次曲线函数的垂直和水平垂直移动A quadratic of the form represents a transformation of such that:
::g(x) = (x-h) 2+k 的方形表示 f(x) = x2 的变形,其变形如下:-
has been shifted vertically
units.
::f 已垂直移动k单位。 -
has been shifted horizontally
units.
::f 已横向移动h单位。 -
The
vertex, or
the lowest
-value, is
::顶点或最低的 Y 值为 (h.k.) 。
Interactive
::交互式互动Vertical and horizontal shifts of functions are analogous to translations in geometry. When translating a polygon along a vector , the polygon is moved the length of the vector, in the direction of the vector. Just as a function is composed in algebra, you can compose translations in geometry. Use the interactive below to modify the polygon and the vectors and discuss the following questions.
::函数的垂直和水平移位与几何中的翻译相似。在沿矢量翻译多边形时,多边形向向矢量方向移动矢量长度。正如函数以代数组成,您也可以在几何中组成翻译。使用下面的交互作用来修改多边形和矢量,并讨论下列问题。-
Describe the vectors. Describe how the coordinates of the
vertices
of the image are different from the coordinates of the original.
::描述矢量。描述图像顶端的坐标与原始坐标有何不同。 -
Is the image congruent to the original? How do you know? How is this analogous to the relationship between a parabola and its image after vertical and horizontal shifting?
::图像是否与原始图像一致? 你怎么知道? 这与抛物线与垂直和横向移动后的抛物线及其图像之间的关系有何相似之处? -
To translate polygons, focus on translating the vertices. To translate parabolas, what point can
you
focus on to accomplish vertical and horizontal shifts? Explain.
::要翻译多边形, 重点是翻译顶点。 要翻译parabolas, 您能够关注什么点来完成垂直和水平的移动 ? 解释 。
The vertices of a polygon can be used to orient ourselves during a translation. After all, every point on the polygon also gets translated, but you don't need to translate every point in order to graph the image of the translation. If you translate the vertices, you can connect the vertices and the entire polygon has been translated. In the same way, you can shift a parabola vertically and horizontally by moving the vertex. But how can you graph the resulting parabola so that it has the same shape?
::多边形的顶点可以用来在翻译过程中引导我们自己。 毕竟, 多边形上的每个点也会被翻译, 但是您不需要为绘制翻译图像而翻译每个点。 如果您翻译了顶点, 您可以将顶点和整个多边形都翻译了起来。 同样, 您也可以通过移动顶点来垂直和水平地移动抛物线。 但是, 您如何用图表绘制由此产生的parbola, 使其形状相同 ?Example 2-1
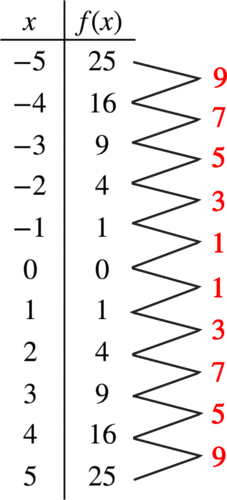
::例2-1Consider the function Complete a table of values of integers such that Graph. Sketch triangles between consecutive points in the table. What do you observe? Directly from the given graph, shift this quadratic vertically and horizontally and g raph the result. Do not make a new table of values. Write the equation for the new function you graphed.
::函数 f( x) =x2. 考虑函数 f( x) =x2. 完成一个整数表, 其数值为 5 =x=5. 图形 。 表格中连续点之间的折叠三角形。 您观察到什么? 直接从给定的图形中, 垂直和水平地移动此二次方形, 并将结果图形化 。 不要创建新的数值表 。 为您绘制的新函数写入方程式 。Solution:
::解决方案 :Because the difference between consecutive -values in the table is 1, the difference between corresponding -values is the slope of the line connecting consecutive points. From an of 0 and increasing, these differences are 1, 3, 5, 7, and so on. The graph is symmetrical across the -axis for -values decreasing from 0.
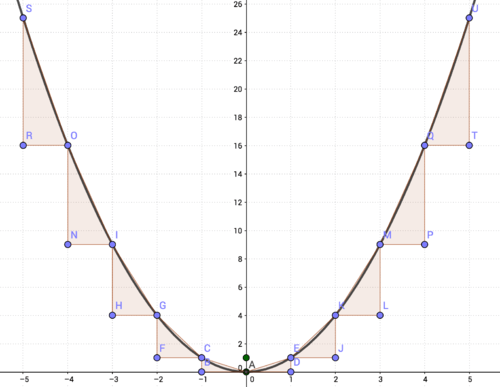
::由于表中的连续轴值差异为 1, 对应的 Y 值差异是连接连续点的线的斜坡。 从0 的 Anx 和 不断增长的 , 这些差异为 1 、 3 、 5 、 7 等。 图表对称于 X 值从 0 下降的轴。To shift this quadratic vertically and horizontally, move the vertex to the desired location. From the vertex, use the same slope triangles as the original to graph additional points. The -coordinate of the vertex gives you the line of for the parabola.
::要垂直和水平移动二次曲线, 请将顶点移动到理想的位置。 从顶点, 请使用与原始相同的斜度三角形来绘制额外点的图形。 顶点的 x 坐标为 parbola 提供线条 。Interactive
::交互式互动Use the interactive below to explore vertical and horizontal shifts of parabolas. Use the vector to determine the shift. Use the slider to change the parameter of the original parabola. Compare the slopes between points shown on the original parabola to those of the image after translation. Explore and explain how changing the parameter impacts the graph of the original parabola. Specifically explore how changing impacts the vertex, domain, range, and the slope triangles shown. Does changing this parameter preserve the "shape" of the parabola? Why or why not? Do horizontal and vertical shifts preserve the "shape" of the parabola? Why or why not?
::使用下面的互动来探索 parabolas 的垂直和水平移动 。 使用矢量来决定该移动 。 使用滑动器来修改原抛物线的参数 。 比较原抛物线上显示的点与翻译后图像显示的点之间的斜度 。 探索并解释参数如何改变影响原始抛物线的图 。 具体探索一个变化如何影响所显示的脊椎、 域、 范围以及斜坡三角 。 更改该参数是否保留 parbola 的“ 形状 ” ? 为什么或为什么没有? 横向和垂直移动是否保护 parbola 的“ 形状 ” ? 为什么或为什么没有?Graphing Vertical and Horizontal Shifts of Parabolas
::Parabolas 垂直和水平变化图Given the graph of a parabola
::参照抛物线(f)的图示:-
Find the vertex and shift it.
::找到顶部并移动它。 -
Using consecutive integer
-values on either side of the line of symmetry, find the difference in
corresponding
-values. This can be visualized with slope triangles.
::使用对称线两侧的连续整数 x 值, 找到相应的 y 值的差数。 这可以用斜度三角形可视化 。 -
Use the same slope triangles to graph additional points on the new parabola.
::使用相同的斜度三角形绘制新抛物线上的额外点。
Activity 3 : Graphing Vertical and Horizontal Shifts of Other Function Types
::活动3:其他职能类型纵向和横向变化图Interactive
::交互式互动Use the interactive below to shift other types of functions by moving the vertex point.
::通过移动顶点,使用下面的交互功能来改变其他类型的函数。Work it Out
::工作出来-
Graph
and
Use a table, if needed, or graph
and then graph
directly by shifting the vertex and using the characteristics of
to guide your graph of
Are distances between corresponding points on each graph preserved after vertical and horizontal shifts? Explain.
::图表 f(x) x 和 g(x) x+46. 必要时直接使用表格或图表f ,然后直接使用图形g ,通过移动顶点并使用 f 的特性来指导您的 g 图表。 每个图表上对应的点之间的距离是否在垂直和水平移动后得到保留? 解释 。 -
Graph
and
Are distances between corresponding points on each graph preserved after vertical and horizontal shifts? Explain.
::图f(x)=12x和g(x)=12x+35. 每个图表对应点之间的距离在垂直和水平移动后是否保留?解释。 -
Graph
Modify the equation for the function so that it is shifted vertically and horizontally. Graph the new function.
Explain
the process you used.
::图f(x)=x. 修改函数的方程式,使其垂直和水平移动。图解新函数。解释您使用的流程。 -
Complete the table below to graph the rational function
Does the function return a
-value for
Why or why not? Is there any value for
that returns a
-value of 0? Why or why not? Try to solve the equation
What happens? How are your answers to the previous questions
evident
in the graph? What is the domain and range of this function? Explain. Use your existing graph to graph
Explain the process you used.
Give
the domain and range of
::完成下面的表格来绘制 y1 = 10x 的合理函数。 此函数是否返回 x= 0 的 Y 值? 为什么或为什么? x 返回 0 的 Y 值是否有任何值? 为什么或为什么不? 尝试解析 等式 10x= 0 。 发生什么 ? 您对前几个问题的答案如何? 此函数的域和范围是什么? 解释一下。 使用您现有的图表来图形 y2= 10x-7 - 3 解释您使用的程序。 给出新函数的域和范围。 解释 。
::Xy - 50 - 20 - 10 - 5 - 5 - 2 - 1 - 121.21215102050Summary
::摘要Given a function
::给定函数 f( x) :-
represents a translation of
::g(x) =f(x-h)+k 表示 f(x) 的翻译。 -
is a vertical shift by
units and a horizontal
shift
by
units.
::g(x) 是由 k 单位组成的垂直移动和由 h 单位组成的水平移动。 -
Many characteristics of functions are preserved after translation, and these can be used to ease graphing of the image of a function after translation.
::翻译后保留了许多功能的特性,这些特性可用来方便翻译后功能图像的图形绘制。
PLIX Interactive
::PLIX 交互式互动 -
Usain Bolt is the world record holder in the 100-meter dash. His acceleration out of the starting blocks is 9.5 meters per second, per second.