3.8 指数模型-interactive
章节大纲
-
The Purpose of This Lesson
In this lesson, you will use to model scenarios featuring growth and decay.
::在这个教训中,你将用来模拟增长和衰变的假想。
Activity 1: Geometric Sequences
::活动1:几何序列Work it Out
::工作出来Each of the following scenarios can be modeled with a sequence. Find the explicit formula for the sequence and answer the given questions.
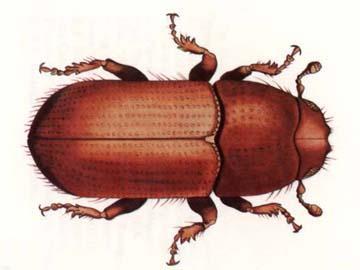
::以下每种情景都可按顺序建模。 找到序列的清晰公式并回答给定的问题 。A pine beetle -
The pine bark beetle in C
alifornia
is devastating forests and increasing its reach. Emilia the scientist is responsible for tracking the area of a national forest that has been infected. She measures the extent at the end of the summer, when the beetle's ravages become most evident. In the first year of her
survey
, the beetle has infected 12 square miles of forest. In the next year, the beetle has infected 15.6 square miles. In the next year, 20.28 square miles.
Below
is the data for the infected area that Emilia collects over 5 years of study.
-
Determine if the sequence is arithmetic or geometric. Explain your choice.
::确定序列是算术还是几何。 请解释您的选择 。 -
Write the explicit formula for the sequence. Use the formula to predict the area of forest decimated by the 10th year.
::写入序列的清晰公式。 使用公式来预测在10年前被毁灭的森林面积 。 -
The multiplier shows that the infected area increases by a percentage every year. What is that percentage? Explain.
::乘数表明,受感染地区每年增加一个百分比。这个百分比是多少?请解释。 -
is when values are increasing exponentially. Exponential
decay
is when values are decreasing exponentially. Is this growth or decay? Explain.
::值是指数增长。 指数衰减是指数下降。 这是增长还是衰减? 解释 。
::加利福尼亚的松树养蜂虫是毁灭性的森林,并增加了其覆盖范围。 科学家艾蜜莉亚负责跟踪被感染的国家森林面积。 她测量了夏季末、 甲虫的破坏最为明显时的范围。 在调查的第一年, 甲虫感染了12平方英里的森林。 下一年, 甲虫感染了15.6平方英里。 在下一年, 20.28平方英里。 下面是艾蜜莉亚收集的受感染区域的数据, 超过5年的研究数据。 {12, 15.6, 20.28, 26.364, 34.2732} 确定顺序是算术还是几何分法。 解释你的选择。 写出序列的明确公式。 使用公式来预测被第10年毁灭的森林面积。 乘数显示, 受感染区域每年增加一个百分比。 这个百分比是多少? 解释。 当值以指数指数增长时, 显性衰减是指数下降的时候。 这是这个增长还是衰减? 解释 。 -
Determine if the sequence is arithmetic or geometric. Explain your choice.
-
Haley's comet is about 10 miles long, 5 miles wide, and 5 miles deep.
It orbits the sun about every 75 years.
Its mass after its last pass around the sun was about
kilograms. As it approaches the sun, the heat of the sun burns away the comet, resulting in loss of mass. The mass lost on the last passage was about
kilograms per passage.
-
Create two sequences, one geometric and one arithmetic, listing the masses after 5 passes. Which do you think is a more reasonable model and why? Find the explicit formulas for each.
::创建两个序列, 一个几何和一个算术, 在 5 个通过后列出质量 。 您认为哪个是更合理的模型 和为什么 ? 为每个选择找到明确的公式 。 -
For the arithmetic sequence, write and solve an
equation
to determine which pass will reduce the mass of the comet to 0.
::对于计算序列,请写和解析一个方程,以确定哪个通过会将彗星质量减为0。 -
For the
geometric sequence
, use your calculator to guess and approximate the number of passes to
reduce
Haley's mass below that of the Empire State Building (about
kilograms).
::对于几何序列,请使用您的计算器来猜测和估计海利的通过次数,以降低海利的质量,使其低于帝国大厦的质量(约3.3×10⁸千克)。 -
For the geometric sequence, is the multiplier
greater than
or
less than
1? Why?
W
hat percentage of the comet's mass is lost each year? Explain how you found this value. Is this scenario an example of growth or decay? Explain.
::对于几何序列,乘数大于或小于1? 为什么? 彗星质量每年损失的百分比是多少? 请解释您是如何找到这个值的。 这是增长或衰变的例子吗? 请解释 。
::Haley 的彗星大约10英里长, 5英里宽, 5英里深。 它每75年绕太阳运行一次。 太阳最后过后的质量大约为2.2×10¹⁴公斤。 当太阳接近太阳时, 太阳的热点会烧掉彗星, 造成质量损失。 最后一个通道上失去的质量约为每个通道5. 7×10¹¹公斤。 创建两个序列, 一个几何和一个算术, 列出5个通道后的质量 。 你认为哪种是更合理的模型和为什么? 找到每个序列的清晰公式? 解释你如何找到这个数值。 对于几何序列, 使用你的计算器来猜测和接近通过次数, 将Haley的重量降低到帝国大厦以下( 约3.3×10⁸公斤图) 。 对于几何序列, 乘数是否大于或小于1? 为什么? 彗星质量的多少百分比每年丢失? 解释你如何找到这个数值? 这个假设是增长或衰败的例子? 解释。 -
Create two sequences, one geometric and one arithmetic, listing the masses after 5 passes. Which do you think is a more reasonable model and why? Find the explicit formulas for each.
-
Colin has opened a restaurant. In its first month in existence, he earns $4,000 in profit. Every month thereafter, his profit increases by 10%. Create the recursive formula for the sequence. Write the first 6
terms
of the sequence. Find the explicit formula. Predict the profit in 60 months. Is this realistic? Why or why not?
::科林开了一家餐馆。 在其存在的第一个月里, 他赚取了4000美元的利润。 之后的每个月, 他的利润将增加10 % 。 创建序列的循环公式 。 写入序列的前6个条件 。 查找明确的公式 。 预测60个月的利润。 这是否现实? 为什么或为什么不现实? -
To track the decline in area of glaciers in Glacier National Park, scientists measure the area of each at the end of the summer. The minimum area of a particular glacier has been tracked for 5 decades. The area of the glacier over time is represented in the sequence below. The units are square meters. Do you think the area is best modeled with an arithmetic or geometric sequence? Explain. Create the explicit formula for the sequence and use it to roughly predict
in which decade
the area of the glacier will decline below the area of a football field (roughly 1000 square meters).
::为了跟踪冰川国家公园冰川面积的下降情况,科学家们在夏季结束时测量每个冰川的面积。 特定冰川的最低面积已经跟踪了50年。 冰川的面积在一段时间内以下面的顺序表示。 单位为平方米。 您认为这个区域最好用算术或几何顺序来模拟吗? 解释一下 。 为这个序列创建明确的公式, 并用它粗略地预测冰川面积在10年内会下降到足球场的下面( 大约1000平方米 ) 。
Exponential Growth and Decay
::指数增长和衰减Given a function or a geometric sequence
::给定函数 f( x) = a(r)x 或几何序列 a= a1(r)n- 1 :-
means an increasing
function
or sequence. The percentage increase is found by subtracting 1 from
This means it is modeling exponential growth.
::r>1 表示增加的函数或序列。百分比增长通过从 r 中减去 1 来发现。 这意味着它正在模拟指数增长。 -
For example, a multiplier of 1.4 means that each
term
is 40% greater than the previous term.
::例如,1.4乘数意味着每个任期比前一任期高出40%。 -
means a decreasing function or sequence. The percentage decrease is found by subtracting
from 1. This means it is modeling exponential decay.
::r < 1 表示一个递减函数或序列。百分比的下降通过从 1 中减去 r 来发现。 这意味着它正在模拟指数衰减。 -
For example, a multiplier of 0.7 means that each term is 30% less than the previous term.
::例如,乘以0.7意味着每个任期比前一任期少30%。
Activity 2: Discrete vs. Continuous Models
::活动2:分立与连续模型Each of the above scenarios was well modeled with a sequence because the domain was restricted to a subset of the natural numbers. For the scientist tracking the beetles, the data only emerges at the end of the summer. For the comet, the mass is measured at the end of each pass. For the restaurant, the profit is measured at the end of each month, and for the glacier, the area is measured at the end of a summer in a given decade. Our data is discrete . If we graph points representing a sequence, these points are not connected. We are not assuming that intermediate -values would produce -values consistent with our model.
::上述每种假设情景都是以一个序列精心建模的,因为域限为自然数字的一个子集。对于跟踪甲虫的科学家来说,数据只在夏季末才会出现。对于彗星,质量在每过一圈的末点进行测量。对于餐馆来说,利润在每月末点进行测量,对于冰川来说,区域是在某个十年的夏季末点进行测量。我们的数据是分解的。如果我们绘制代表一个序列的图形点,那么这些点是没有连接的。我们不认为中间X值会产生与我们的模型相符的Y值。Example 2-1
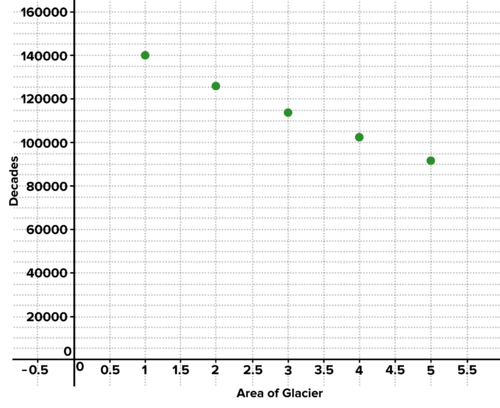
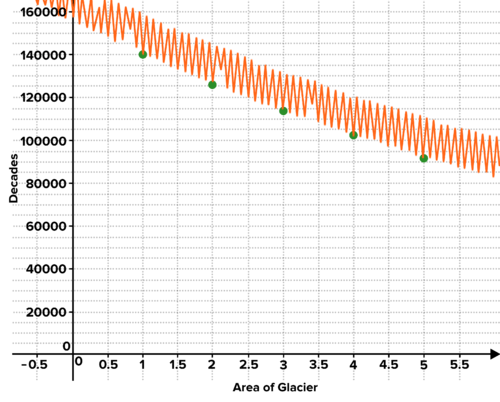
::例2-1Below are two graphs. The first shows the area of a glacier in each decade. What kind of sequence models this scenario? Use the graph to approximate the multiplier and the initial value, and write the formula for the sequence. The second graph shows the area as measured monthly, with the decadal measurements highlighted. Try to explain the variation in the graph. If we want to anticipate the long-term trend in this glacier's area, which graph is better? Why?
::下面是两个图表。 第一个图表显示每十年的冰川面积。 这个假设是什么样的序列模型? 使用这个图表来估计乘数和初始值, 并写出该序列的公式。 第二个图表显示每月测量的面积, 并突出十进制测量值。 尝试解释图形中的变异。 如果我们想要预测这个冰川区域的长期趋势, 哪个图形更好呢? 为什么?The area of a glacier in each decade The area of a glacier each month, with decade periods noted Solution: The first graph tracks the shrinking glacier over a longer period, with measures taken consistently at the end of the summer, when the glacier is at its lowest extent. This allows you to see the trend in the glacial area over decades. If more granular data is collected, you see that the area fluctuates over each year--the area oscillates 10 times per decade. This makes sense because the glacier expands in winter and shrinks in summer, every year. But this data may not be of interest if the goal is to observe the long-term trend.
::解答: 第一个图表在更长的时期内跟踪冰川萎缩, 在夏季末, 冰川处于最低度, 并且采取了一致的措施。 这使得您可以看到冰川面积数十年来的趋势。 如果收集了更多的颗粒数据, 您可以看到每年的冰川面积会波动- 面积每十年波动10倍。 这很有意义, 因为冰川在冬季扩张, 每年夏天缩水。 但是, 如果目标是观察长期趋势, 这些数据可能不感兴趣 。A sequence may be the preferred model here. The initial value is 140,000. Estimating consecutive values and dividing gives us a common ratio of about 0.9. This means the glacier loses 10% of its area every decade. The exponent is because the initial value of 140,000 takes place in year 1.
::这里的顺序可能是首选模式。 初始值为 140,000。 估计连续值和分化的连续值让我们有一个大约0. 9 的共同比率。 这意味着冰川每十年丧失10%的面积。 引号是 n- 1, 因为最初值140,000是在第 1 年发生的。
::an=140,000(0.9)n-1Example 2-2
::例2-2Some scenarios can be modeled with a function that is continuous . This means the domain will be all real numbers in an interval. A car depreciates about 19% in value per year. If Kemba has a car worth $30,000 in year 0 (before any time has passed), create a function that models the value of the car over time. State the domain and range for the function. Use the function to estimate the value of the car after 10 years. Use solving or graphing technology to approximate when the car will have lost half its value.
::可以通过连续的函数模拟某些假设情景。 这意味着域将是一个间隔内的所有真实数字。 汽车每年贬值约19%。 如果 Kemba 的汽车在 0 年价值为 30 000 美元( 任何时间过去之前) , 则创建一个函数来模拟汽车的值。 说明此函数的域和范围。 使用该函数来估计10 年后的汽车值。 使用解析或图形化技术来估计汽车何时会损失一半的价值 。Solution: The initial value is $30,000. Because the car loses 19% of its value every year, the multiplier is 0.81. It is not necessary to shift the function because the initial value occurs in year 0.
::解决方案: 初始值为 30,000 美元。 因为汽车每年损失其价值的19%, 乘数为 0.81 。 没有必要改变函数, 因为初始值发生在 0 年 。
::f(x) = 30 000(0. 81)xThe domain is restricted to all real numbers greater than or equal to 0 because represents time and there is no negative time. The range has a maximum of 30,000, and no minimum, though the value of the car will approach 0.
::域名仅限于所有大于或等于 0 的实际数字, 因为 x 代表时间, 没有负时间 。 该范围最多为 30,000 个, 没有最小值, 尽管汽车的值接近 0 。
::域 : [0, ] Range: (0, 30,000]To determine the value after 10 years:
::为确定10年后的数值:
::f(10)=30,000(0.0.81)10f(10)_______________________________________________________________________________________________________________________________________________________________________________________________________________________________________________________________________________________________________________________________________________________________________________________________________________________________________________________________________________________________________________________________________________________________________________________________________________________________________________________________________________________________________________________________________________________________________________________________________________________To determine when the value is half its current value:
::确定当值为当前值的一半时:
::15 000=30 000(0.81)xSolving this with technology gives:
::以技术解决问题,可以提供:
::x3.3 年PLIX Interactive
::PLIX 交互式互动
Activity 3: Continuous Growth, Continuous Decay
::活动3:持续增长、持续衰减Interactive
::交互式互动Use the interactive to experiment with the difference between discrete and continuous functions. The points shown are a discrete representation of an exponential function . You can experiment with the parameters of the function. As you increase the number of values in the domain, the function looks more and more like a smooth curve.
::使用交互功能来实验离散函数和连续函数之间的差异。所显示的点是指数函数的离散表示。您可以试验函数的参数。随着域内数值的增加,函数看起来越来越像平滑曲线。Work it Out
::工作出来-
Make a table of values and graph the function
Be sure that your table shows a good selection of negative, positive, and fractional values for
Explain why negative
-values return
-values smaller than 4. Use examples to support your explanation. Explain why an
-value of 0 returns
-value of 4. Give the domain and range for the function. Explain why the function never returns a
-value of 0.
::绘制一个数值表格和图表 函数 f( x) = 4( 1.5) x。 请确定您的表格显示 x 的负值、 正值和分数值。 请解释为什么负 x 值返回 y 值小于 4 。 使用示例支持您的解释 。 请解释为什么 0 返回 y 值的 x 值返回 4 。 给此函数的域和范围。 请解释为什么该函数从不返回 Y 值为 0 。 -
A house is worth $156,000. It is appreciating in value at 20% per year. Does the house have a value in fractions of years? Explain. Create a function which models the price of the house over time. Give the domain and range for the function. Use the function to determine the value of the house in 6.5 years. Use graphing or solving technology to determine when the value of the house doubles.
::房屋价值为 156 000 美元, 价值为 每年20% 。 房屋是否有年数的值? 解释 。 创建一个函数, 该函数将房屋的价格随着时间推移而变化。 给出此函数的域和范围 。 使用该函数来确定房屋在6. 5 年中的值 。 使用图表或解析技术来确定房屋的价值何时翻倍 。 -
Solve algebraically for the unknown
variable
:
::为未知变量解析代数 :
::a.500=a(1.2)8b.326=214(b)2c.2=3(b)3d.450=200(b)15-
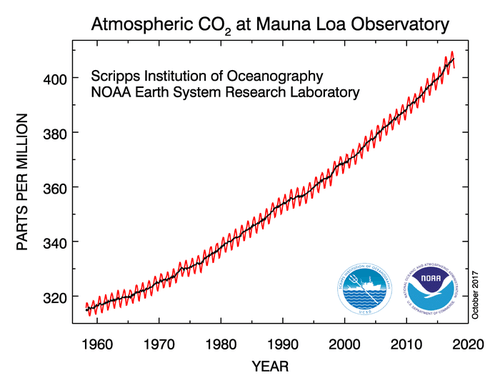
The atmospheric concentration of carbon dioxide has been continuously measured at a station in Hawaii since 1958. The data is shown in the graph below. The
-axis represents the year, and the
-axis represents the corresponding concentration of carbon dioxide, in parts per million. For example, a concentration of 400 parts per million means that for every 1 million molecules in the air, 400 are carbon dioxide. The concentration of carbon dioxide in the March of 1958 was about 316 parts per million. The concentration in March of 2017 was about 407 parts per million. Call the data for March of 1958 the data for year 0. Assuming the growth in carbon dioxide concentration is exponential, write and solve an equation to find the common ratio. Then write the function to model the data. Use your model to
interpolate
the concentration of carbon dioxide in March of 1995. (To interpolate means to predict values between known values.) Compare and contrast your model with the graph shown.
::自1958年以来,在夏威夷的一个站点连续测量了二氧化碳的大气浓度。数据见下图。x轴代表年,Y轴代表相应的二氧化碳浓度,即百万分之一。例如,百万分之400的浓度意味着空气中每100万个分子中就有400个二氧化碳。1958年3月二氧化碳浓度约为每百万分之316。2017年3月的浓度约为每百万分之407。在1958年3月的浓度约为每百万分之407。调用1958年3月的数据为0年的数据。假设二氧化碳浓度的增长是指数化的,写写和解析一个方程式以找到共同比率。然后写此函数来模拟数据。用你的模型在1995年3月将二氧化碳的浓度相互推导出。(用中间计算手段预测已知值之间的数值。)与显示的模型进行比较和对比。
Atmospheric concentration of carbon dioxide in Hawaii since 1958 Summary
::摘要-
Exponential growth and decay can be modeled with geometric sequences and exponential functions.
::指数增长和衰变可模拟几何序列和指数函数。 -
Sequences are best used when the data is discrete, and exponential functions when the data is continuous.
::在数据离散和指数函数连续时,最好使用序列。 -
Multipliers greater than 1 represent growth, and multipliers less than 1 represent decay.
::乘数大于1表示增长,乘数小于1表示衰变。 -
Solving for a variable in the exponent requires the use of solving or graphing technology at this stage, but the algebraic tools will become available to you later in your math career.
::要解决指数中的变量,目前需要使用解析或图形化技术,但代数工具将在数学生涯后期提供给你。
-
The pine bark beetle in C
alifornia
is devastating forests and increasing its reach. Emilia the scientist is responsible for tracking the area of a national forest that has been infected. She measures the extent at the end of the summer, when the beetle's ravages become most evident. In the first year of her
survey
, the beetle has infected 12 square miles of forest. In the next year, the beetle has infected 15.6 square miles. In the next year, 20.28 square miles.
Below
is the data for the infected area that Emilia collects over 5 years of study.