5.3 平均和标准偏离-interactive
Section outline
-
The Purpose of This Lesson
::本课程的目的In this lesson, you will explore methods for describing the center and spread of distributions represented with frequency plots.
::在此课程中, 您将探索描述以频率图表示的分布中心和传播的方法 。Introduction: Frequency Plots
::导言:频率图Frequency plots are powerful tools for visualizing the shape of a distribution , but the center and spread are not immediately visible. In the previous lesson, you calculated the mean and visualized it as a vertical line on the distribution. You also converted frequency plots to relative frequency plots. This enabled you to find the percentage of values between certain intervals.
::频率图是可视分布形状的有力工具, 但中心和传播并非立即可见。 在上一个课中, 您计算了平均值, 并将其作为分布的垂直线。 您还将频率图转换为相对频率图。 这样您就可以在某些间隔间找到数值的百分比 。
Activity 1: Intervals Around the Mean
::活动1:平均间数Example 1-1
::例1-1Below is a frequency plot showing the number of slices of pizzas ordered by each student on a baseball team (only whole slices are ordered). Convert the frequency plot to a relative frequency plot. Find the mean. Graph or visualize the mean as a vertical line on the histogram . Determine the percentage of students that ordered 4, 5, or 6 slices. Approximate the percentage of students that ordered slices within one slice of the mean. Interpret the plot in the context of the scenario.
::下面是一个频率图,显示棒球队每个学生订购的披萨片片数(只订购整片) 。 将频率图转换为相对频率图。 查找平均值。 图表或将平均值作为直方图上的垂直线进行直观分析。 确定订购4、 5或 6片的学生比例。 接近订购切片的学生比例, 在平均值中一个切片中。 在假设情景中解释此图 。Solution: The relative frequency plot has the same shape as the original plot. The mean is 3.12 slices. The percentage of students ordering 4, 5, or 6 slices is The range of values within 1 slice of the mean is where represents the values for the number of slices. This range is roughly equivalent to the interval The percentage of students ordering 2, 3, or 4 slices is The plot is roughly symmetrical and bell-shaped, but perhaps slightly skewed right. One can speculate that either the slices are small or the students are hungry, as a mean of 3.12 slices seems large!
::溶解度: 相对频率图与原始图案的形状相同。 平均值为 3. 12 切片。 订购 4 、 5 或 6 切片的学生比例为 925 = 36%。 1 切片中的值范围为 2. 12 xx = 4. 12, 其中 x 表示切片数的值。 这个范围大致相当于 2 xx+ 4 间距。 订购 2 、 3 或 4 切片的学生比例为 1725 = 68 % 。 这个比例大致对称和钟形, 但也许略微偏斜。 人们可以推测, 切片小或者学生饿了, 似乎3. 12 切片的平均值很大 !Work it Out
::工作出来The following frequency plot shows the distribution of the number of basketballs ordered by the coaches of different middle school teams. Convert the frequency plot to a relative frequency plot. Find the mean. Graph or visualize the mean as a vertical line on the histogram. Determine the percentage of coaches that ordered 4, 5, or 6 balls . Approximate the percentage of coaches that ordered a number within one basketball of the mean. Approximate the percentage of coaches that ordered a number within two basketballs of the mean. Interpret the plot in the context of the scenario.
::下面的频率图显示不同中学生队教练所订购篮球的分布情况。 将频率图转换为相对频率图。 查找平均值。 图表或直方图上将平均值直线直线直观化为垂直线。 确定订购4、 5或 6球的教练比例。 接近在平均篮球中一个篮球中订购一个数的教练比例。 接近在平均两个篮球中订购一个数的教练比例。 在假设情景中解释该图。PLIX Interactive
::PLIX 交互式互动
Activity 2: Standard Deviation
::活动2:标准偏离In the previous example, you provided the percentage of values that were within one basketball of the mean and the percentage of values that were within two basketballs of the mean. This gives a picture of the spread of the data . It tells you if the data is tightly clustered around the mean, or spread widely. In the first example, you gave the percentage of values that were roughly within one slice of the mean. This was also a measure of the spread of the data.
::在上一个示例中,您提供了平均值和平均值中两个篮子中两个篮子中两个篮子中一个篮子中数值的百分比。这提供了数据分布的图示。它告诉您数据是否紧紧围绕平均值,或者是否广泛分布。在第一个示例中,您给出了大致在平均值中一个小块中的数值百分比。这也是数据分布的度量。But these measures of spread were invented to fit the particular problem. It would be useful to have a standardized measure of the spread of a distribution.
::但是,这些扩散措施是设计来适应特定问题的,采用标准化的分布分布衡量标准是有益的。In fact, you already have one such standardized measure of spread. Previously, you made box plots of data sets. The IQR is a measure of the spread of the data. It always shows you the middle 50% of the data around the .
::事实上,您已经有一个这样的标准化的分布度量。 之前, 您做了一组数据集的框块。 IQR 是数据分布的量度。 它总是向您显示数据中间的 50% 。There is a similar measure of spread that is useful for data represented in histograms. It's called the standard deviation . The standard deviation is a measure of the "typical" deviation from the mean for the values in the data set . While the IQR is calculated with the median as a measure of center, the standard deviation is calculated with respect to the mean. The standard deviation is particularly useful for data that is bell-shaped. Standard deviation is as important to the practice of statistics as is to the practice of algebra.
::对于直方图中的数据,也有一个类似的分布度量。 它被称为标准偏差。 标准偏差是衡量数据集中数值平均值“ 典型” 偏离的尺度。 虽然IQR是用中位值作为中位值作为中位值的中间值计算, 但标准偏差是按平均值计算的。 标准偏差对于钟形数据特别有用。 标准偏差对于统计实践和代数实践同样重要。In the following example, you'll learn to calculate, visualize, and interpret it.
::在下面的例子中,你会学会计算, 视觉化和解释它。Example 2-1
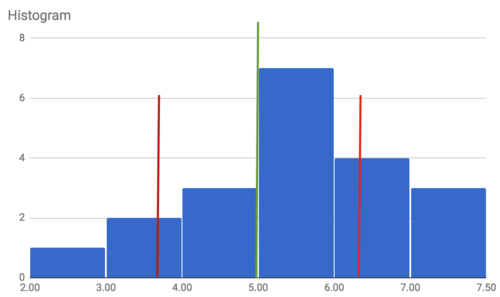
::例2-1Prisha is a middle school student. She counts the number of posters in each teacher's classroom in a school and plots the data in the frequency plot shown below. Find the mean and represent it with a vertical line on the graph. Follow these instructions to calculate and visualize the standard deviation:
::Prisha是中学生。 她计算学校每个教师教室的招贴画数量, 并在下面显示的频率图中绘制数据。 找出平均值, 并在图表上以垂直线代表它。 遵循这些指示来计算和直观标准偏差 :-
For each value, find the square of the difference between the value and the mean.
::对于每个值,找到数值和平均值之间的差数的平方。 -
Find the sum of the squared differences. (Remember, as there are 20 values, there are 20 squared differences.)
::查找正方差的总和。 (记住,有20个值,有20个正方差。 ) -
Divide them by one less than the number of values. (This will be make the result a bit more than the
average
of the squared differences from the mean.)
::将它们除以小于数值数的一。 (这将使结果比平均值的平方差差略多一点。 ) -
Take the square root of this result. This is the standard deviation.
::选择此结果的平方根。 这是标准偏差 。 -
Add the standard deviation to the mean. The result is a value that is one standard deviation above the mean.
D
raw a vertical line on the plot at that value.
::将标准偏差添加到平均值中。结果是一个值是高于平均值的一个标准偏差。在此值的绘图上绘制一条垂直线。 -
Subtract the standard deviation from the mean. The result is a value that is one standard deviation
below
the mean. Draw a vertical line on the plot at that value.
::将标准偏差从平均值中减去。结果是一个低于平均值的一个标准偏差值。以该值在绘图上绘制一条垂直线。
Interpret the plot and the standard deviation in the context of the data and scenario.
::结合数据和假设情况解释绘图和标准偏差。Solution: The mean is 5 posters.
::解决方式:意思是5张海报。
::招贴画和招贴画的差别数字(2-5-2)2=9193(5-3)2=4284(5-4)2=1335(5-5)2=0706(5-6)2=1447(5-7)2=4312The sum of the squared differences is 36. Dividing by one less than the number of values gives The root of this value is about 1.38. This is the standard deviation.
::平方差的总和是36, 差小于36191.89的值数。 值的根值大约是1.38。 这是标准偏差 。One standard deviation above the mean is 6.38 posters. One standard deviation below the mean is 3.62 posters. The interval for values within one standard deviation of the mean is Values of 4 or 5 posters are wholly within one standard deviation of the mean, that's The interval for values between one standard deviation from the mean is larger than
::高于平均值的一个标准偏差是6.38张海报。低于平均值的一个标准偏差是3.62张海报。在平均值的一个标准偏差范围内的值间距是3.62x6.38。4或5张海报的值间距完全低于平均值的一个标准偏差,即1020=50%。与平均值的一个标准偏差之间的值间距大于4x5。Standard Deviation
::标准偏离The standard deviation of a set of values is calculated as follows:
::一组数值的标准偏差计算如下:-
Find the sum of the squared differences of the values from the mean,
::从平均值中查找数值的平方差和, -
Divide by one less than the number of values,
::除以等于数值数, -
Then square rooting the result.
::然后将结果平方根化 。
Work it Out
::工作出来-
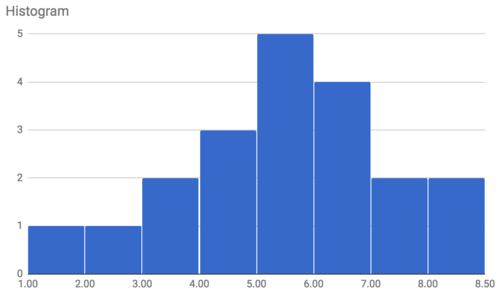
Ira is a university student. He
surveys the number of hours his colleagues work on homework in a week,
and plots the data in the frequency plot shown below. Find the mean and represent it with a vertical line on the graph.
C
alculate and visualize the standard deviation. Interpret the plot and standard deviation in the context of the data and scenario. What percentage of students studied 3, 4, or 5 hours? Approximately what percentage of values were within one standard deviation of the mean?
::Ira是大学生。 他调查了同事一周内做家庭作业的小时数, 并在下面显示的频率图中绘制数据。 查找平均值, 并在图表上用垂直线表示数据。 计算和直观标准偏差。 在数据和假设中解释图和标准偏差。 有多少学生学习了3、 4或5小时? 数值的百分比在平均值的一个标准偏差范围内是多少?
-
Sai is a university student. She surveys the work hours of 20 of
her
peers who work jobs while at university.
Below
are the number of hours each reported working during the week.
Choose a bin size and create
a frequency plot for the data. Find the mean and standard deviation, and represent both on the plot. Interpret the mean and standard deviation in the context of the data and scenario. Approximately what percentage of students were within one standard deviation of the mean? (Use the original data set to determine this.)
::Sai是大学生。她调查了在大学工作的同事中20人的工作时数。以下是每周报告的每个工作时数。选择一个文件夹大小,为数据创建一个频率图。查找平均值和标准偏差,并在图中同时代表两者。在数据和假设中解释平均值和标准偏差。在平均值的一个标准偏差范围内学生的百分比大约是多少? (使用原始数据集来确定这一点)。
20, 10, 15, 14, 17, 19, 25, 27, 31, 30, 7, 9, 14, 21, 27, 31, 38, 16, 12, 17
-
Create a list of 10 numbers between 1 and 10. Determine the mean and standard deviation. Modify your list so that the standard deviation is much larger but the mean is the same. Calculate the standard deviation for the second list. Explain the differences and similarities between the two data sets you created.
::在 1 和 10. 之间创建 10 个数字的列表 确定平均值和标准差 。 修改您的列表, 使标准差大得多, 但平均值相同 。 计算第二个列表的标准差 。 解释您创建的两个数据集之间的差异和相似性 。 -
While the standard deviation is fairly easy to compute by hand, it is more common to use a graphing calculator, a spreadsheet, or other solving technology to speed the calculation of the standard deviation. Use such technology to find the standard deviation for the data set which follows. Determine the percentage of values that are within 1 standard deviation of the mean. Interpret the mean and standard deviation in the context of the data and scenario.
::虽然标准偏差比较容易手工计算,但通常使用图表计算器、电子表格或其他解析技术来加速计算标准偏差。使用这种技术来查找以下数据集的标准偏差。确定在平均值1标准偏差范围内的数值百分比。在数据和假设情景中解释平均值和标准偏差。
Janice is a coffee fanatic. She interviews baristas at 20 coffee shops. She asks each barista how many tattoos they have. The reported number of tattoos is listed below.
::Janice是个咖啡狂热分子,她在20家咖啡店采访了咖啡师。她问每个咖啡师有多少纹身。报告的纹身数量如下。4, 2, 0, 1, 7, 19, 1, 0, 26, 3, 5, 1, 2, 2, 7, 4, 1, 2, 19, 58
-
Francois is a high school student. He wants to compare the distributions of the heights of the players on the basketball teams to those of athletes on the track squad. Here is the data he collects, with heights in centimeters. Find the mean and standard deviation of each. Interpret these statistics in the context of the scenario. For each,
find the
the
percentage
of values that are within one standard deviation of the mean.
::Francois是高中学生。 他想将篮球队球员高度分布与球队运动员高度分布进行比较。 这是他收集的数据, 以厘米计。 找出每个球员的中值和标准偏差。 在情景中解释这些统计数据。 对于每一个球员, 找到在平均值标准偏差范围内的数值百分比 。
Basketball: 182, 187, 189, 756, 193, 197, 191, 206, 201, 178, 177, 179, 176, 169, 161, 163, 167, 200, 201, 206, 208, 197, 194, 178, 187
::篮球:182, 187, 189, 756, 193, 197, 191, 206, 201, 178, 177, 179, 176, 169, 161, 163, 167, 200, 201, 206, 208, 197, 194, 178, 187Track: 145, 165, 152, 153, 187 190, 201, 142, 156, 167, 183, 181, 173, 200, 209, 201, 202, 193, 186, 149, 196, 161, 161, 189, 157
::音轨:145、165、152、153、187、190、201、142、156、167、183、181、173、200、209、201、202、193、186、149、196、161、161、189、157Interactive
::交互式互动Use the interactive to experiment with changing the distribution of a set of values and observing the resulting changes in the mean and standard deviation. Under what conditions is the standard deviation large? Under what conditions is the standard deviation small? Change the values so that the data is skewed left or right. Change the values so that there are likely outliers . Discuss the impacts on the mean and standard deviation.
::使用互动来实验改变一组数值的分布, 并观察由此产生的平均值和标准偏差的变化。 在什么条件下标准偏差是很大的? 在什么条件下标准偏差是很小的? 在什么条件下标准偏差是小的? 改变数值, 使数据向左或向右倾斜。 改变数值, 以便可能出现外差。 讨论对平均值和标准偏差的影响 。PLIX Interactive
::PLIX 交互式互动
Activity 3: The Empirical Rule
::活动3:经验规则In the examples and problems above, you frequently approximated the percentage of values that were within one standard deviation of the mean. The standard deviation measures the typical deviation from the mean. One feature of the standard deviation is that, if the data set is bell-shaped, about 68% of the values will be within one standard deviation of the mean. This is part of the . This rule only applies to bell-shaped distributions.
::在以上的例子和问题中,您经常接近于在平均值的一个标准差范围内的值的百分比。标准差测量了与平均值的典型偏差。标准差的一个特征是,如果数据集是钟形,则约68%的值将在平均值的一个标准差之内。这是 。此规则只适用于钟形分布。Example 3-1
::例3-1Chin-Sun keeps track of her internet habits for 52 weeks. The hours she spent online each week form a roughly bell-shaped distribution. Chin-Sun calculates that she spent an average of 7.3 hours online per week, with a standard deviation of 2.7 hours. What range of values encompasses the middle 68% of time she spent online?
::Chin-Sun跟踪她的网络习惯长达52周。她每周在网上度过的时间大致是钟形分布。 Chin-Sun计算她每周平均在网上花费7.3小时,标准偏差为2.7小时。 她上网时间的68%是中间的68%,其数值范围是多少?Solution: Because the distribution is roughly bell-shaped, Chin-Sun can apply the empirical rule. One standard deviation above the mean is 10 hours. One standard deviation below the mean is 4.6 hours. The middle 68% of values is within the range where represents the values for the number of hours she spent online in a week.
::解决方案: 因为分布大致是钟形, Chin- Sun 可以应用经验规则。 高于平均值的标准偏差是 10 小时。 低于平均值的标准偏差是 4.6 小时。 中值的68%在4. 6 xx 10 范围内, x 代表她一周内上网时间的值 。Work it Out
::工作出来-
The height of trees in a tree farm form a roughly bell-shaped distribution. The mean height is 12.5 meters, and the standard deviation is 3 meters. What range of values
encompasses
the middle 68% of trees?
::树场树木的高度大致形成钟形分布。 平均高度为12.5米,标准偏差为3米。 中间68%的树木包含多少值范围? -
The mass of trucks at a shipping company form a roughly bell-shaped distribution. The mean mass is 2650 kilograms. The middle 68% of trucks have a mass ranging from 2000 to 3300 kilograms. What is the standard deviation?
::航运公司的卡车质量大致形成钟形分布,平均质量为2650公斤,68%的卡车中间质量为2000至3300公斤。 标准偏差是什么? -
In a thousand bags of candies, the number of green candies per bag form a roughly bell-shaped distribution, with a mean of 3 candies and a standard deviation of 2 candies. Based on this fact, what do you think the probability is that, if you
select one
of the thousand bags of candy at
random
, the number of green candies will be between 1 and 5? Why?
::在一千袋糖果中,每袋绿色糖果的数量大致形成钟形分布,平均为3只糖果,标准偏差为2只糖果。基于这一事实,你认为,如果随机选择一千袋糖果中的1袋,那么绿色糖果的数量会在1到5之间?为什么?
Summary -
Standard deviation
is used to measure the “typical” deviation from the mean for the values in the data set.
::使用标准偏差来衡量与数据集中数值平均值的“典型”偏差。 -
To find the standard deviation:
-
Find the sum of the squared differences between each value and the mean,
::查找每个值和平均值之间的平方差和, -
Divide the sum by one less than the number of values,
::将总和除以一个减去数值数, -
Then take the square root.
::那就拿平方根来
::要找到标准差: 找出每个值和平均值之间的平方差总和, 将总和除以少于数值数的一小部分, 然后选择平方根 。 -
Find the sum of the squared differences between each value and the mean,
-
The empirical rule
states that for bell-shaped data, about 68% of the values will be within one standard deviation of the mean.
::经验规则规定,对于钟形数据,约68%的数值将低于平均值的一个标准差。
-
For each value, find the square of the difference between the value and the mean.